Week - 4
AIM
Implement control logic of a “ washing machine” and “gear shift” using Stateflow.
OBJECTIVE-1
Implement control logic of a “washing machine” using Stateflow as per the given sequence.
- If the power supply is available, the system gets activated.
- If the water supply is not available, stop the process and indicate through the LED.
- Soaking time should be 200s followed by washing time of 100s.
- Then rinsing happens for the next 20s and dryer runs for the 50s.
- After all the process has completed turn on the finished LED.
DESCRIPTION
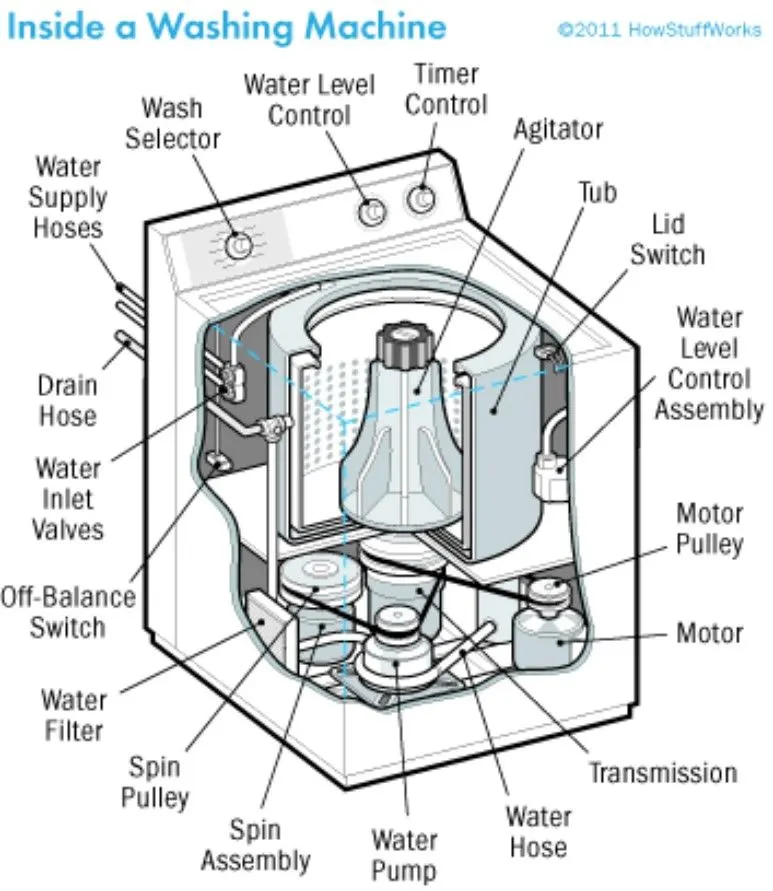
figure 1.1 washing machine inside view.
- Washing machine is a home appliance used to wash laundry.
- The main principle behind the working of a washing machine is the centrifugal and centripetal forces. The centrifugation helps quicken the sedimentation process of different density particles to clean the laundry in the washing machine.
- Initially put the clothes inside the inner drum.
- The washing machine operates in two primary cycles, those are the washing cycle and the rinse cycle.
- The washing cycle involves the principle of centrifugal force. This force’s direction is from inside to outside which makes sure that every part of the cloths is rinsed adequately in the soap water mixed in the machine.
- The rinse cycle involves the principle of centripetal force. This force acts from outside to inside and creates a vacuum like space in the middle of the washing machine. These two cycles work one after another several times as a result, the entire cleaning process occurs.
- Finally the spin is in “on” condition such that all the clothes inside get dry to their maximum.
- Stages of washing machine are:-
- Soaking
- Washing
- Rinsing
- Drying
WASHING MACHINE SIMULINK MODEL
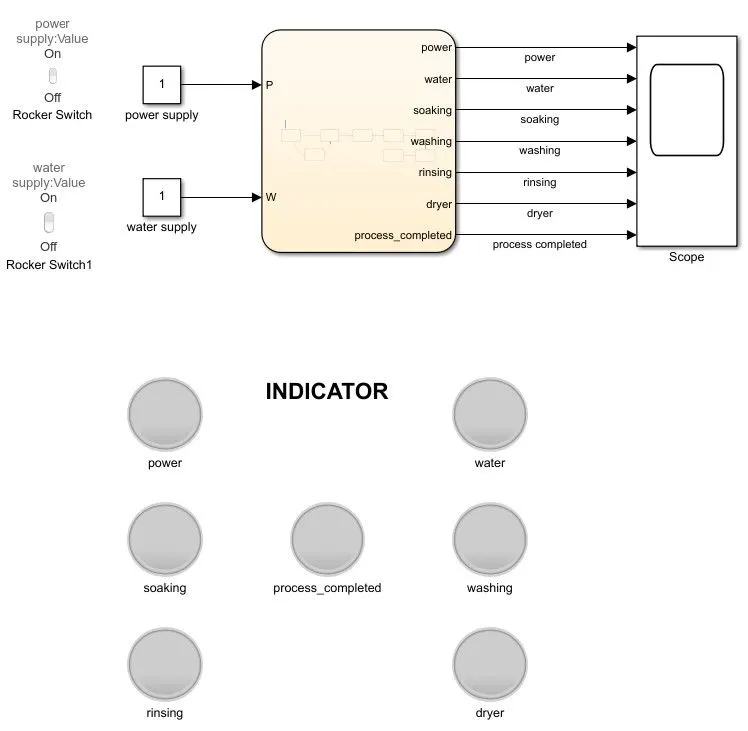
figure 1.2 washing machine simulink model.
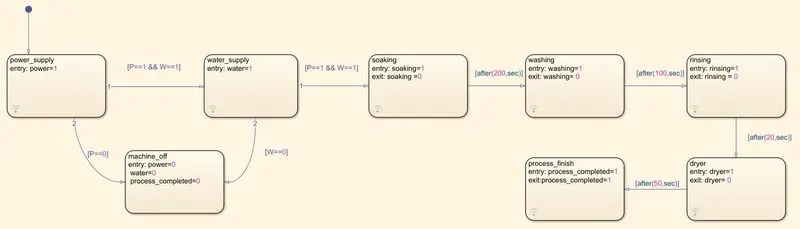
figure 1.3 inside of chart
google drive link-click here for washing machine simulink model.
EXPLANATION
- initially a chart block is created and its inside contains control logic state flow as per conditions.
- State flow logic needed two inputs, one is power supply and the other is water supply. Which is controlled through a rocker switch.
- Chart receives two inputs such as power (P) and water (W).
- Chart gives 7 outputs according to the states which are connected to the scope and respective indicator lamps.
- As per the control logic while running the simulation. The indicator lamps show or indicate which state is currently working in it.
- The scope which shows the working interval of each state.
- In control logic there are 8 state blocks are there. Which is power supply, water supply, soaking, washing, rinsing, dryer, process_finish, and machine_off.
- States are connected as per logic that is input condition and time schedules and state also contain some data variables.
- These data variables are adjusted as per types of data required such as input data, output data, etc by using symbols pane settings.
- In the explanation of the chart, the first state is power supply. It outputs variable power is equal to 1 and it is connected to two other states one is water supply and the other is machine_off.
- The water supply state is active, if the conditions P and W are equal to 1. Where P is power input and W is the water input.
- The machine_off state is active if P is equal to 0, w is equal to 0.
- If power and water supply are on then following the water supply state, next is the soaking state. The soaking state provides a variable soaking which is 1 at entry and 0 at the exit. These outputs show the working time of soaking states in the scope as well as in the indicator lamp. Here the condition is working time of soaking is 200s.
- After the 200s the washing state is active. Here also provide entry and exit variable output to show the working interval of washing. Here the time is set to 100s.
- After the 100s the rinsing state is active. Here also provide entry and exit variable output to show the working interval of rinsing. here the time is set to 20s.
- After the 20s the dryer state is active. Here also provide entry and exit variable output to show the working interval of the dryer. Here time is set to 50s.
- After the 50s the process_finish state is active. It is indicated in the indicator lamp as yellow light and other indicators except for power, water, and process completed show black color which means that is inactive.
RESULT
- Here step wise output indicator vision given below.
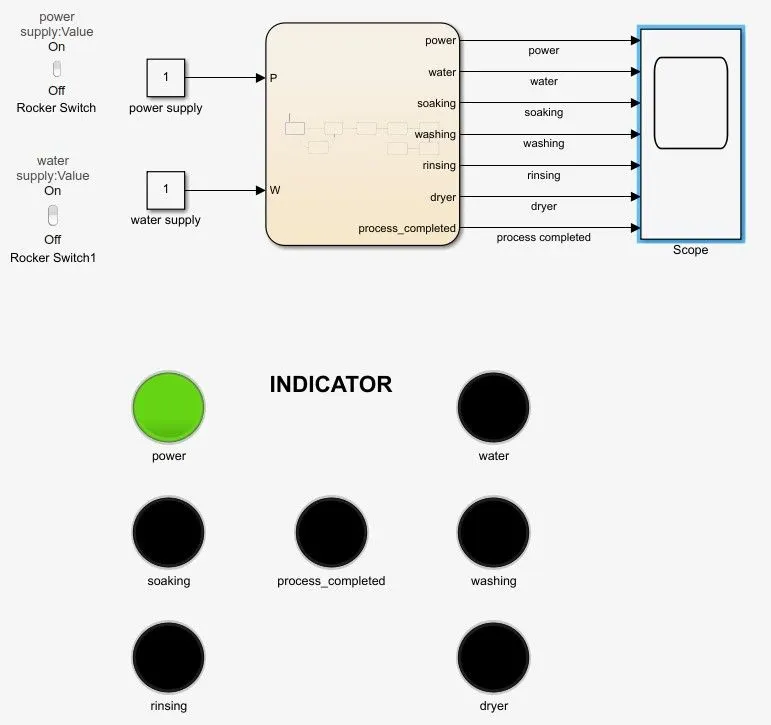
figure 1.4 power switch is on and state power is active.
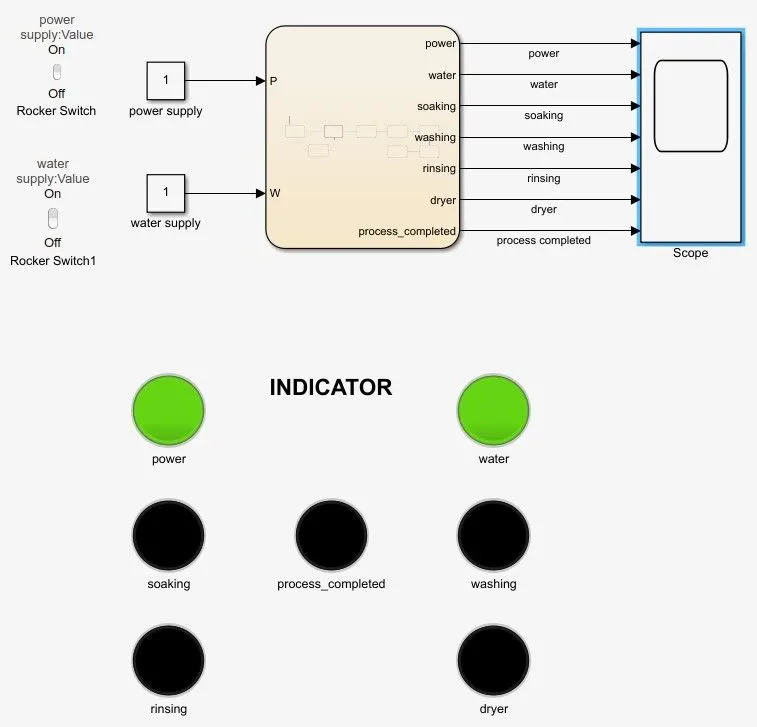
figure 1.5 here water supply and power supply are in on condition
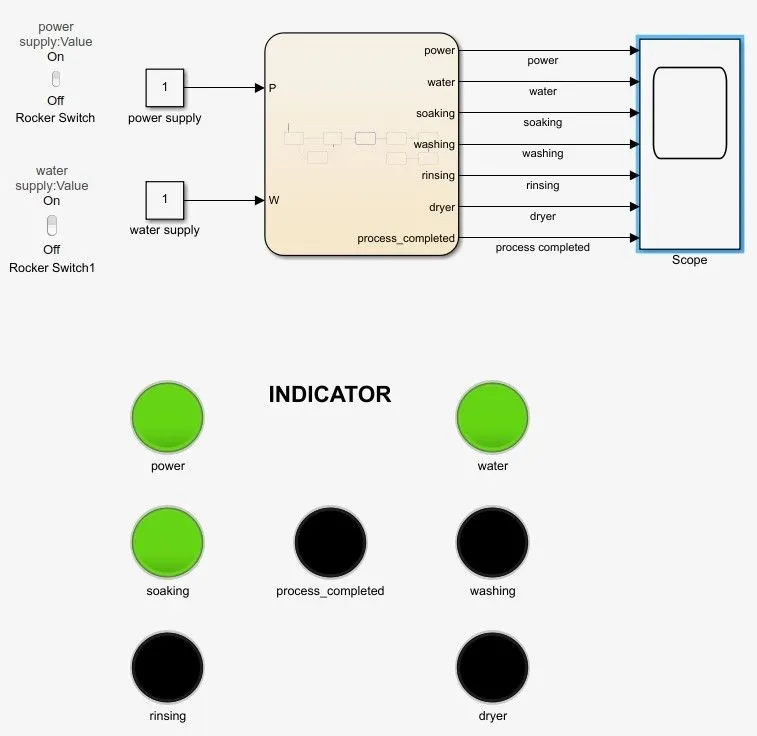
figure 1.6 here soaking process is carrying.
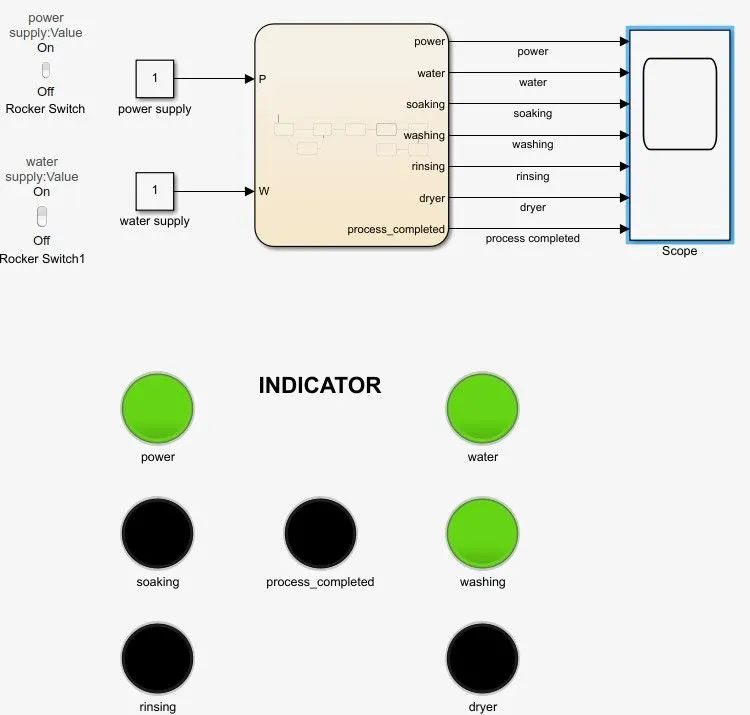
figure 1.7 here washing process is carrying. Soaking is over, that is inactive shows in black.
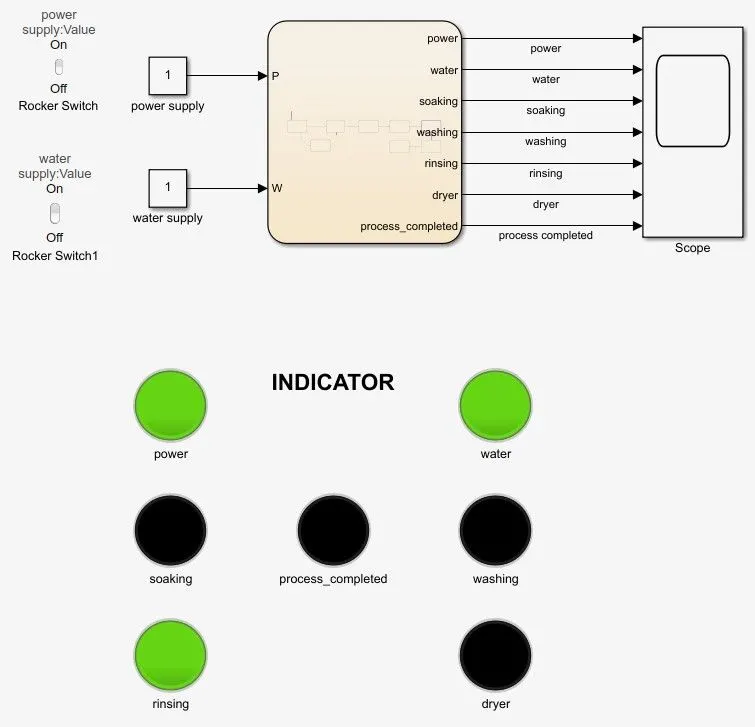
figure 1.8 here rinsing is active.
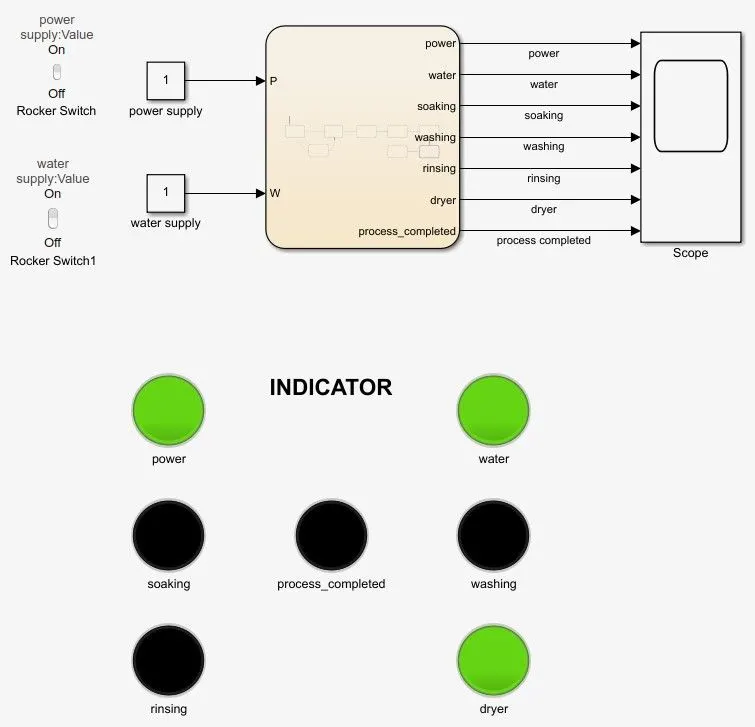
figure 1.9 here dryer is active.
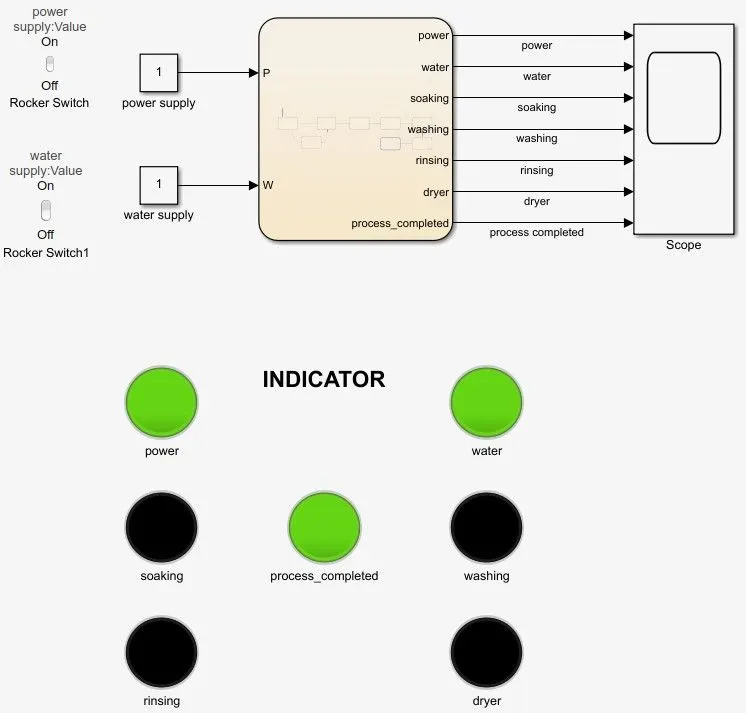
figure 1.10 here all processes are completed
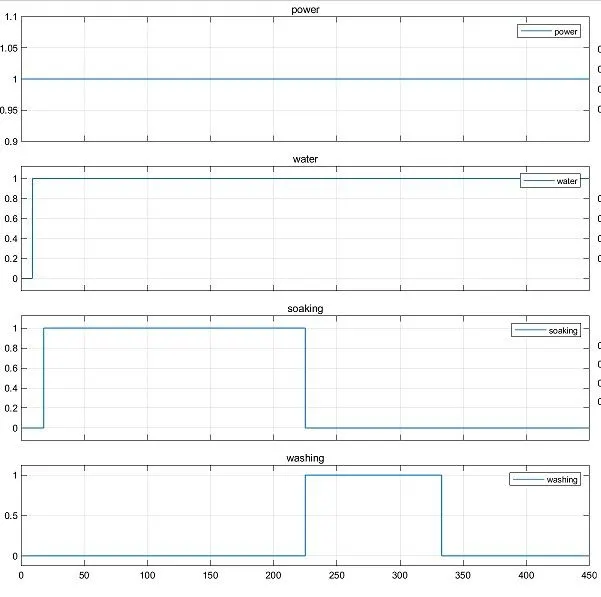
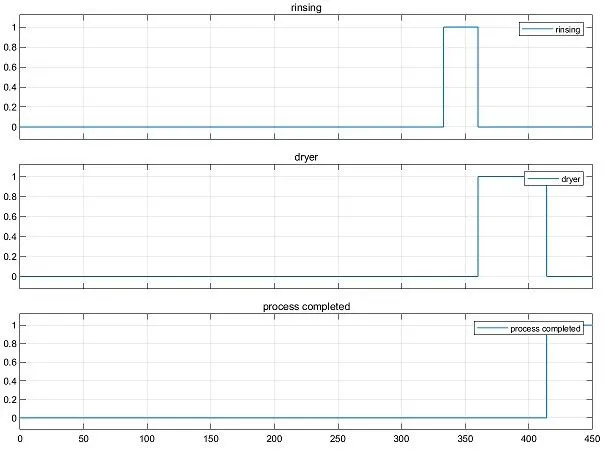
figure 1.11 scope view- it gives the working interval of each state.
OBJECTIVE-2
- Make a Simulink chart for the “gear shift” logic as per the below conditions.
- Speed range(kmph) gear
0 to 15 1
16 to 25 2
26 to 40 3
41 to 60 4
Above 60 5
- Give speed input while the simulation is running and display the gear number.
DESCRIPTION
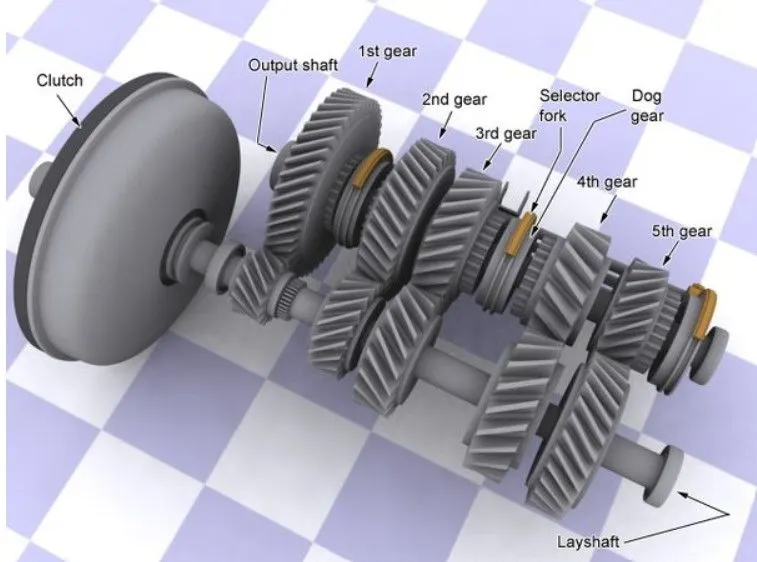
figure 2.1 gear shift
- Gears are mainly used for transmitting power from one part of a machine to another.
- Gear shift mechanism which shifts gear is usually located in the gearbox cover and is driven by a rocker lever.
GEAR SHIFT SIMULINK MODEL
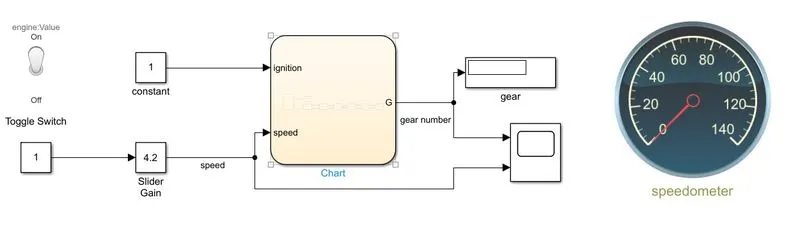
figure 2.2 simulink model of gear shift.
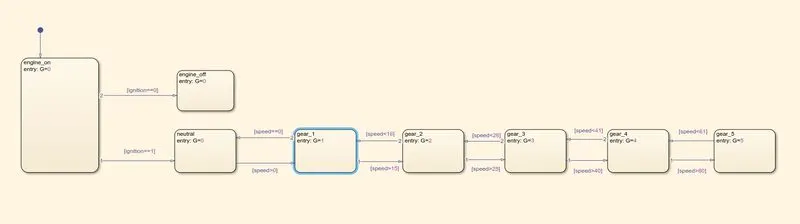
figure2.3 chart's inside view
google drive link- click here for gear shift simulation file
EXPLANATION
- This model consists of the chart, slider gain, constant toggle switch, display, scope, and speedometer.
- The chart contains control logic for the gear shift and it receives two inputs one is ignition which is a constant block controlled by a toggle switch and the other is speed which is controlled by a toggle switch and the other is speed which is controlled by slider gain block. In slider gain block minimum value and the maximum value is set to 0 and 140 respectively.
- The chart has only one output which is G, which is the gear number. This output is connected to the display which gives the gear number according to the speed.
- Speed data and gear number data are connected to the scope. Which gives the graphical output of speed and gear number concerning time.
- Speedometer is provided for viewing instant speed. Here circular gauge block is used as a speedometer, which is connected to the speed data.
- Inside the chart block is consist of control logic. The initial state is ‘engine on’ here output G is equal to 0, that is neutral. If the ignition is equal to 0 then the state is changed to engine off state. Here also output G is equal to 0.
- For the chart, speed and ignition are set to input data and G is set to output data using symbol pane settings.
- If the ignition is equal to 1, then the state is changed to the neutral state. Here gear number is 0.
- State changed to gear1 state, if the speed is greater than 0 and less than or equal to the 15. The condition is written in the square bracket and is on the arrow line.
- Similarly remaining states are conditioned and provide gear outputs.
- State change to gear2 if the speed is greater than 15 and equal to 25.
- State change to geat3 if the speed is greater than 25 and less than or equal to 40.
- State change to gear4 if the speed is greater than 40 and less than or equal to 60.
- State change to geat5 if the speed is greater than 60.
- The speed is varied by slider gain and it can be visible to the speedometer. Where stop time is set to inf.
RESULT
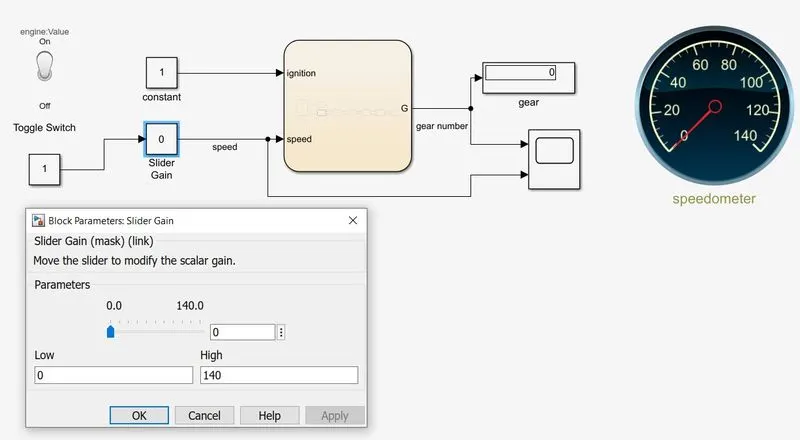
figure 2.4 here speed is 0 and gear number shows 0.
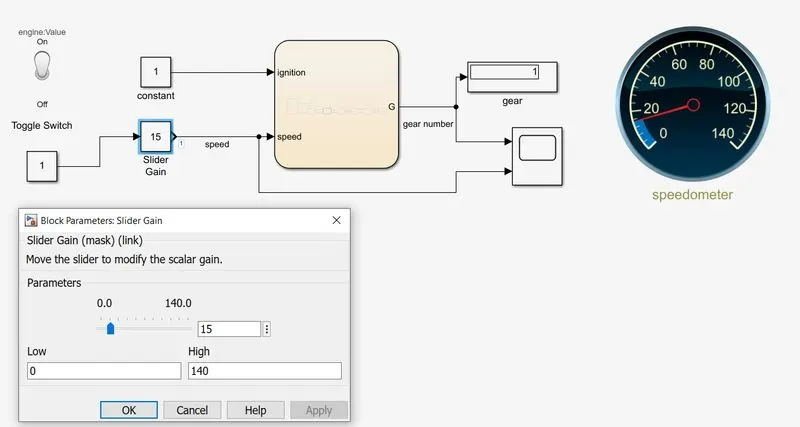
figure 2.5 here speed is 15 and gear number shows 1.
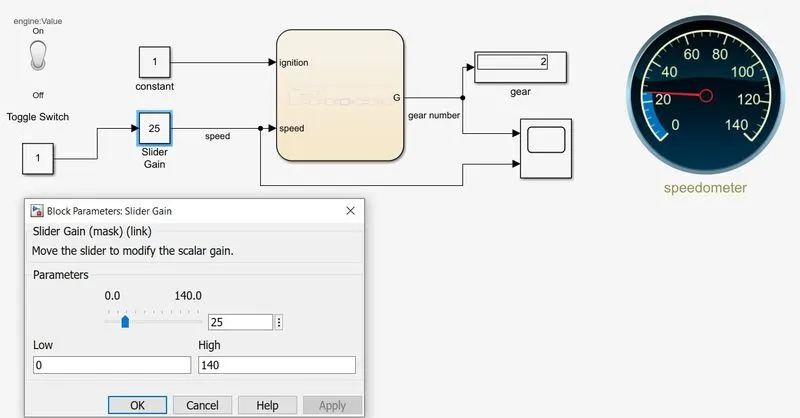
figure 2.6 here speed is 25 and gear number shows 2
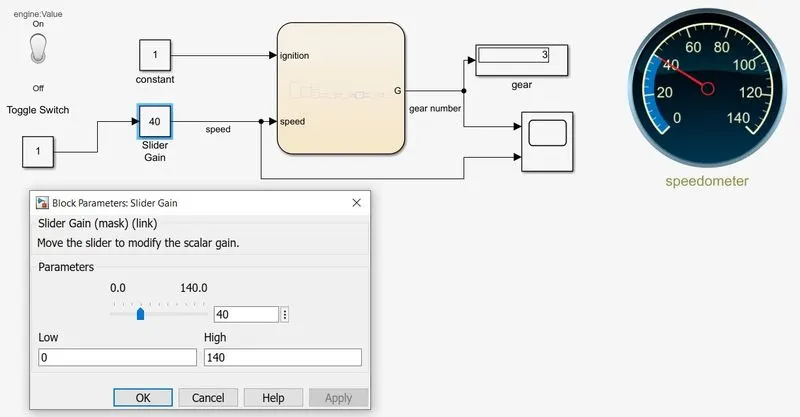
figure 2.7 here speed is 40 and gear number shows 3.
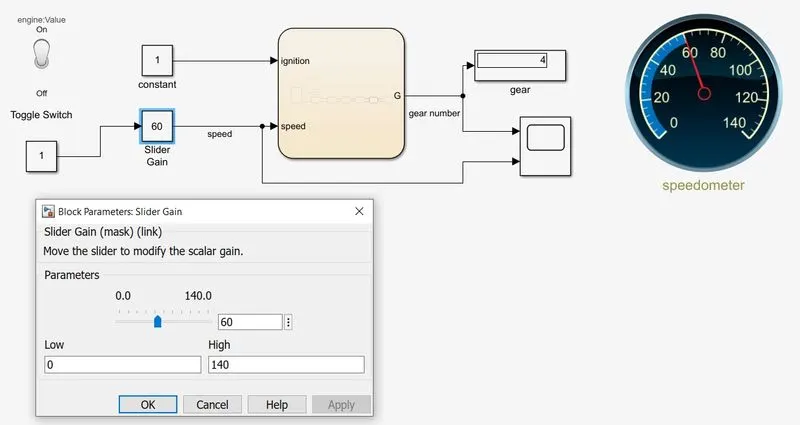
figure 2.8 here speed is 60 and gear number shows 4.
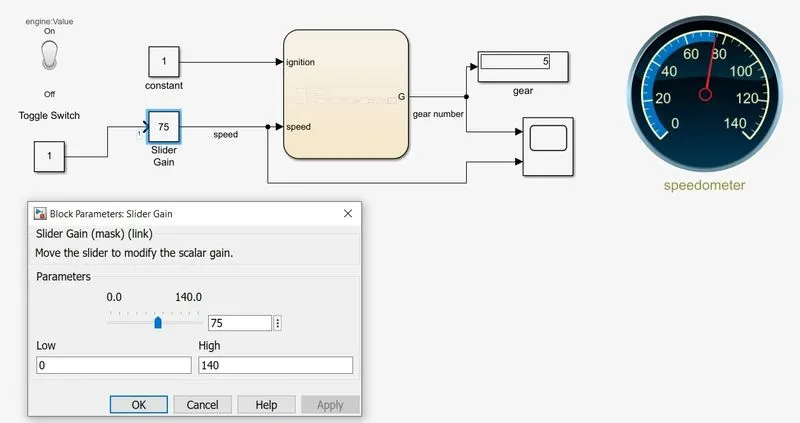
figure 2.9 here speed is greater than 60 and gear number shows 5.
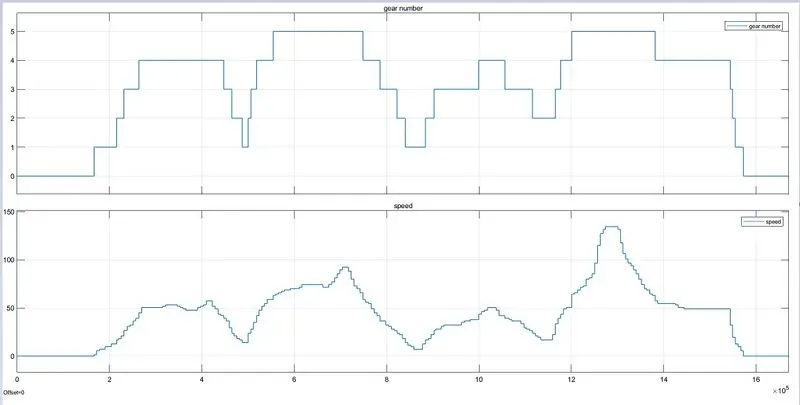
figure 2.10 scope view of speed and gear number.
CONCLUSIONS
- In the case of washing machine simulation, the result got the corresponding LED indication for each process working and process completed.
- In the case of gear shift simulation, it displays the corresponding gear number as the speed given using slider gain.