Week - 4
1. To implement control logic of a washing machine using stateflow as per given sequence,
Objective:
- If the power supply is available, the system gets activated
- if the water supply is not available, stop the process and indicate it through LED
- Soaking time should be 200sec folowed by washing time of 100sec
- then rinsing happens for next 20sec and dryer runs for 50sec
- after all the process have completed turn on the finished LED.
Washing Machine:
Washing machine is the machine used to wash the various types of cloths without applying any physical efforts. With washing machine you don't have to rub the cloths with hand or squeeze them to remove the water from them. the washing machine enables us to wash our cloths automatically without having supervise its operation. all we have to do is put the cloths in the machine and select the wash mode. the washing machine automatically takes in the amount of water requires and it also automatically sets time for washing, rinsing and drying as per the selected mode and the amount of clothes. here we are going to design the control logic of a washing machine by using state flow.
Procedure:
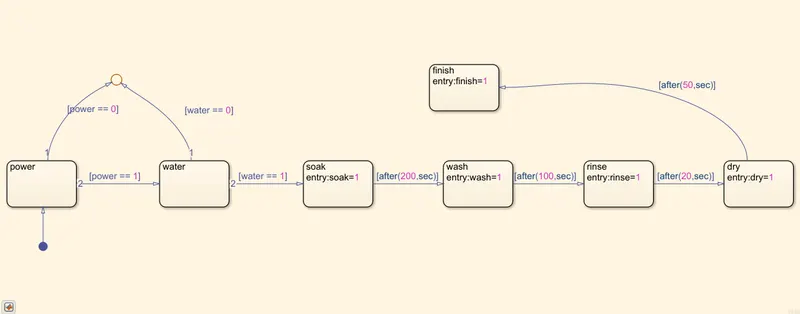
First we are going to create a chart block for representing the stateflow as per the given conditions. In this first we have to take state blocks to set the particular procedure as per the given data. And a junction block is taken to terminate the signal flow and return. The following image is the state flow chart for our model:It is designed as:
If power supply is OFF i.e. 0, the process is terminated at the junction otherwise 1 is carry foward. If the water supply is OFF (0), the process is terminated or else 1 is carry. after switching on the power and water supply soak block get activated and soaking process will begin. After 200sec of soaking, the wash block gets activated here the washing process will starts, after 100sec of washing, rinse block gets activated and rinising action takes place. After 20sec of rinsing action, dry block gets enabled and drying process will begin. After 50sec of drying action Finish block gets enabled. Finishing is to terminate the signal flow and exit the chart.
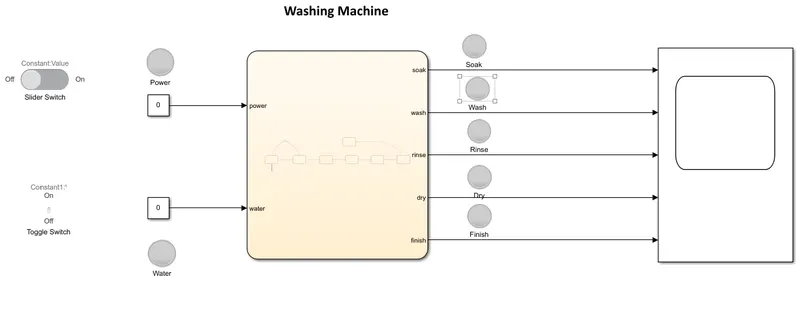
After coming out from the chart we are going to connect inputs and outputs. HEre we are taking the Power and Water supplies as the inputs and soak, wash, rinse, dry, finish are taking as outputs. Here two constant blocks are taken and connected across power and water as inputs. To connect the inputs to the switches we are taking slider switch and toggle switch and connecting them to the inputs respectively. To observe the On and Off conditions we are taking two lamps across the input side and five lamps across the output side to represent each process clearly. A common scope block is connected across the all outputs to observe the whole process through the plot. The Simulink model of washing machine according to the conditions is shown in the following image:
Now the conditions will check,
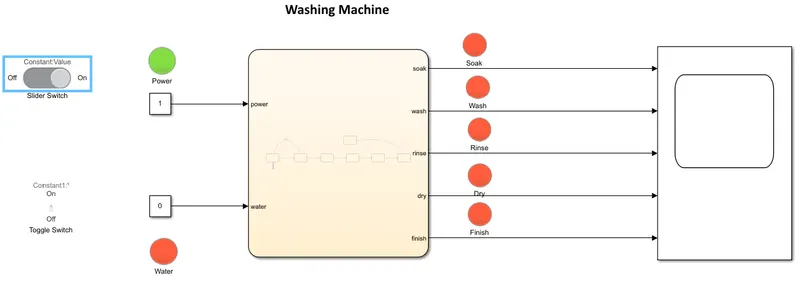
1. Power is ON, Water is OFF: The power lamp will glow and all other will be off.
2. Power is ON, Water is On: then the soak process will begin. Intially it is OFF at t=0sec, after 20sec it will starts and soak lamp will glow.
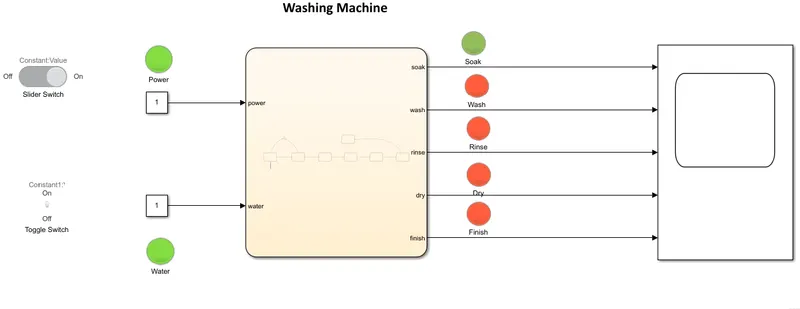
3. After 200sec the washing process will begin i.e. t=220sec, then the wash lamp will glow.
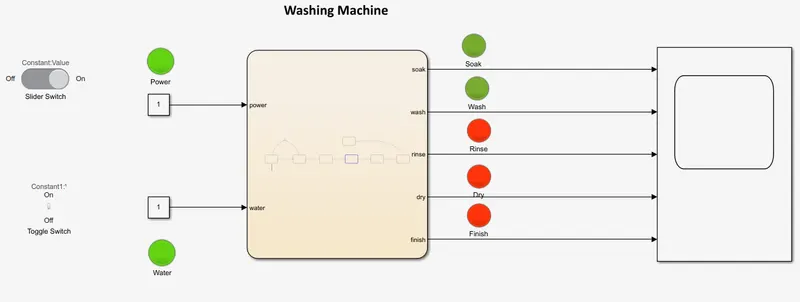
4. After 100sec the rinsing process will bigin i.e. t=320sec, then the rinse lamp will glow.
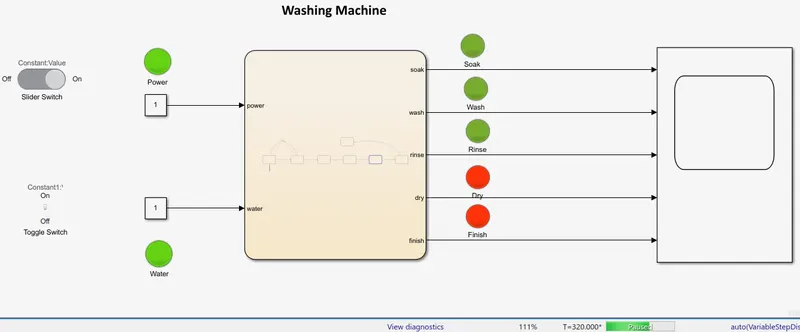
5. After 20sec the drying process will begin i.e. t=340sec, then the dry lamp will glow.
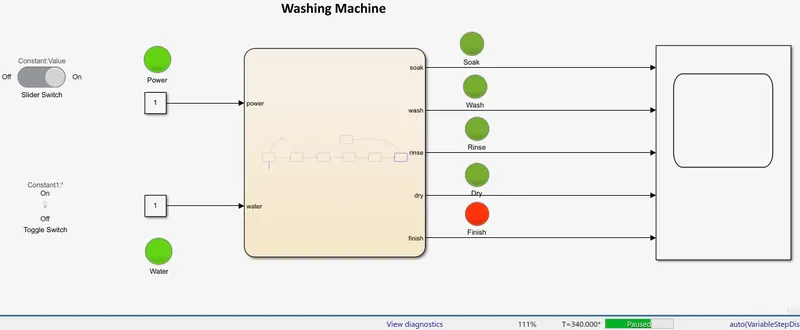
6. After 50 sec the finsh lamp will glow which indicated that the process is completed i.e. t=390sec.
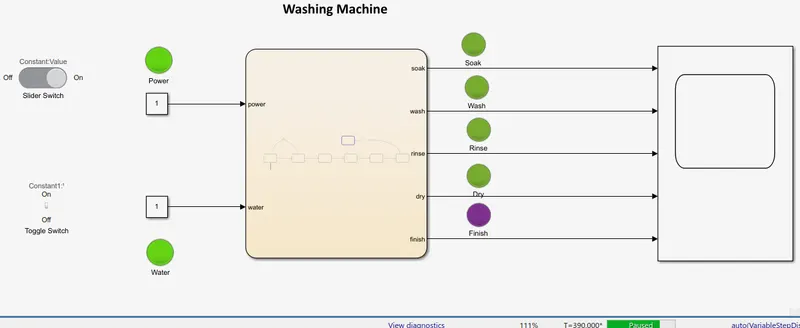
We can observe the output plot of each block from the Scope. The whole process result is shown in the following image. Different process are plotted with different colours. The respective colours are indicated at to right corner of the image.
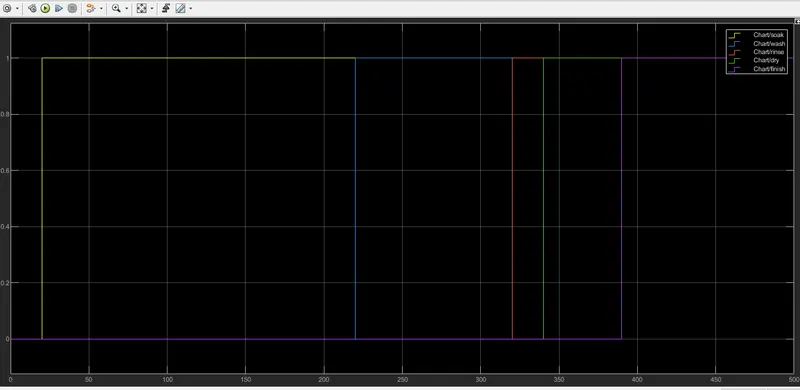
Hence the control logic of a washing machine by using state block is implemented and its process has been observed as per the given conditions.
2. To make a Simulink chart for the Gear Shift logic as per the below conditions,
Objective:
Speed range(km/hr) Gear
0 to 15 1
16 to 25 2
26 to 40 3
41 to 60 4
Above 61 5
Give speed input while the simulation is running and display the gear number.
Procedure:
First we have to prepare a chart for defining the process of state flow. For this we have to take a state block to indicate the different level of operatiuon at different instinces. The following image shows the state flow daigram of the given model as per the data.
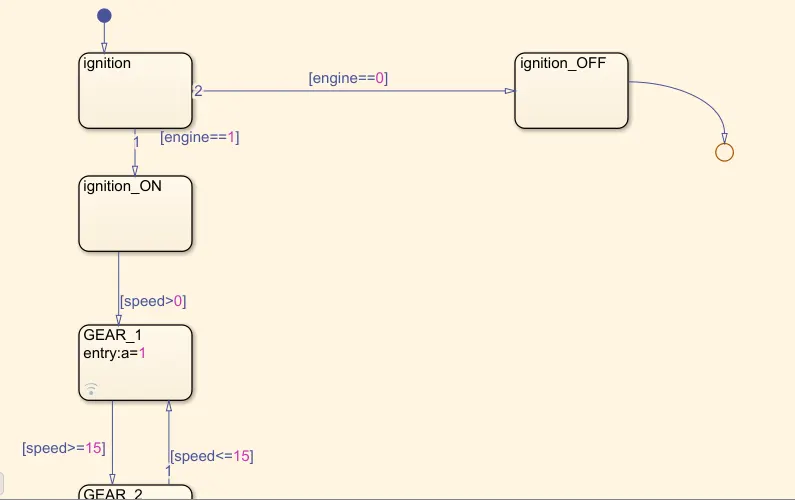
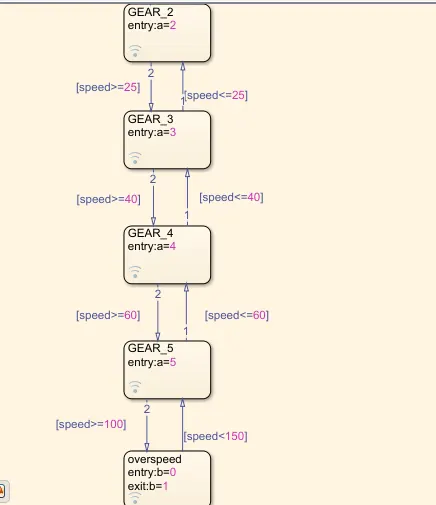
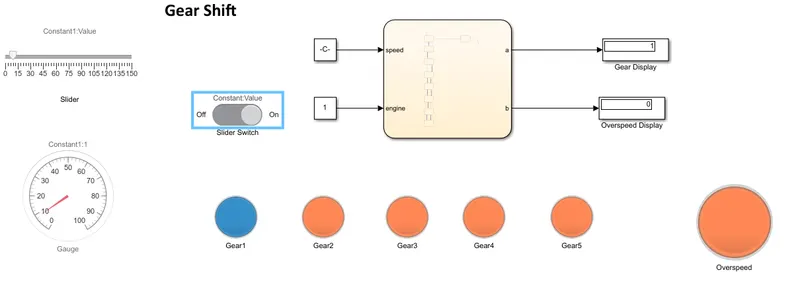
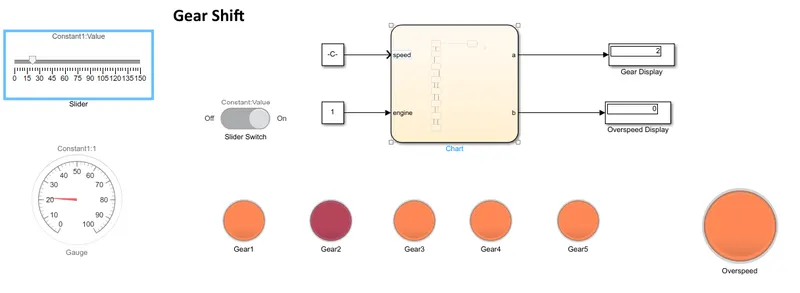
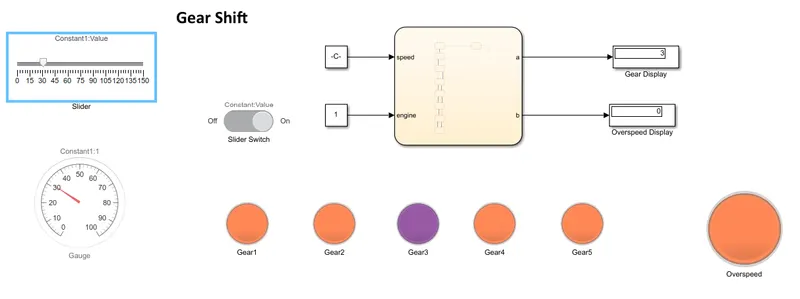
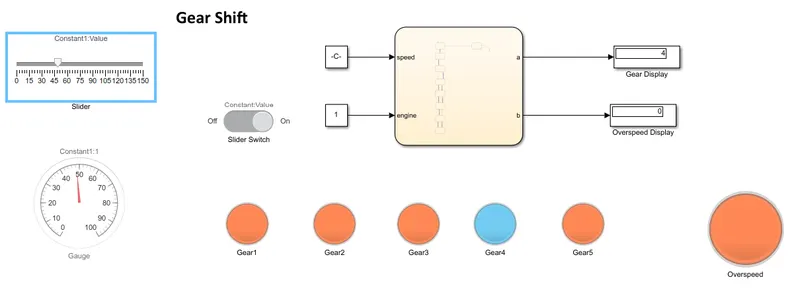
Where the speed and engine are taken as the inputs. Two constant blocks are taken and connected to the input side and they are defined as speed and engine. Where slider block is taken and connected to the constant block which represents the speed. From the slider block we can change the speed values, where we set the maximum limit of slider as 150 as per our requirement. And a guage block is also selected to easily show the speed and this is also connected to speed constant block. Slider switch is taken and which is connected to the engine block to ON and OFF the engine as 1 and 0 respectievely. Two display blocks are taken one is for the gear indication and another one is for Overspeed indication. Six lamps are taken where five lamps are connected to the five gears respectievely which shows the each gear process through LED. And another one is connected to overspeed block which indicates the overspeed through LED. The following image shows the Simulink model of Gear shift model as per given data.
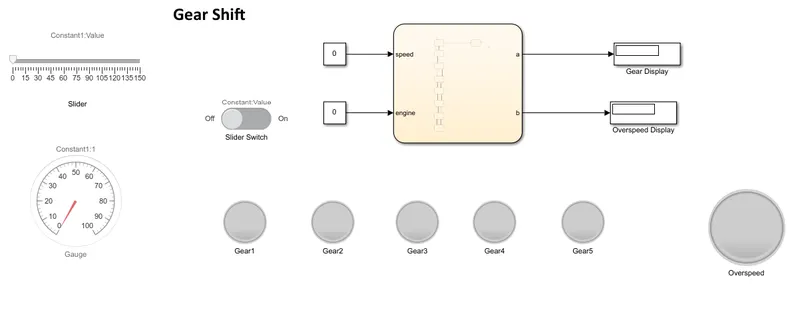
Engine is ON through the slider switch, and speed is set through the slider block.
1. When speed is between 0-15, the gear1 will be enabled and it indicated through Gear1 LED. In the gear display block the gear is indicated as 1.
2. When speed is between 16-25, the gear2 will be enabled and it indicated through Gear2 LED. In the gear display block the gear is indicated as 2.
3. When speed is between 26-40, the gear3 will be enabled and it indicated through Gear3 LED. In the gear display block the gear is indicated as 3.
4. When speed is between 41-60, the gear4 will be enabled and it indicated through Gear4 LED. In the gear display block the gear is indicated as 4.
5. When speed is above 61, the gear5 will be enabled and it indicated through Gear5 LED. In the gear display block the gear is indicated as 5.
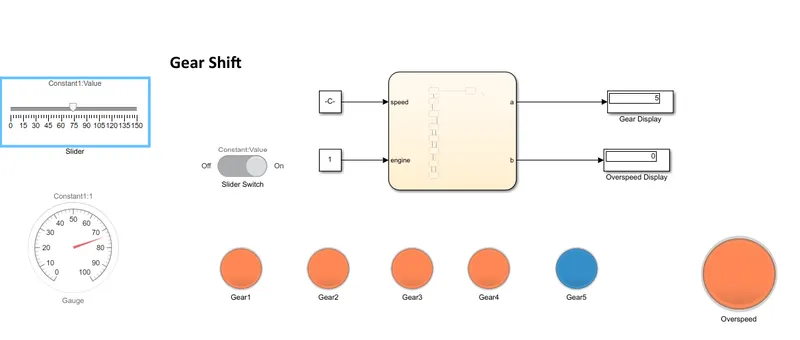
We are given the overload speed at above 100, so where the overload block will be enabled and indicates it through Overload LED. And in overspeed display block also it indicates the overspeed as 1 according to the data given in the state flow.
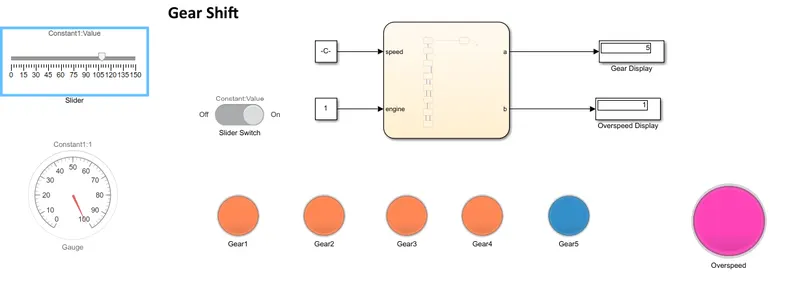
Hence all the conditions are achieved through the Simulation of Gear shift at the respective speed range.