Week - 4
Aim :
- Implement control logic of a “washing machine” using Stateflow .
- Make a Simulink chart for the “Gear shift” logic as per below.
Conditions for both cases :
- Implement control logic of a “washing machine” using Stateflow as per given sequence:
- If the power supply is available, the system gets activated
- If the Water supply is not available, stop the process & indicate through LED
- Soaking time should be 200s followed by Washing time of 100s.
- Then rinsing happens for next 20s & dryer runs for 50s
Give speed input while the simulation is running & display the gear number.
2. Make a Simulink chart for the “Gear shift” logic as per below conditions:
Speed Range(kmph) Gear
0 to 15 1
16 to 25 2
26 to 40 3
41 to 60 4
Above 61 5
Give speed input while the simulation is running & display the gear number.
Points To Remember :
Control logic :
It is the part of a controller that defines how a reactive system responds to events or conditional changes. Applications for control logic include: Supervising how to switch between different modes of operation. Scheduling a sequence of tasks or steps for a system.
Stateflow :
Stateflow (developed by MathWorks) is a control logic tool used to model reactive systems via state machines and flow charts within a Simulink model.
1st Case :
Implementing control logic of a “washing machine” using Stateflow :
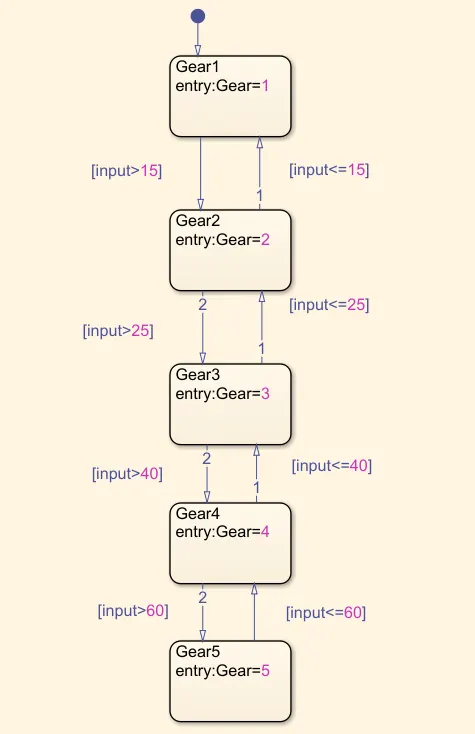
Sate Flow Logic :
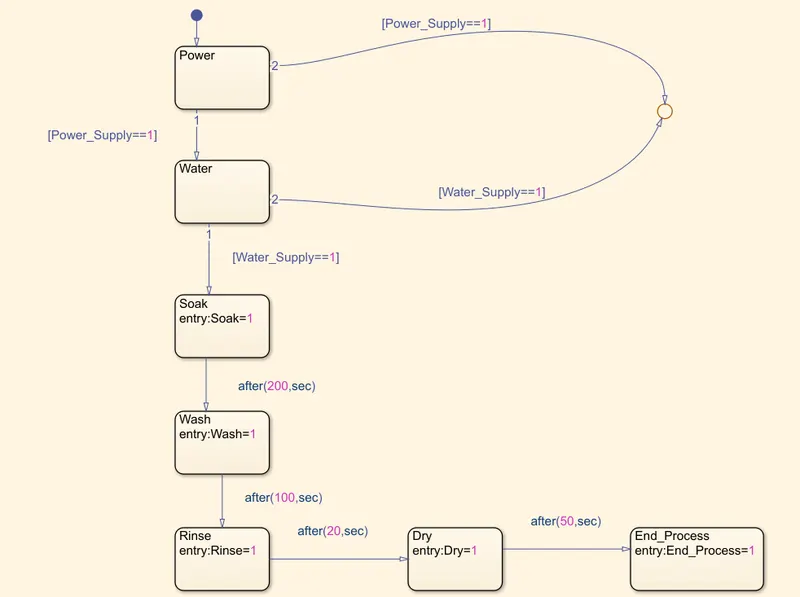
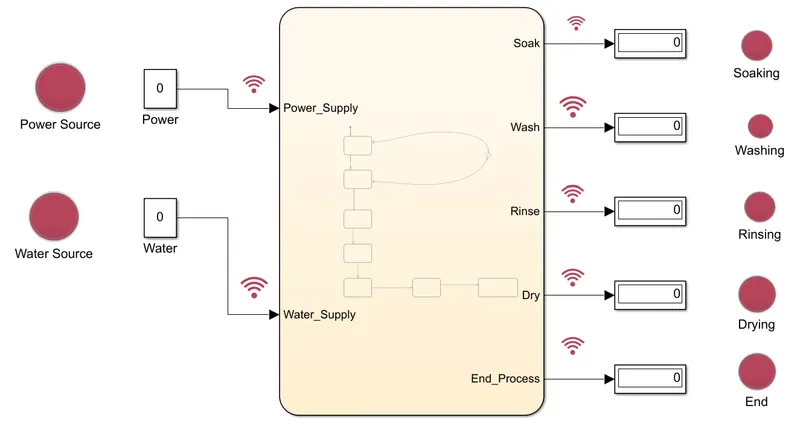
Simulink Model for Washing Machine :
1.Supplying the Power & Water as 1 & 1 respectively for given model.
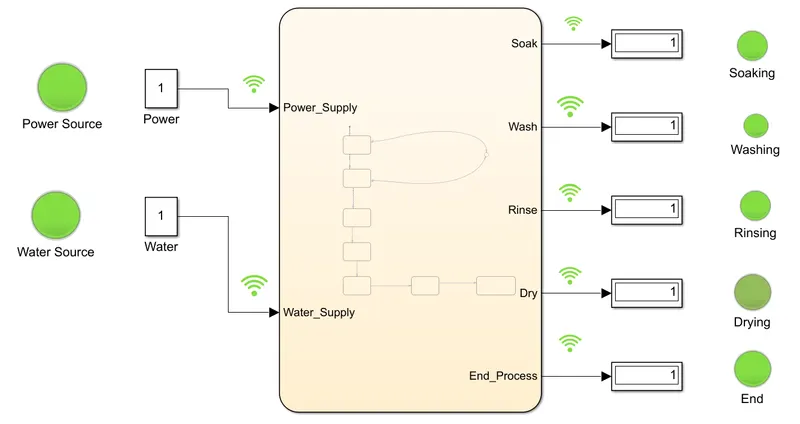
2.Supplying the Power & Water as 0 & 1 respectively for given model.
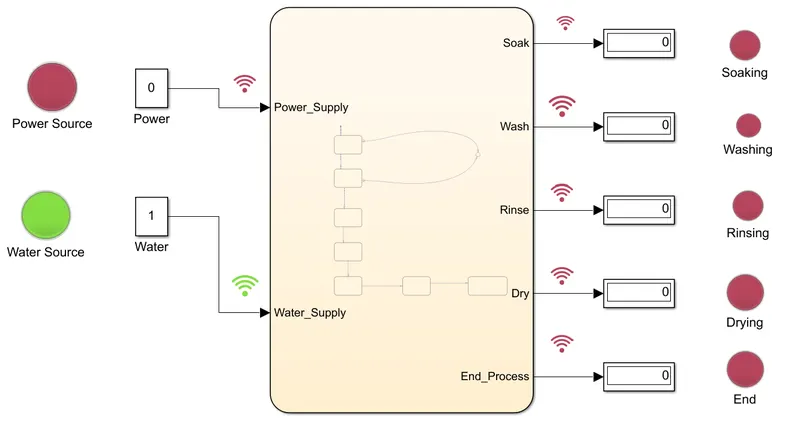
3.Supplying the Power & Water as 1 & 0 respectively for given model.
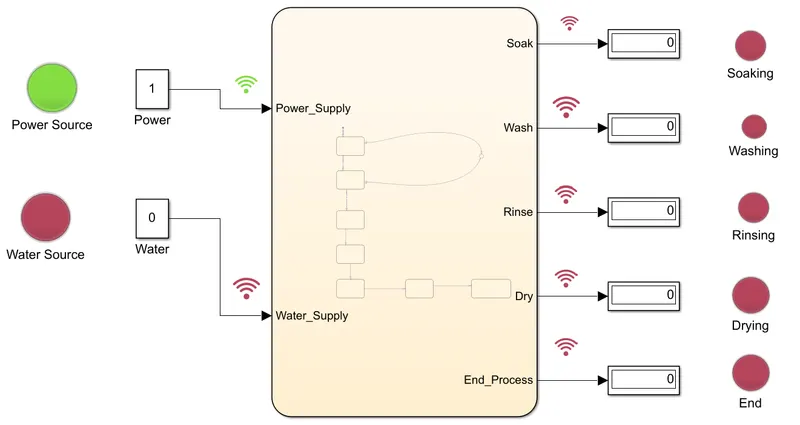
4.Supplying the Power & Water as 0 & 0 respectively for given model.
Input & Output Ports :
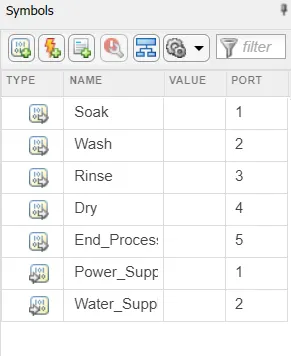
Explanation :
1.To create a simulink chart as per the satisfying all input conditions.
2.Open and check the symbol panel data to proper inputs & outputs.
3.Connecting the led lamps & displays properly.
4.Constants 1 & 0 keep changing which are connected to power and water supply Switches(on/off)
2nd Case :
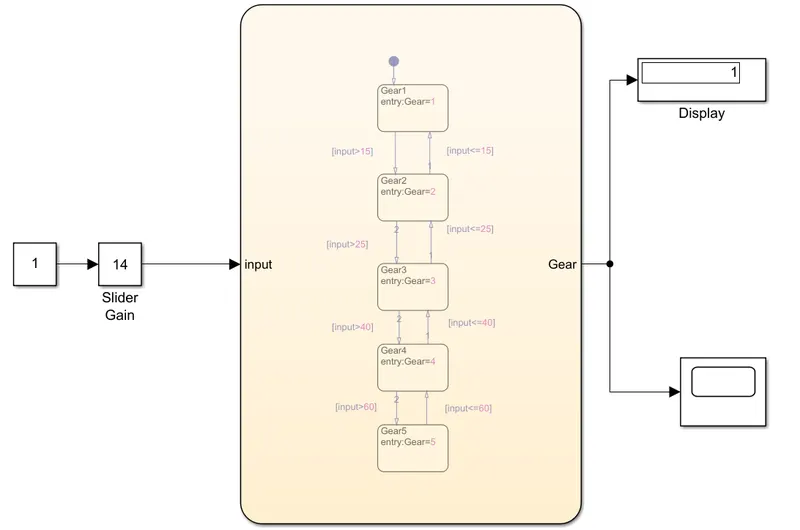
Making A Simulink chart for the “Gear shift” logic :
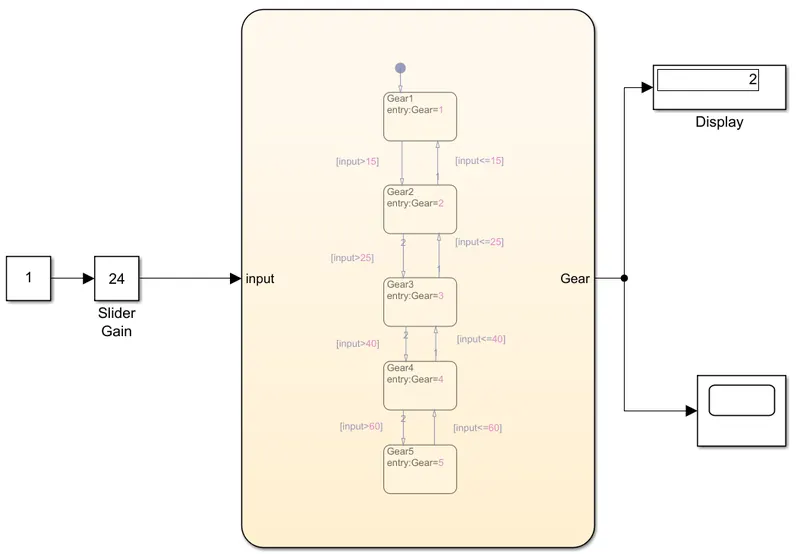
Gear Shift Simulink Model :
For Speed<15 [Gear 1]
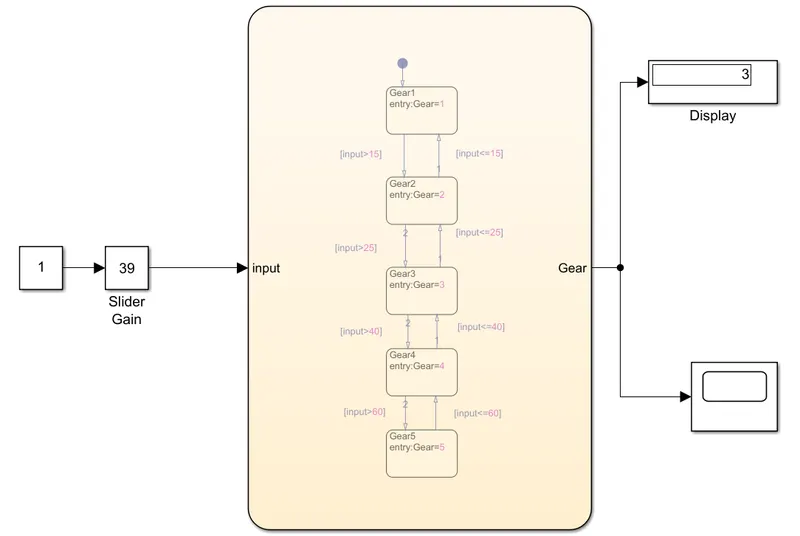
For Speed<25 [Gear 2]
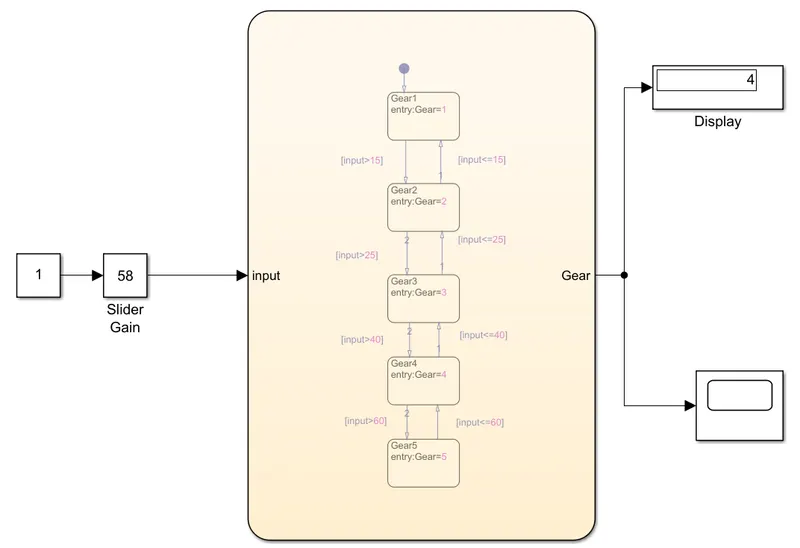
For Speed<40 [Gear 3]
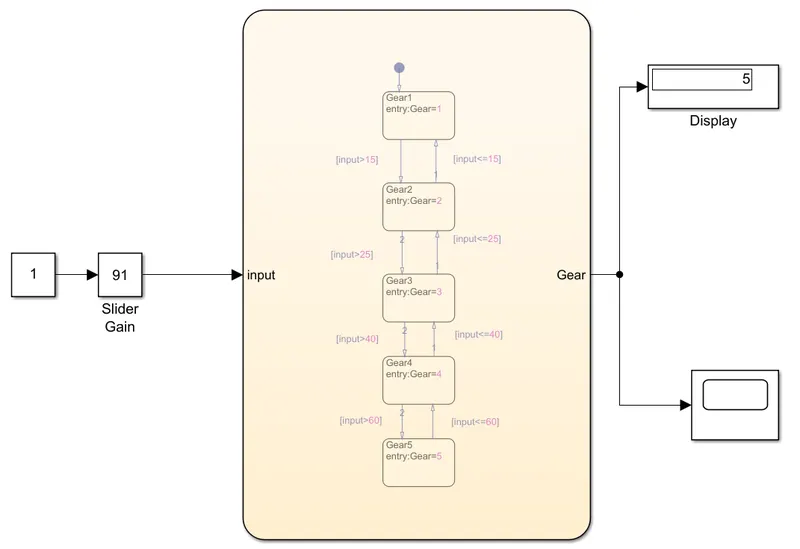
For Speed<60 [Gear 4]
For Speed>60 [Gear 5]
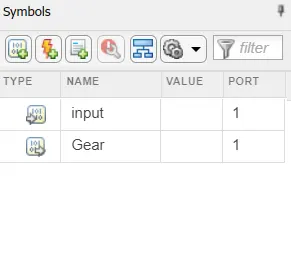
Input & Output Ports :
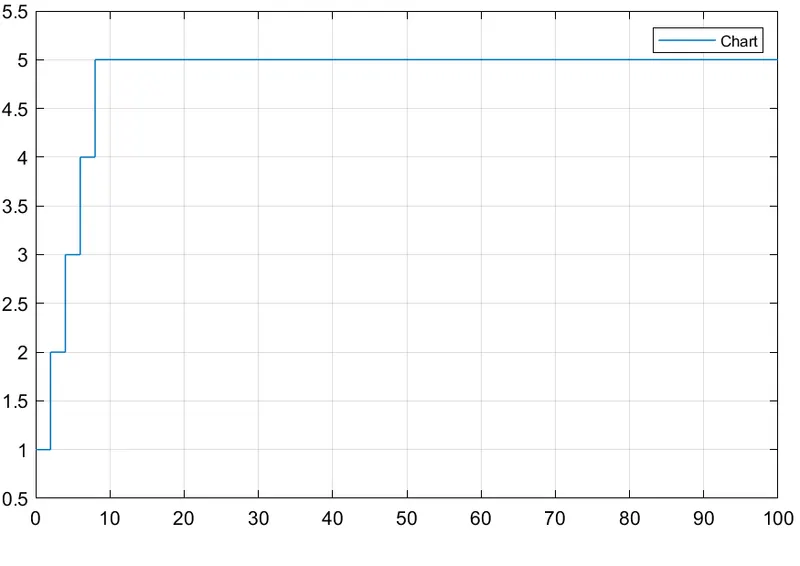
Variation in Gear Shifts :
Explanation :
1.To create a simulink chart as per the satisfying all input conditions.
2.Open and check the symbol panel data to proper inputs & outputs.
3.Connecting the scope & display properly.
4.Variatrion on slider gain leads to show the gear position in the display block.
Conclusion :
Hence Satisfying the both cases with as per Mentioned conditions.