Project 1 - Parsing NASA thermodynamic data
Aim Of The Project :
To Write a function that extracts the 14 co-efficients and calculates the enthalpy, entropy and specific heats for all the species in the data file.
Tasks :
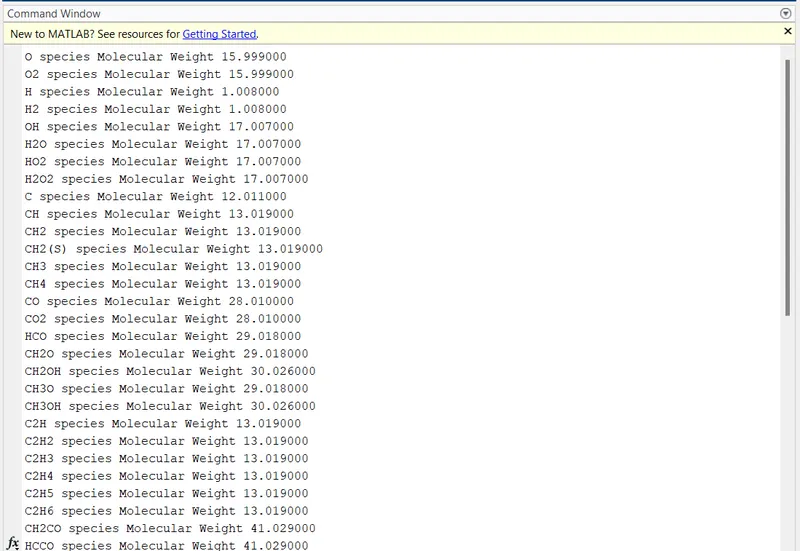
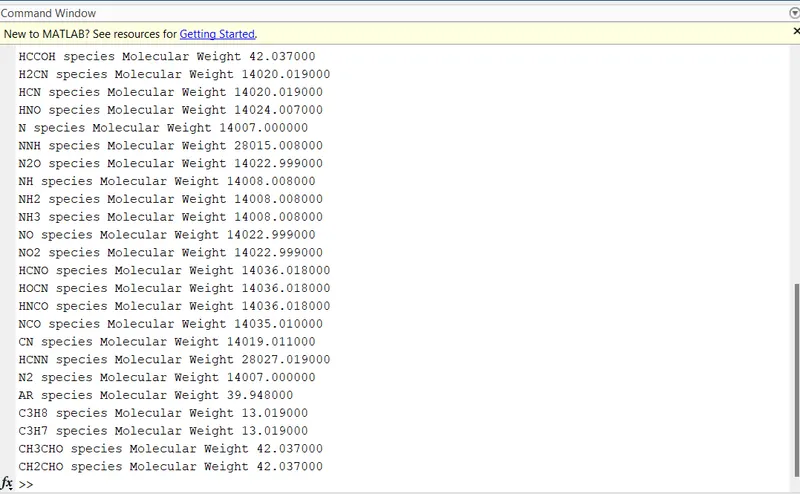
- Calculate the molecular weight of each species and display it in the command window.
- 3. Plot the Cp, Enthalpy and Entropy for the local temperature range (low temperature : high temperature) specific for each species.
- 4. Save the plots as images with appropriate names and dump them in separate folders for each species with suitable name. All these should be generated automatically.
- 5. The main program that you will submit will just take the "THERMO.dat" file as an input and generate Cp, H and S plots.
- 6. Please write a detailed report to describe your logic.
- Screenshot of the window where all the folders are saved.
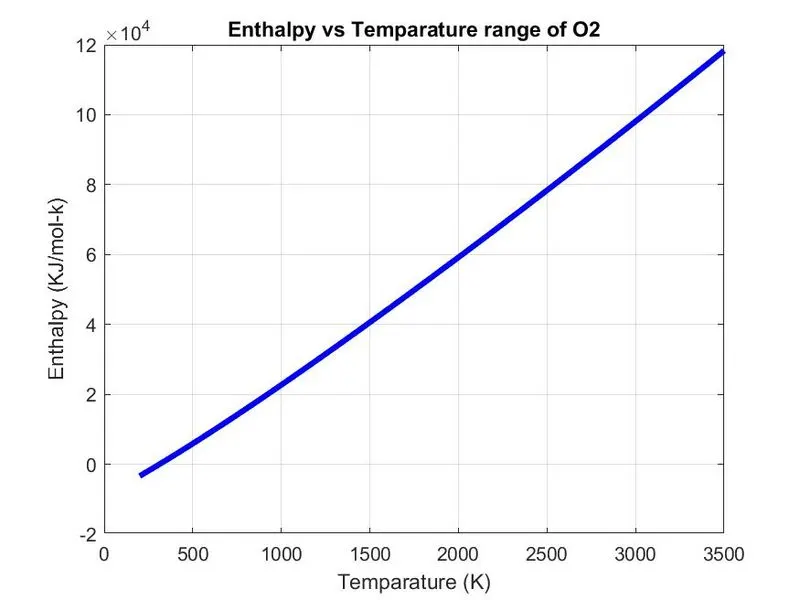
- Plots for o2, N2 and Co2 species (your program should be case insensitive, if it is going to take the species name as an input).
Points To Remember :
File parsing:
Parse essentially means to ''resolve (a sentence) into its component parts and describe their syntactic roles''
Specific heat:
The quantity of heat required to raise the temperature of one gram of a substance by one Celsius degree.
>Specific Heat Function Code:
% Specific heat Calculation Function

function Cp = Specific_heat(a1,a2,a3,a4,a5,a8,a9,a10,a11,a12,T,R,tempmid)

% Cp For high & low temps

if (T <= tempmid)

    Cp = R*(a8+ (a9*T) + (a10*(T).^2) + (a11*(T).^3) + (a12*(T).^4));

else
    Cp = R*(a1+ (a2*T) + (a3*(T).^2) + (a4*(T).^3) + (a5*(T).^4));
end
end
Enthalpy:
A thermodynamic quantity equivalent to the total heat content of a system. It is equal to the internal energy of the system plus the product of pressure and volume
>Enthalpy Function Code:
% Enthalphy Calcualation Fuction

function H = Enthalphy(a1,a2,a3,a4,a5,a6,~,a8,a9,a10,~,a12,a13,T,R,tempmid)

% Enthalpy For High & Low Temps

if (T <= tempmid)
    H = R*T.*(a8 + ((a9*T)/2) + ((a10*(T).^2)/3) + ((all*(T).^3)/4) + ((a12*(T).^4)/5) + ((a13./T)));

else
    H = R*T.*(a1 + ((a2*T)/2) + ((a3*(T).^2)/3) + ((a4*(T).^3)/4) + ((a5*(T).^4)/5) + ((a6./T)));

end
end
Entropy:
A thermodynamic quantity representing the unavailability of a system's thermal energy for conversion into mechanical work, often interpreted as the degree of disorder or randomness in the system.
Entropy Function Code:
% Entropy calculation function

function S = Entropy(a1,a2,a3,a4,a5,a7,a8,a9,a10,~,a12,~,a14,T,R,tempmid)

% Entropy For High & Low Temps

if (T <= tempmid)
    S = R*(a8.*log(T) + (a9*T) + ((a10*(T).^2)/2) + ((all*(T).^3)/3) + ((a12*(T).^4)/4) + a14);

else
    S = R*(a1.*log(T) + (a2*T) + ((a3*(T).^2)/2) + ((a4*(T).^3)/3) + ((a5*(T).^4)/4) + a7);

end
end
Gas constant:
The constant of proportionality in the gas equation. It is equal to 8.314 joule kelvin−1 mole−1.
Molecular Weight:
The sum of the atomic masses of all atoms in a molecule, based on a scale in which the atomic masses of hydrogen, carbon, nitrogen, and oxygen are 1, 12, 14, and 16, respectively.
Molecular Weight Calculation Function Code:
% Molecular Weight Calculation Function

function MW = Molecular_weight(species)

atomic_name = ['H','C','O','N','Ar'];

atomic_weight = [1.008 12.011 15.999 14007 39.948];

MW = 0;

% Adding Atomic number to obtain particular Value

for i = 1:length(species)
    for j = 1:length(atomic_name)
        if strcmp(species(i), atomic_name(j))
            MW = MW + atomic_weight(j);
            position = j;
        end
    end
    n = str2double(species);

    if n>1
        MW = MW + atomic_weight(position)*(n-1);
    end
end

fprintf('%s species %s %f\n',species,'Molecular Weight',MW)
end
The NASA polynomials have the form:
    Cp/R = a1 + a2 T + a3 T^2 + a4 T^3 + a5 T^4

    H/RT = a1 + a2 T /2 + a3 T^2 /3 + a4 T^3 /4 + a5 T^4 /5 + a6/T

    S/R  = a1 lnT + a2 T + a3 T^2 /2 + a4 T^3 /3 + a5 T^4 /4 + a7
where a1, a2, a3, a4, a5, a6, and a7 are the numerical coefficients supplied in NASA thermodynamic files. The first 7 numbers starting on the second line of each species entry (five of the second line and the first two of the third line) are the seven coefficients (a1 through a7, respectively) for the high-temperature range (above 1000 K, the upper boundary is specified on the first line of the species entry). The following seven numbers are the coefficients (a1 through a7, respectively) for the low-temperature range (below 1000 K, the lower boundary is specified on the first line of the species entry).
H in the above equation is defined as
H(T) = Delta Hf(298) + [ H(T) - H(298) ]
so that, in general, H(T) is not equal to Delta Hf(T) and one needs to have the data for the reference elements to calculate Delta Hf(T).
Main Code:
clear all
close all
clc

% Inputs
R = 8.314; % Gas Constant (J/(mol-K))

% Reading data File

% Open And Read Thermo.dat file

f1 = fopen('THERMO.dat','r');
get = fgetl(f1);

% Now Reading Temparature from this file

temp = fgetl(f1);

%splitting
s = strsplit(temp);

% Converting strings cells into numbers

globaltemplow = str2double(s{2});
globaltempmid =  str2double(s{3});
globaltemphigh = str2double(s{4});

% Temp Range


% Skipping Comment lines
for i= 1:3
    get = fgetl(f1);
end

%Reading the species

for j = 1:53
        tline = fgetl (f1);

        A = strsplit(tline, ' '); %spliting into cell

        species = (A{1});

        % Converting strings cells into numbers
        lowtemp = str2double(A{end-3});
        midtemp = str2double(A{end-1});
        hightemp = str2double(A{end-2});

        tline1 = fgetl (f1);
        %getting next line
        a = strfind(tline1, 'E');

        %Finding higher Coefficients
        a1 = tline1 (1:a(1)+3);
        a1 = str2double(a1);
        a2 = tline1(a(1)+4:a(2)+3);
        a2 = str2double(a2);
        a3 = tline1(a(2)+4:a(3)+3);
        a3 = str2double(a3);
        a4 = tline1(a(3)+4:a(4)+3);
        a4 = str2double(a4);
        a5 = tline1(a(4)+4:a(5)+3);
        a5 = str2double(a5);

        tline2 = fgetl(f1);
        b = strfind(tline2, 'E');

        a6 = tline2(1:b(1)+3);
        a6 = str2double(a6);
        a7 = tline2(b(1)+4:b(2)+3);
        a7 = str2double(a7);

        % Finding lower coefficients
        a8 = tline2(b(2)+4:b(3)+3);
        a8 = str2double(a8);
        a9 = tline2(b(3)+4:b(4)+3);
        a9 = str2double(a9);
        a10 = tline2(b(4)+4:b(5)+3);
        a10 = str2double(a10);

        tline3 = fgetl(f1);
        c = strfind(tline3, 'E');
        a11 = tline3(1:c(1)+3);
        a11 = str2double(a11);
        a12 = tline3(c(1)+4:c(2)+3);
        a12 = str2double(a12);
        a13 = tline3(c(2)+4:c(3)+3);
        a13 = str2double(a13);
        a14 = tline3(c(3)+4:c(4)+3);
        a14 = str2double(a14);

        T = linspace(lowtemp, hightemp, 1000);

        % Calculate Specific Heat
        Cp = Specific_heat(a1,a2,a3,a4,a5,a8,a9,a10,a11,a12,T,R,midtemp);

        % Entropy calculation
        S = Entropy(a1,a2,a3,a4,a5,a7,a8,a9,a10,a11,a12,a13,a14,T,R,midtemp);

        % Enthalphy Calcualation
        H = Enthalphy(a1,a2,a3,a4,a5,a6,a7,a8,a9,a10,a11,a12,a13,T,R,midtemp);

        % Plotting Cp, H & S with t
        % save in a Folder

        mkdir('D:\Mat Lab Practise',species);
        cd(species);

        % Plot1 (Cp vs T)
        figure(1)
        plot(T,Cp,'linewidth',3,'color','r');
        xlabel('Temparature (K)');
        ylabel('Specific Heat (KJ)');
        title(sprintf('Specific heat vs Temparature of %s', species));
        grid on
        saveas(figure(1),'specific Heat.jpg');

        % Plot 2 (S vs t)
        figure(2)
        plot(T,S,'linewidth',3,'color','g');
        xlabel('Temparature (K)');
        ylabel('Entropy (KJ/mol-k)');
        title(sprintf('Entropy vs Temparature range of %s',species));
        grid on
        saveas(figure(2),'Entropy.jpg');

         % Plot 3 (H vs t)
        figure(3)
        plot(T,H,'linewidth',3,'color','b');
        xlabel('Temparature (K)');
        ylabel('Enthalpy (KJ/mol-k)');
        title(sprintf('Enthalpy vs Temparature range of %s',species));
        grid on
        saveas(figure(3),'Enthalpy.jpg');

        cd('D:\Mat Lab Practise')

        % MW
        MW = Molecular_weight(species);
end
Explanation Of Coding Logic:
- Read the input data & open the Functions
- It refits thermo data to eliminate jumps in properties at midpoint temperature. Works with a list of species created by thermo_check.py or individual species specified by user. Creates a new NASA-7 fit and data structure for polynomial coefficients, writes output files in three formats (cti, NASA-7 and NASA-9).
- It reads new thermodynamic data fits generated by thermo_refit.m and batch processes replaces the data in the NASA format data file using the list generated by check-thermo.py. Currently only works for NASA-7 polynomials.
- Program to fit tabular thermodynamic data to generate NASA-7 polynomial fits and writes files in three formats. Example input file given for 2-butenal.
- Function to generate NASA-7 polynomial fits from specific heat data and reference thermodynamic state. Included in thermo_fit.m and thermo_refit.m.
- Matlab script to compute partition functions and thermodynamic properties (including coefficients for polynomial fits in Cantera cti and NASA formats) from spectroscopic data for heteronuclear diatomic molecules.
- Spectroscopic data for three diatomic molecules. Nitric oxide (NO); Hydroxyl (OH); Methylidyne (CH).
- Plot the figures.
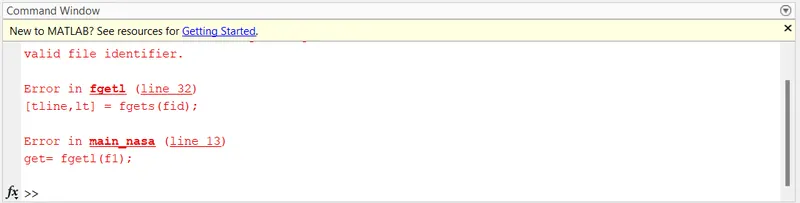
Errors:
Reducing Errors Leads To Molecular weight of all Species:
Screenshot of the window where all the folders are saved:

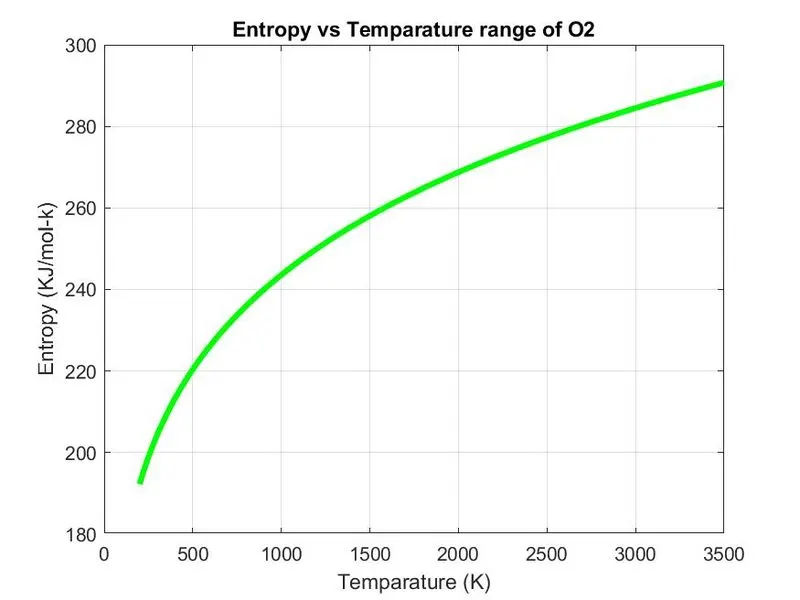
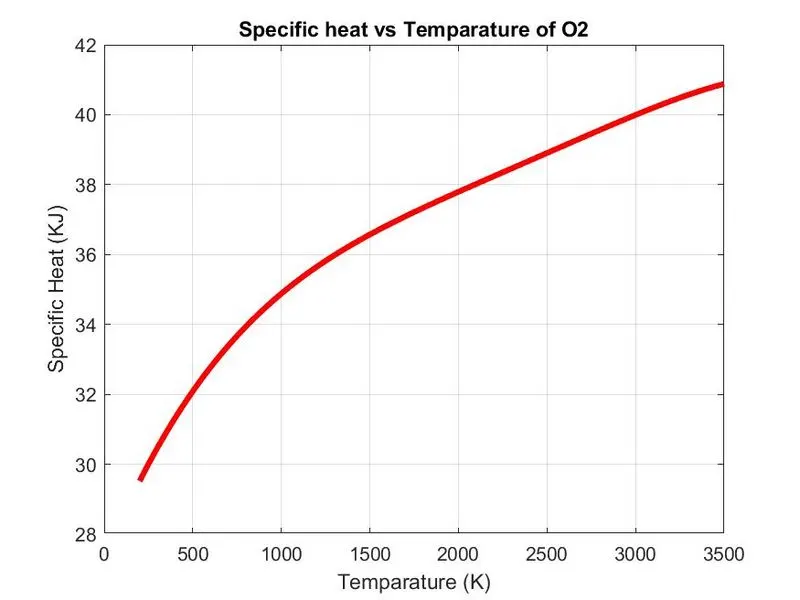
Plots of o2 :
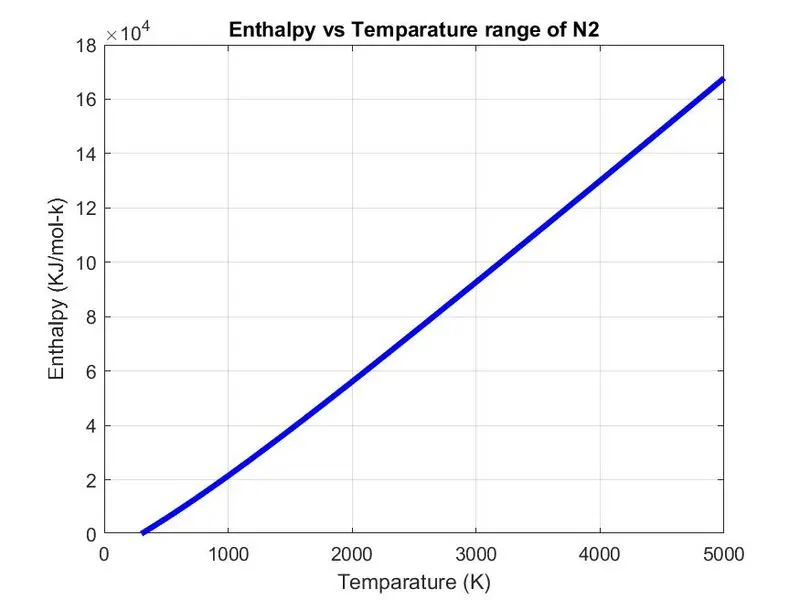
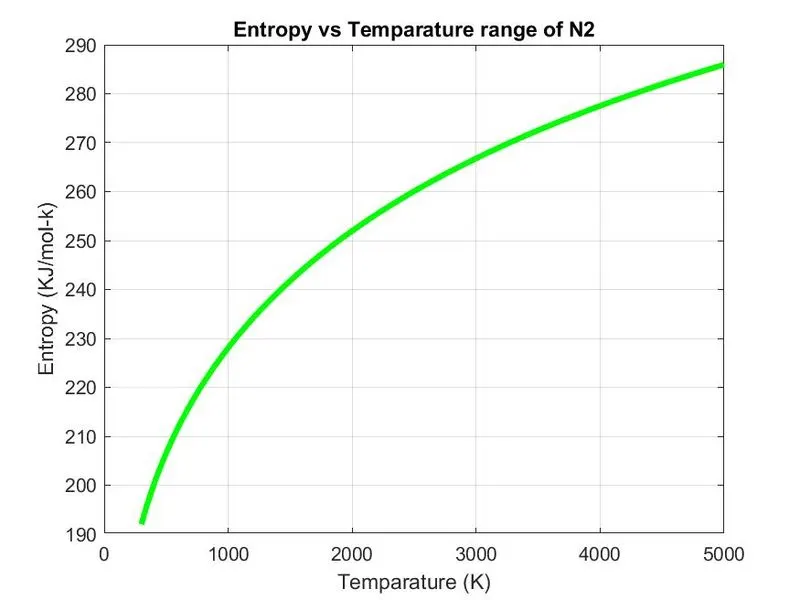
Plots of N2 :
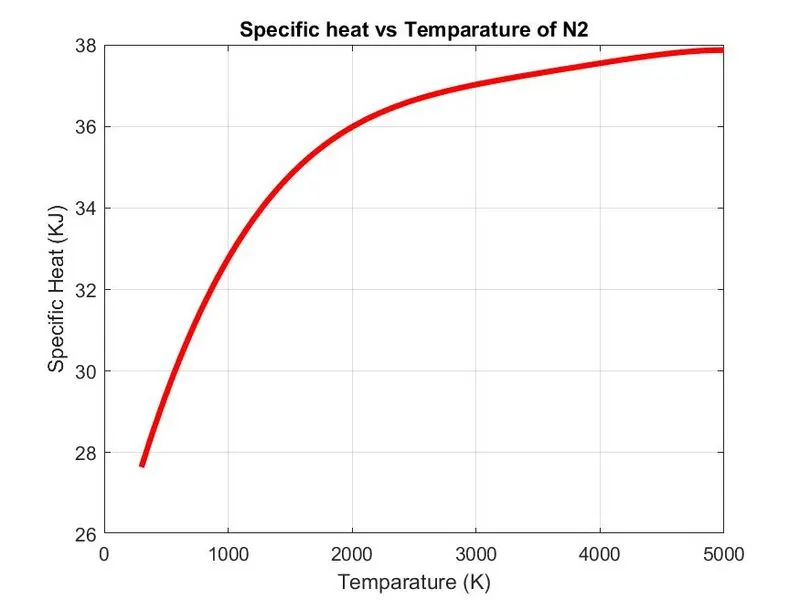
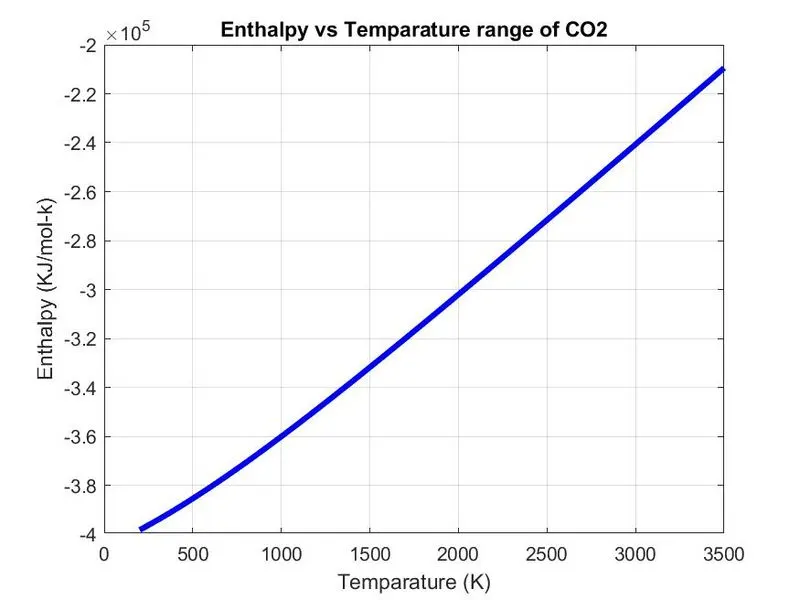
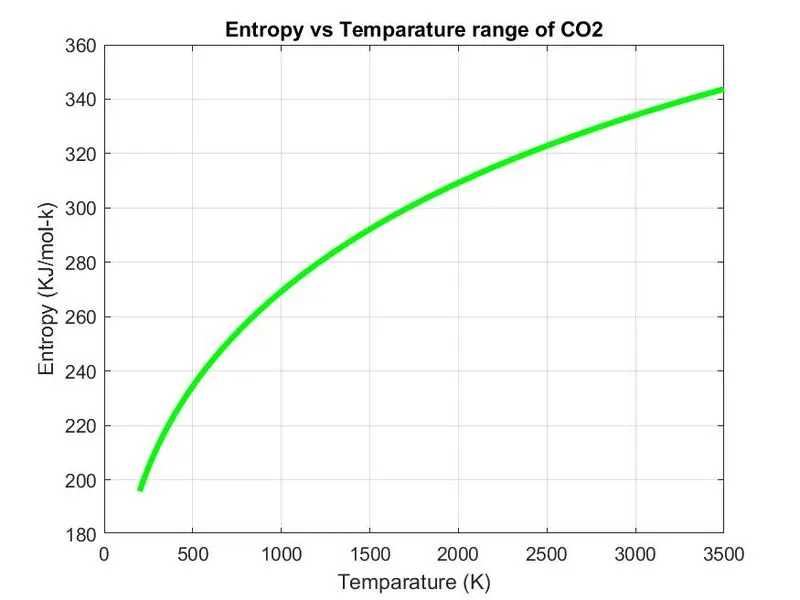
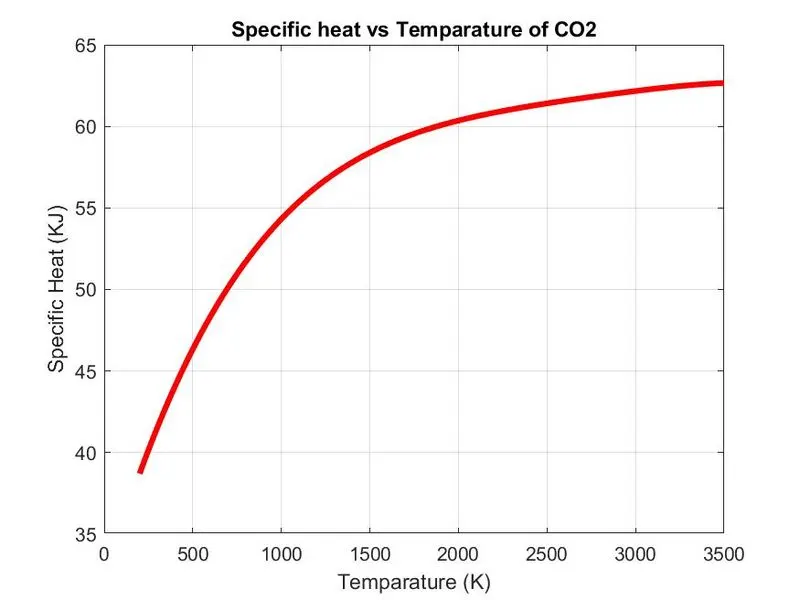
Plots of Co2:
Conclusion :
- It is an interactive tool that uses the NASA Glenn thermodynamic database to select species and to obtain
- Tables of thermodynamic properties for a user-supplied temperature schedule.
- Data subsets for use in CEA, SUBEQ, or any other computer program.