Week - 4
AIM:
1.TO IMPLEMENT CONTROL LOGIC OF A WASHING MACHINE USING STATEFLOW IN SIMULINK
2.Make a Simulink chart for the “Gear shift” logic
OBJECTIVES:
- Implement control logic of a “washing machine” using Stateflow as per given sequence:
- If the power supply is available, the system gets activated
- If the Water supply is not available, stop the process & indicate through LED
- Soaking time should be 200s followed by Washing time of 100s.
- Then rinsing happens for next 20s & dryer runs for 50s
- After all the processes have completed turn on the finished LED
2. Make a Simulink chart for the “Gear shift” logic as per below conditions:
Speed Range(kmph) Gear
0 to 15 1
16 to 25 2
26 to 40 3
41 to 60 4
Above 61 5
Give speed input while the simulation is running & display the gear number.
TASK 1:
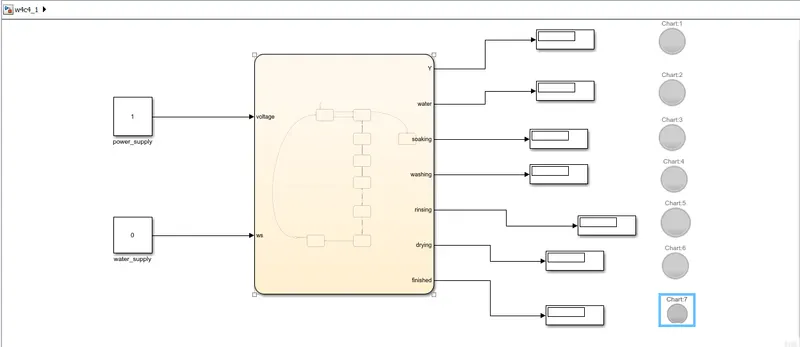
MODEL:
PARAMETERS:
- VALUE OF 1 MEANS THERE IS INPUT
- VALUE OF 0 MEANS THERE IS NO INPUT
- WHEN THE LAMP SHOWS GREEN THE TASK IS IN PROGRESS
- WHEN THE LAMP IS IN RED THE TASK IS ENDED
CHART DIAGRAM:
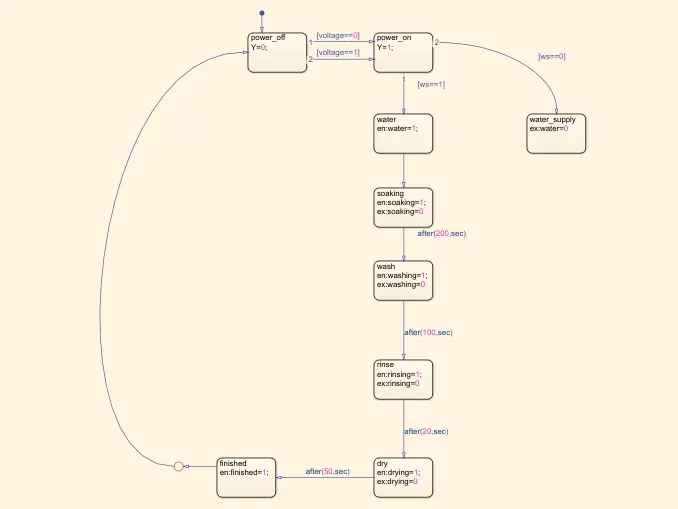
- EN- MEANS ENTRY
- EX-MEANS EXIT
MORE PARAMETERS:
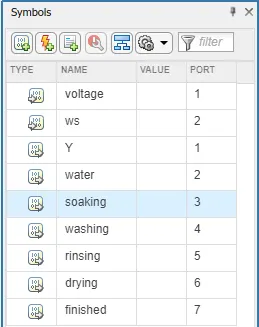
EXPLAINING PARAMETERS
WATER,WASHING,SOAKING,RINSING,DRYING,Y ARE GIVEN AS OUTPUT
VOLTAGE AND WS ARE THE INPUTS
NOTE: THE TIME TAKEN FOR THE MODEL TO BE SOLVED IS TAKEN AS 500 SECS
OUTPUT:
THERE ARE 2 CONDITIONS FOR THIS TASK
1.WHEN THE WATER SUPPLY IS OFF
2.WHEN THE WATER SUPPLY IS ON
1.WHEN THE WATER SUPPLY IS OFF
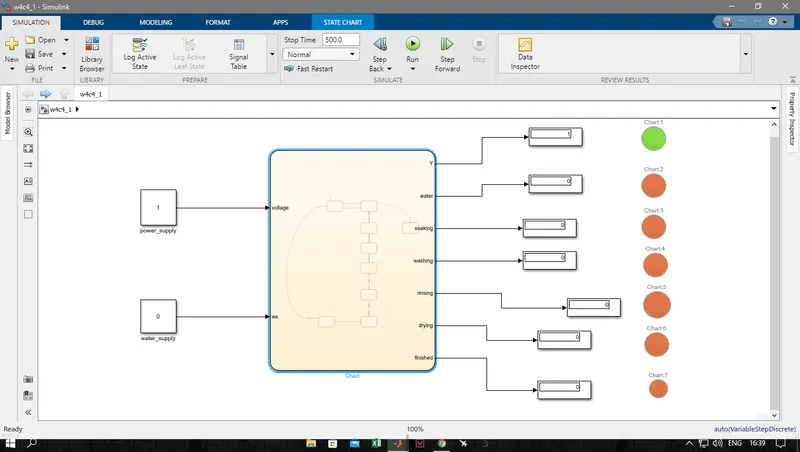
as we can see from the above figure that the finished lamp is indicating red means the operation was succesful.
2.WHEN THE WATER SUPPLY IS ON
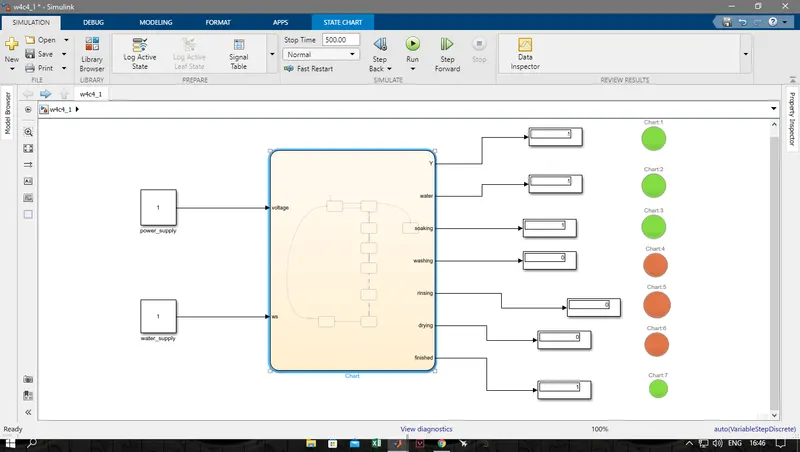
as we can see from the above figure that the finished lamp is indicating green means the operation was succesful.
conclusion:
the simulation of the washing machine using Stateflow is completed
the link to the file is given below
https://drive.google.com/file/d/11eCaeXDuhN72aQKbsuPWjL2yi6V3HSgo/view?usp=sharing
TASK2:
MODEL:
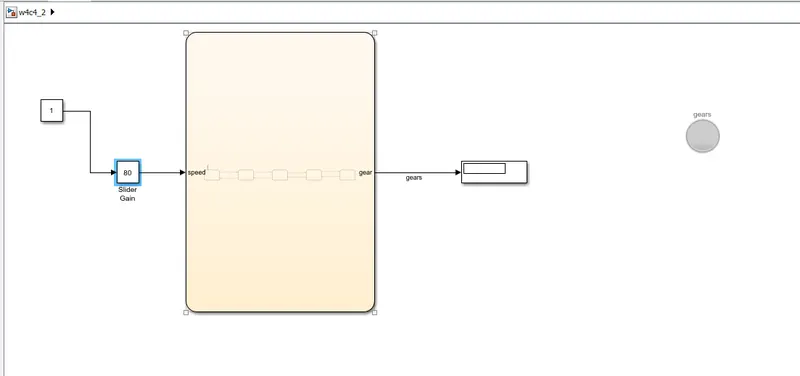
CHART DIAGRAM:
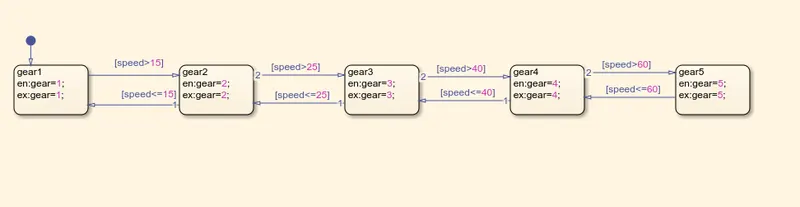
PARAMETERS:
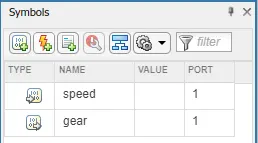
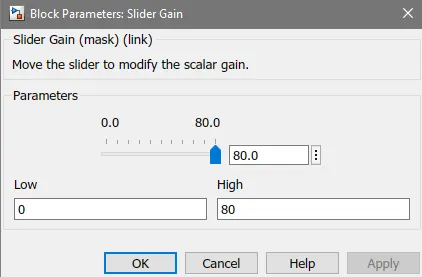
HERE WE HAVE GIVEN SPEED AS THE INPUT FOR THE CHART
AND WE HAVE GIVEN GEAR AS THE OUTPUT FOR THE CHART
INPUT:
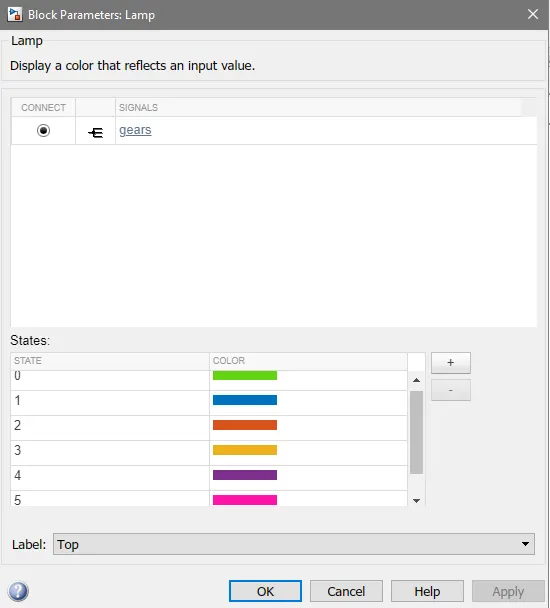
COLOURS FOR DIFFERENT GEAR STATES:
HERE WE CAN SEE THAT FOR
0-15 SPEED THE COLOR IS BLUE
15-25 SPEED THE COLOR IS RED
25-40 SPEED THE COLOR IS YELLOW
40-60 SPEED THE COLOR IS VIOLET
MORE THAN 60 SPEED THE COLOR IS PINK
NOTE:HERE WE HAVE TAKEN THE TIME AS INFINITE FOR THE SIMULATION SO THAT WE CAN GET DIFFERENT OUTCOMES AS WE VARRY THE SPEED.
OUTPUTS:
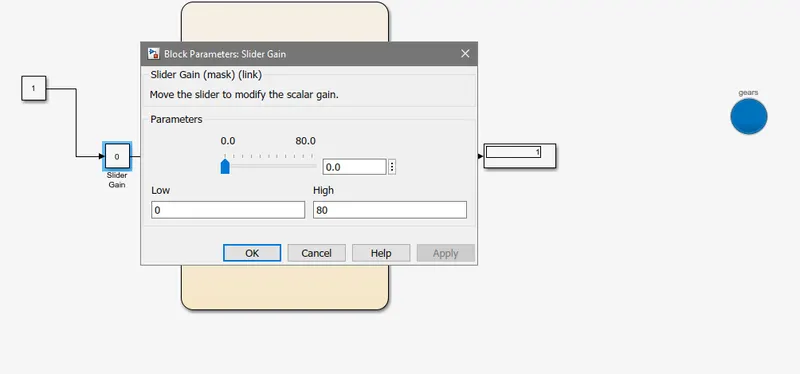
RESULT 1:
FOR SPEED 0-15
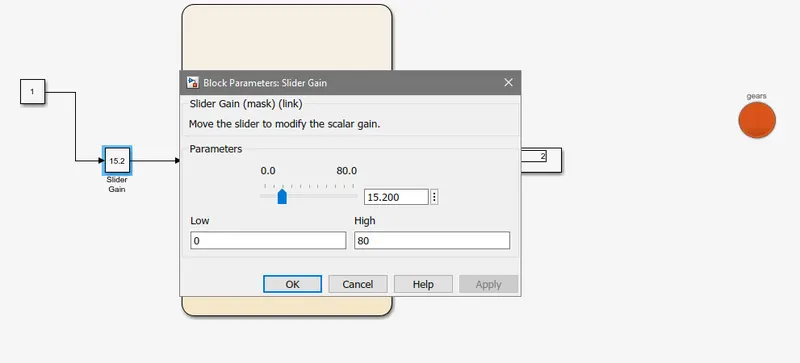
RESULT 2:
FOR SPEED 15-25
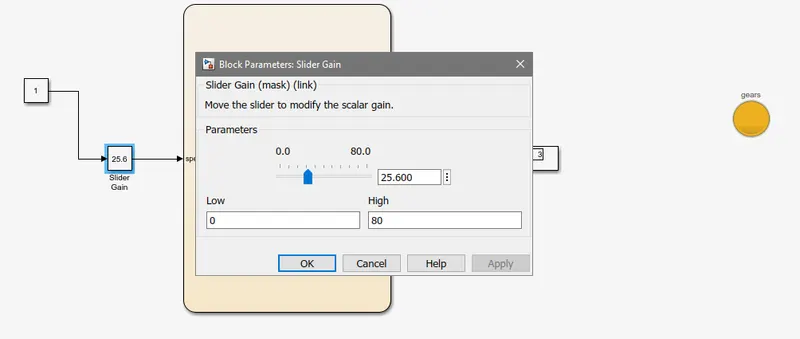
RESULT 3:
FOR SPEED 25-40
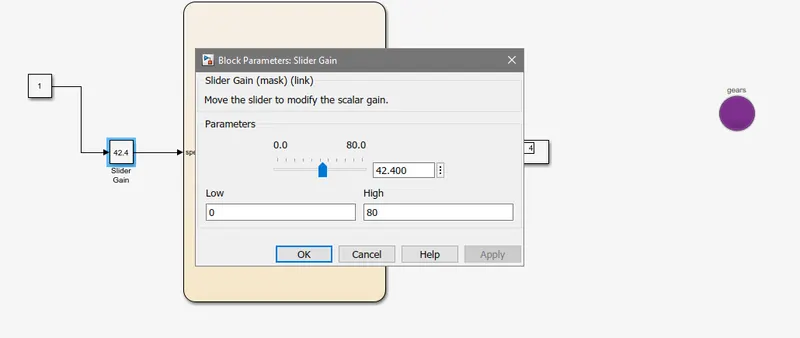
RESULT 4:
FOR SPEED 40-60
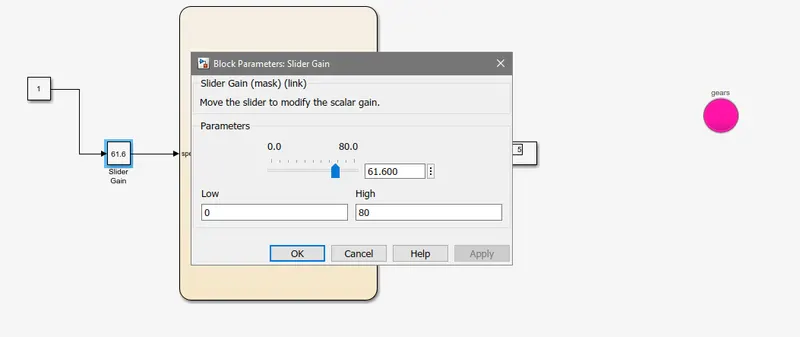
RESULT 5:
FOR SPEED MORE THAN 60
CONCLUSION:
CREATED THE STATEFLOW FOR GEAR SHIFT USING SIMULINK AND THE RESULTS ARE DISPLAYED ABOVED WITH PROPER EXPLAINATIONS
LINK TO THE MODEL FILE IS GIVEN BELOW:
https://drive.google.com/file/d/15GUxWPwA_-cO6_L5cfW75hg234-kbaXK/view?usp=sharing