Week - 4
CONTROL LOGIC OF WASHING MACHINE USING STATEFLOW
During a normal working process of washing machine, it undergoes through many different stages like soaking, rinsing, drying etc. Inorder to define a stateflow to the problem, we need to meet the following ojectives.
- Give in adequate power supply as well as water supply, with LED indicators for both the inputs with system running only when there is adequate water supply into the system. LED indicators indicate the status of both the processes.
- Adequate time devoted for completion of various processes such as soaking which takes about 200s, washing about 100s, rinsing about 20s and drying that takes about 50 s.
- A LED indicator to denote, the completion of processes involved.
Hence after considering the various conditions and criteria, the following state flow chart is prepared.
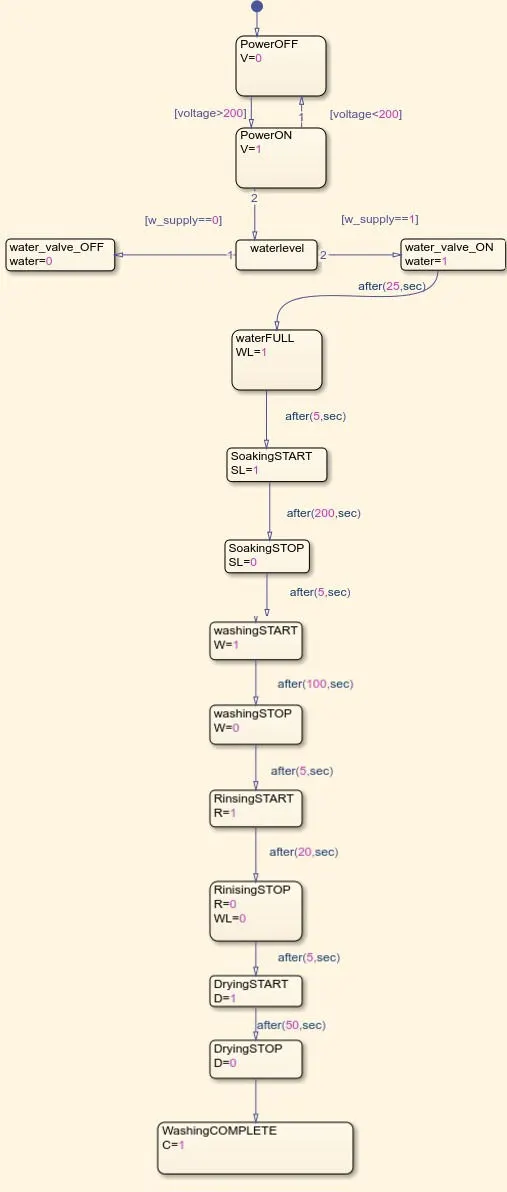
Here the flow chart is designed in such a way that:
- The flowchart will execute only when the voltage value is above 200 V, anything below 200v, the mchine stops operating. 'V' variable is used to denote the criteria
- The next criteria is to turn on the inlet valve, which will be at ON only if both power supply and water supply is provided. If only power supply or water supply is given, the lamp turn red. It turns green only when both the power and water supply is provided
- Once the valve is ON, a 25 s delay is given for reaching the required water level in the machine. The LED turns red once the required water level is reached.
- After filling up water, the soaking process starts after a 5s delay. The soaking process goes on for another 200s. The LED turns green, once the soaking process is executed and finally turns red once finished
- After another 5s delay, washing process, starts which lasts for 100s. The LED turns to red from green, once washing is done for 100s.
- After soaking and washing, the process left are rinsing and drying which take place for 20s and 50s respectively. LED indicators are provided to show the status of the process just like the above ones.
- Once, drying is completed, the washing is completed, and is indicated using a washing complete LED that turns green.
The process flowchart can be explained better with a sequential viewer:
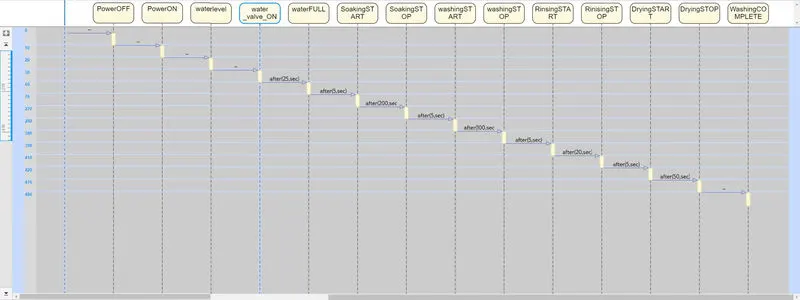
The sequential viewer gives a clear idea on which process take place during the given time sequence and when they will stop.
The simulink block for the system can be given as:
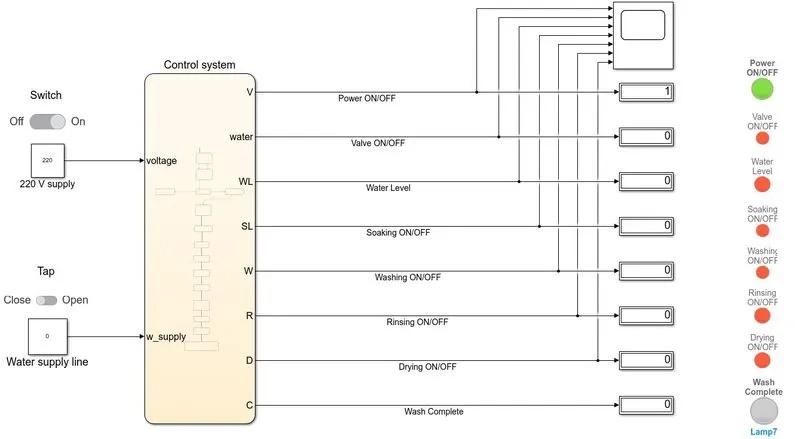
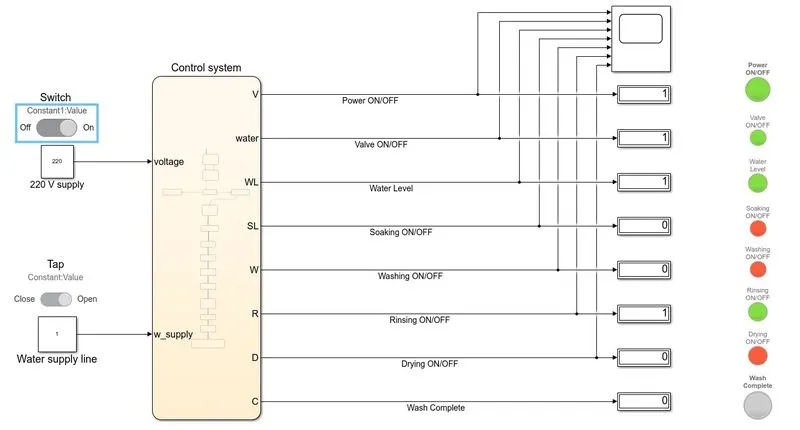
The given simulink diagram represent a condition, when the power is ON but the water supply is closed, hence even though the power is ON indicated by green light, the valve for water supply is in OFF position indicated using red light.
Once the tap is open, the power is on and the system is simulated for 200s, the system shows the following result
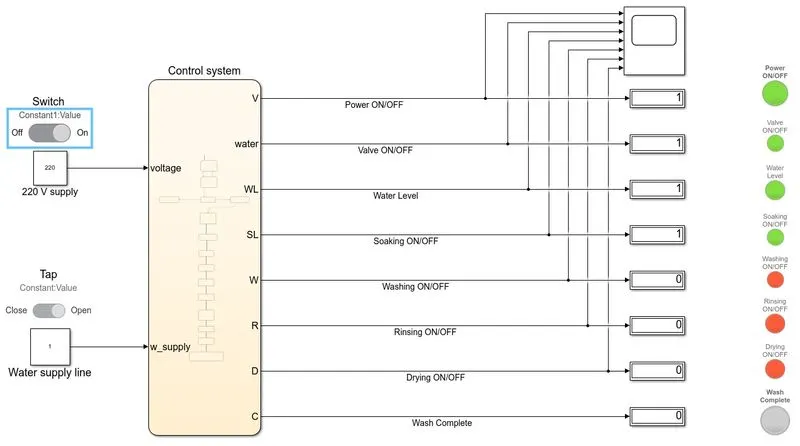
So, by 200s, the system has powered oN, valve is open, the required water level is reached and is currently in soaking mode. The result obtained in scope, can give a timing diagram of the various process involved during this time.
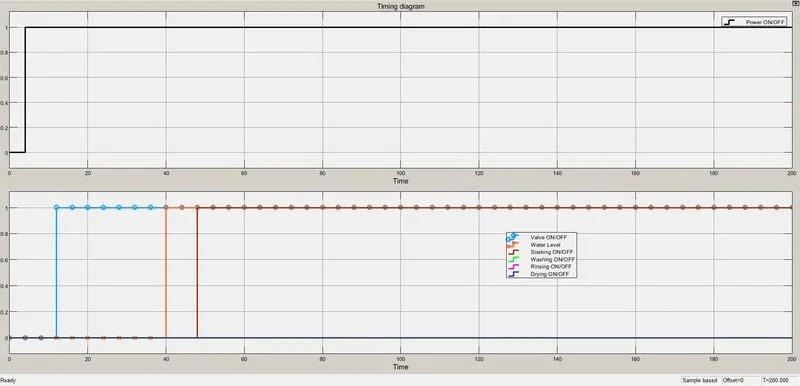
The timing diagram for t=200s, clearly tells which all process have been elapsed or still in ON condition, while the simulation is run.
Consider another simulation, that is run for time 400s, the results obtained is as:
the timing diagram, can be given as:
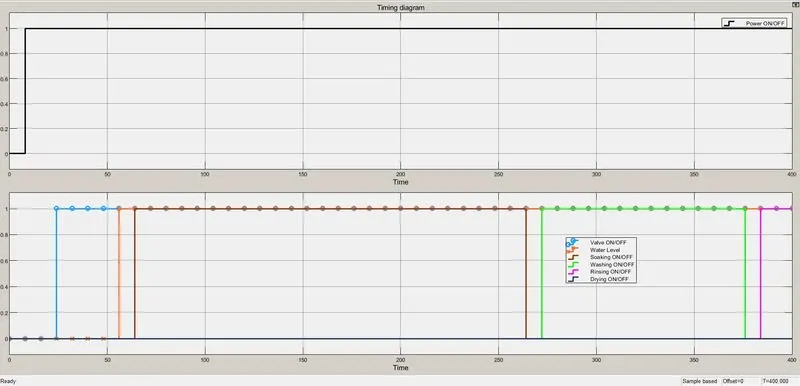
The timing diagram, clearly tells that the valve and water level indicators are still ON, whereas the soaking and washing processes have been already completed, and the rinsing process has just begun when simulated for 400s.
When the system is imulated for 500s, the results obtained are as follows:
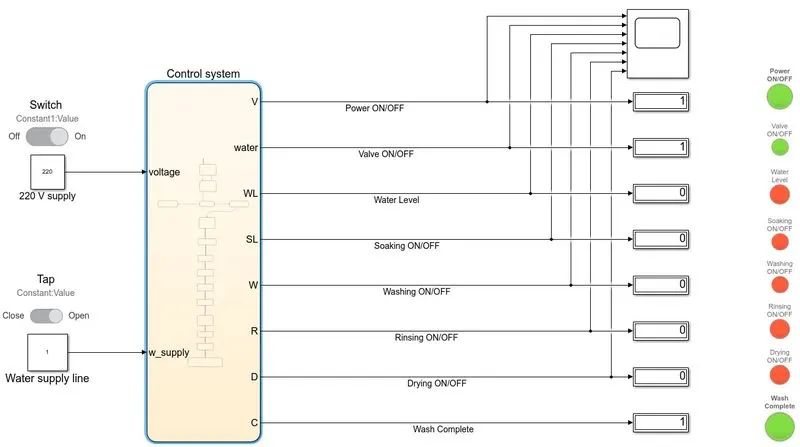
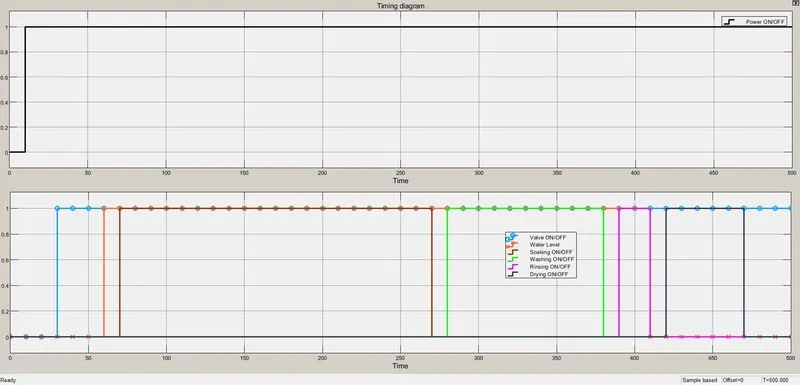
Here it is clear that the drying process, which is the last stage in washing is already completed, and hence the wash complete indicator has turned green to show, the processes are complete and finished. It is clear from the timing diagram that soaking and washing span for 200 and 100s respectively, whereas rinsing and drying span for a time of 20 and 50s respectively.
The conditions for changing light colour in various process can be seen from the following figures, given below are the lamp conditions during a drying process and indicator for wash complete.
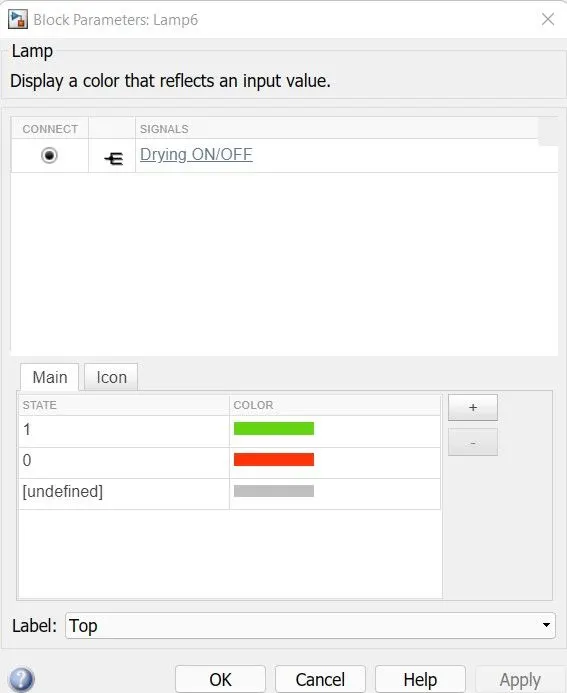
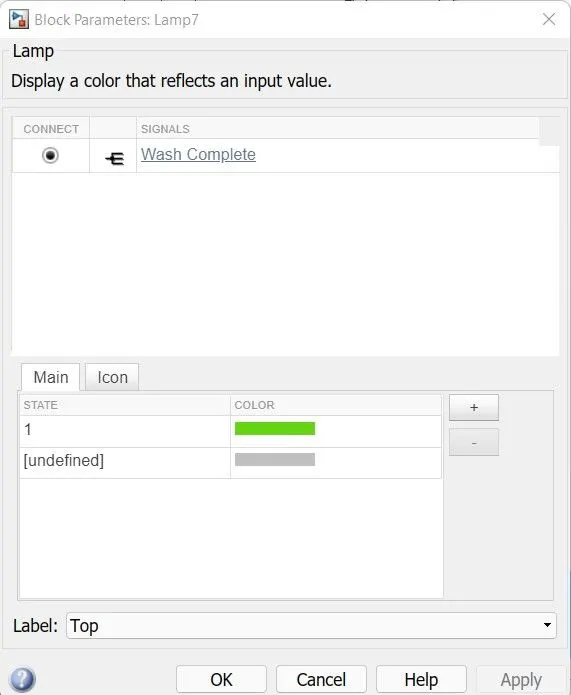
The lamp conditions are modelled in similar way for other process as well.
Hence a washing machine meeting the different critera has been successfully simulated.
the simulink model for the file is:
https://drive.google.com/file/d/15Sawy2naObjMNkymS5u0NPV9WZhvWOOt/view?usp=sharing
GEARSHIFT LOGIC SIMULINK CHART
The gearbox provided in automobiles, help to regulate the output torque inaccordance with the different engine speeds. Normally, engine gears are set in increasing manner to match the increassing engine speed during throttling. Hence inorder to obtain a continoues and smooth power at the output, gear transmission is an important area in automobiles.
Here for the given qn, the design criteria to be met is
| Speed(in kmph) | Gear |
| 0 to 15 | 1 |
| 16 to 25 | 2 |
| 26 to 40 | 3 |
| 41 to 60 | 4 |
| Above 61 | 5 |
As well meeting above criteria, certain more additions are added to the system
- An engine ON/OFF condition , so that gear shift happens only when the engine is in ON condition
- An engine idling condition, i.e when the engine output speed is zero, but the engine is in ON state
The gear chart thus can be given as below:
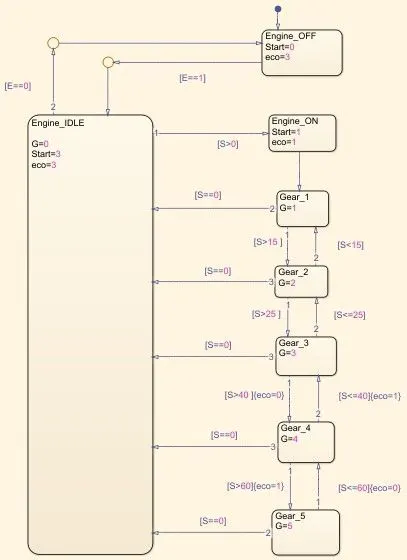
- Here variables 'E' and 'Start' are associated with engine ON/OFF condition.
- Variable 'S' is the speed parameter, according to which the gears must be selected
- Variable 'G' stores the value of which gear to engage for a particular speed range
- variable 'eco' denotes the eco mode detection, when it runs at speed range corresponding to gear 4
Hence taking into conditions given in the table and the variables, the state chart is modelled
- here the E value of 0 or 1 dictates, whether engine is in ON or OFf state, the Start variable gives 1 for all ON conditions and 0 for all OFF conditions.
- By applying the parameter using varable 'S' acoording to the question, the suitable gear is selected
- Once the Speed drops to zer or S==0, the engine goes into an idle mode, from which the engine can be turned OFF or can continue working. This situation can simulate a condition, when engine comes to rest and turned off or at condition, where engine is idle at traffic, where speed is zero.
The entire system hence can be modelled as follows:
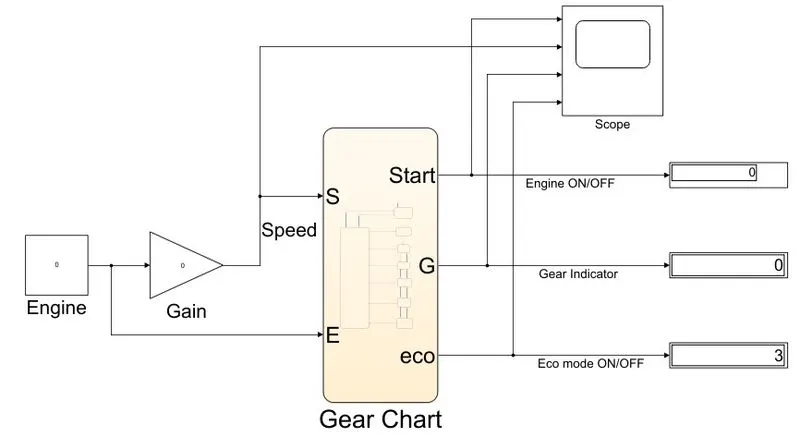
Here the gain block is connected to a slider block having a minimum value of zero and maximum value of 120,hence providing value to get multiplied and displayed as the speed input into the system.
An engine (constant) block is connected to a switch, which either gives 0 or 1. Hence at OFF condition or at 0, the throttling can produce no effect unless the engine is turned ON
Inorder to display the gearshift, a dashboard is provided with a slider and engine ON/OFF switch, to simulate the system. The dashboard can be given as:
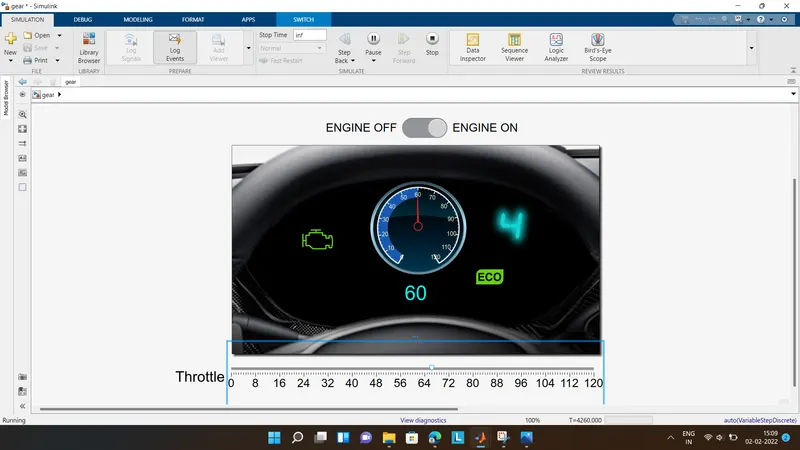
- The engine ON/OFF switch, turns the engine on or off. The engine symbol gives green colour when ON and red when OFF and blue when its in idle condition
- A circular gauge gives the speed value obtained by sliding through, the slider, and the value is displayed just below the speedometer.
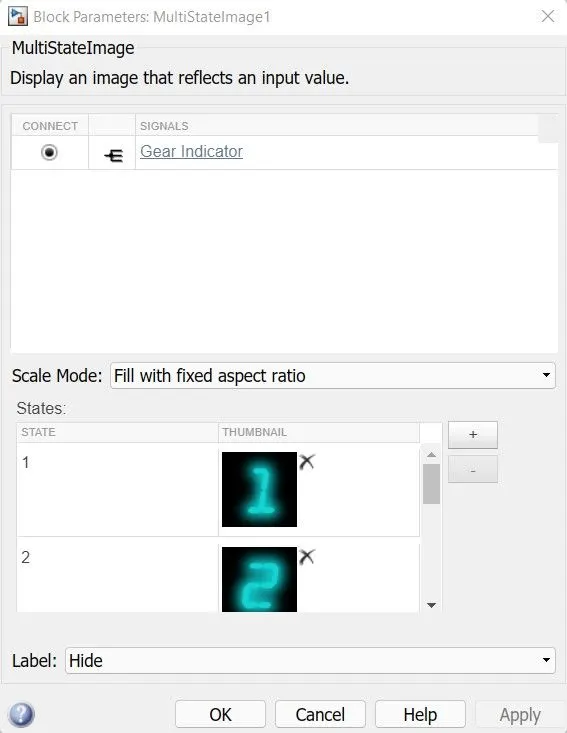
- The gear indicator is placed adjacent to speedometer and above the eco mode indicator
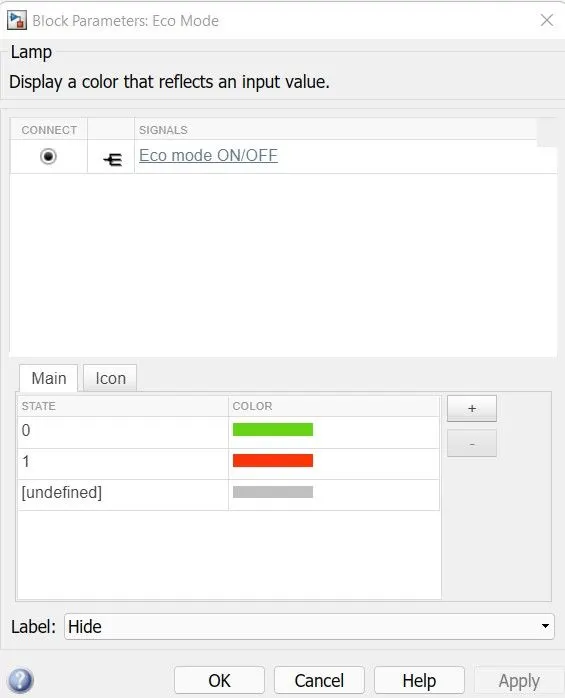
- An eco mode that turns green when it runs during the gear 4 condition.
Various engine, slider positions and its dashboard output obtained are:
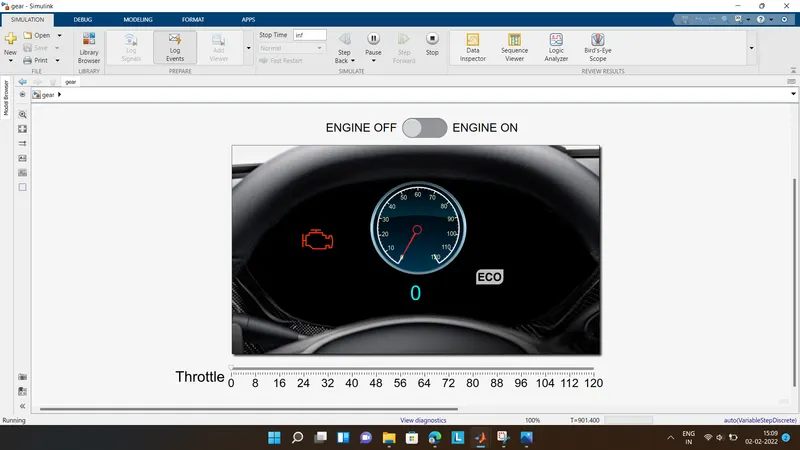
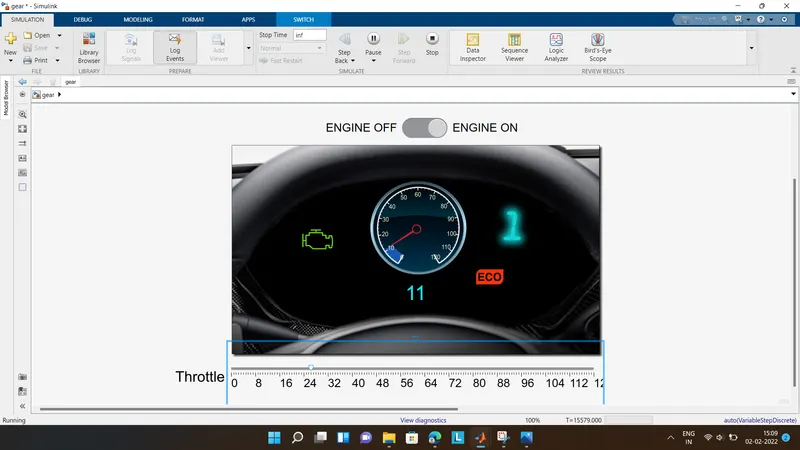
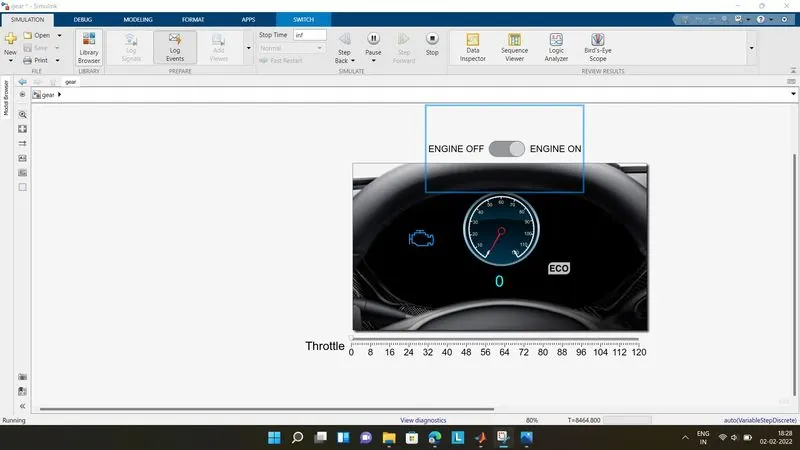
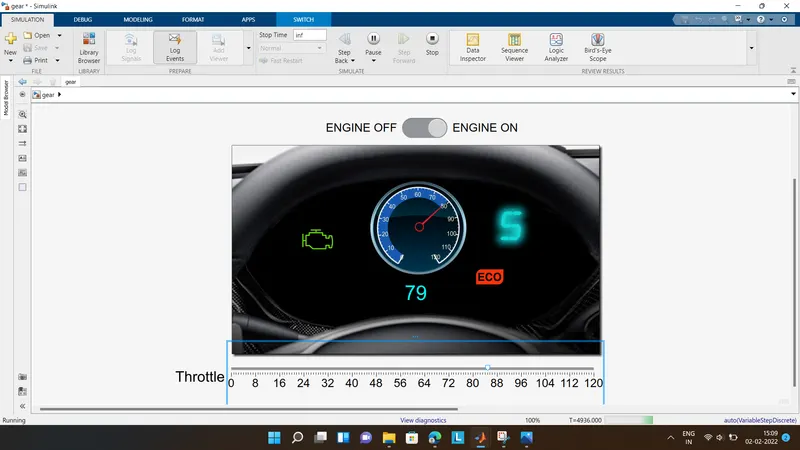
The given figures gives idea on dashboard responses.
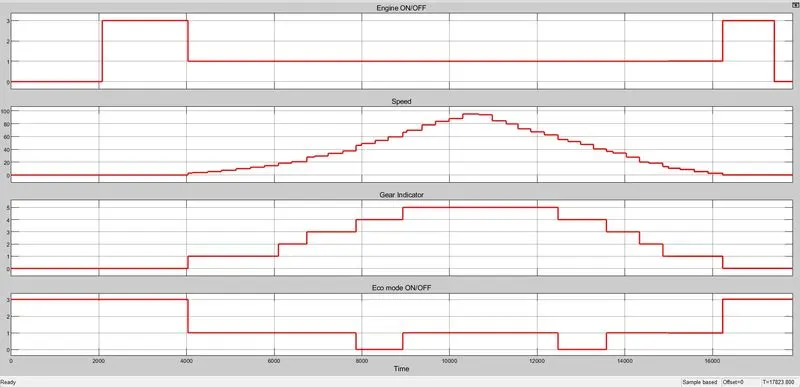
From the scope the parameters and conditions can be examined
- Engine ON/OFF graph gave 0 during OFF, 3 during IDLE and 1 for ON condition
- the slider gave varying speed values only when the engine was at ON conditions, else it gave 0
- the gear values shifted accordingly to the speed variation and was 0 at OFF and IDLE condition
- eco mode gave 0 on gear 4, whereas it gave 1 on all other gear conditions, it gave 3 for IDLE and OFF condition.
The various indiator conditions and signal input for indicators can be given as:
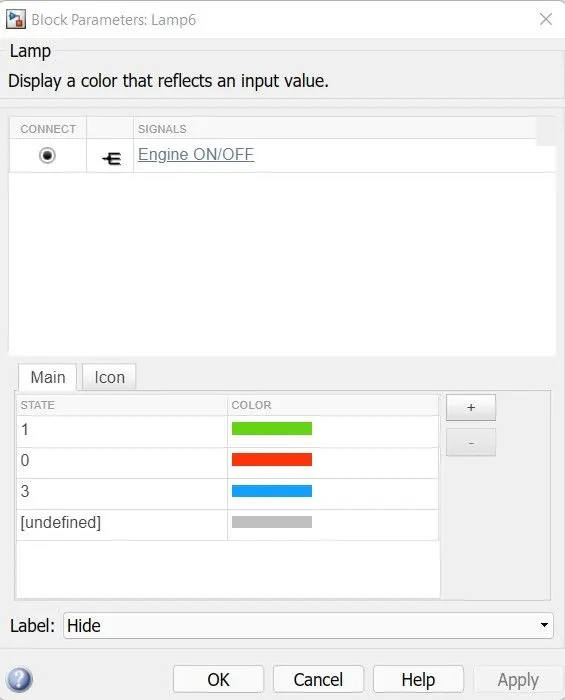
Hence the gearshift logic has been successfully demonstrated.
the simulink model for the problem is:
https://drive.google.com/file/d/19qcjfSUjbuvwQy6UFhQVgvi-FDPearaM/view?usp=sharing
REFERENCE