Week - 4
Aim:
To implement control logic of a washing machine using Stateflow as per given sequence
Sequence given:
- If the power supply is available, the system gets activated
- If the Water supply is not available, stop the process & indicate through LED
- Soaking time should be 200s followed by Washing time of 100s.
- Then rinsing happens for next 20s & dryer runs for 50s.
Simulink Model:
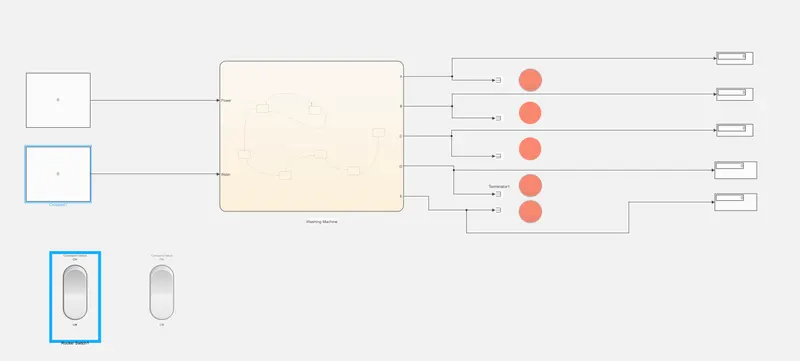
State flow chart:
The blocks used:
- Constant
- Terminator
- Lamp
- Rocker Switch
- Display
Explanation:
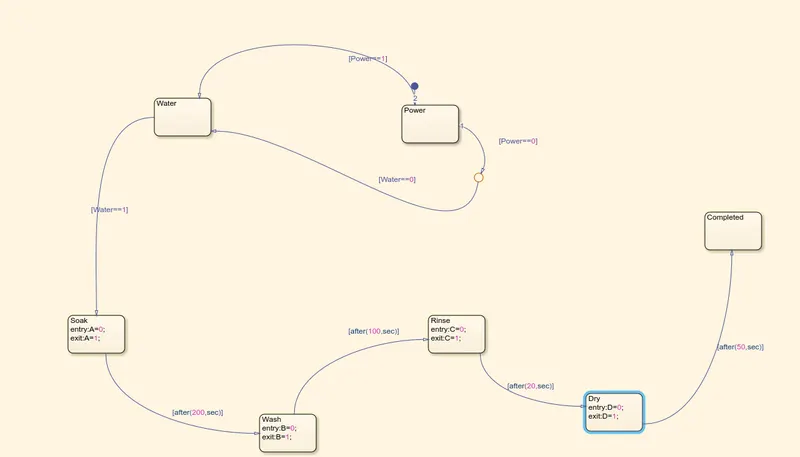
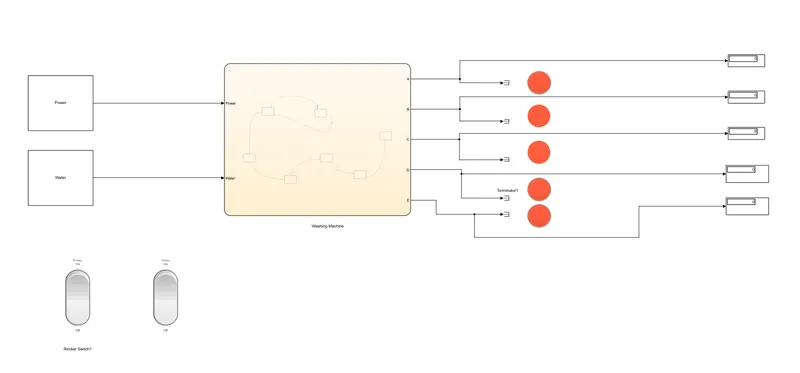
We need to create a washing maching with power,water,soak,rinse and dry respectivelu according to the sequence.At first we need to create an stateflow chart we use the power and water to loop at the first and then we use the flow as following soak rinse and dry.
The soak rinse and dry are given with A=1 and A=0 as inputs or conditions and respectively for others as B,C,D as 1 and 0 respectively we need a break so as the given sequence we use the after command and use the break as 200 100 20 and 50 seconds respectively the inputs are power and water of values 0 and 1.Where 1 is for on and 0 for off respectively.
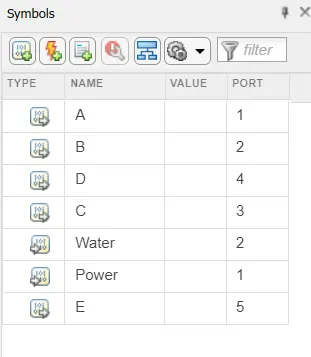
We need to assign the values as input data or output date so we go to the symbol panel to give the command according as inputs and outputs respectively.
The symbol panel:
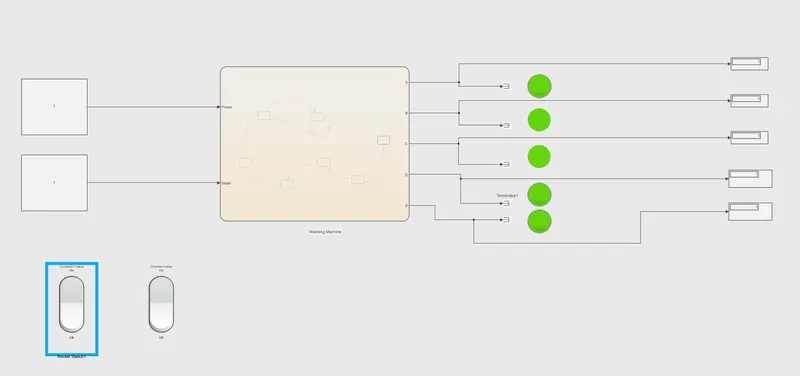
We come to the home page of the model and connect the inputs and the outputs for the state floe with the Constant and terminator we use the terminator to connect the lamp and the switch with the respective block.
Conditions:
1)Power off and Water off
2)Power on and water off
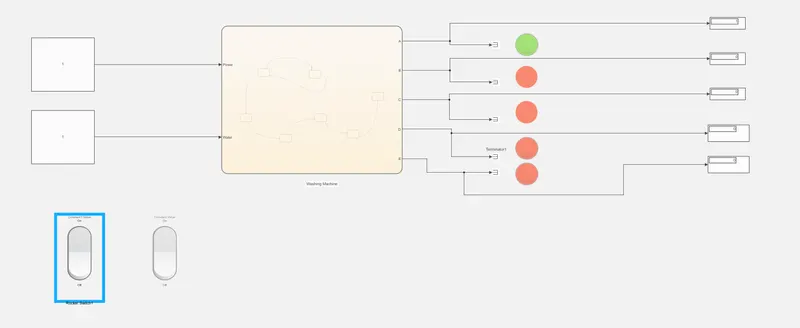
In thr above image the values are changed as 1 for power and 0 for water which is on and off respectively.
3)Power on and water on
The gear shift
Aim:
To make a simulink chart for the Gear shift logic as per the given conditions.
The given conditions:
- Speed Range(kmph) Gear
- 0 to 15 1
- 16 to 25 2
- 26 to 40 3
- 41 to 60 4
- Above 61 5
The components used:
- Chart
- Terminator
- Slider switch
- Slider
- Constants
- Display
- Scope
- Gauge
Simulink Model:
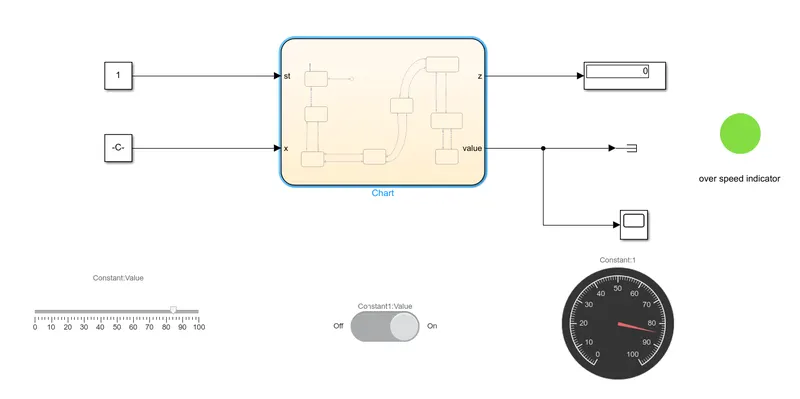
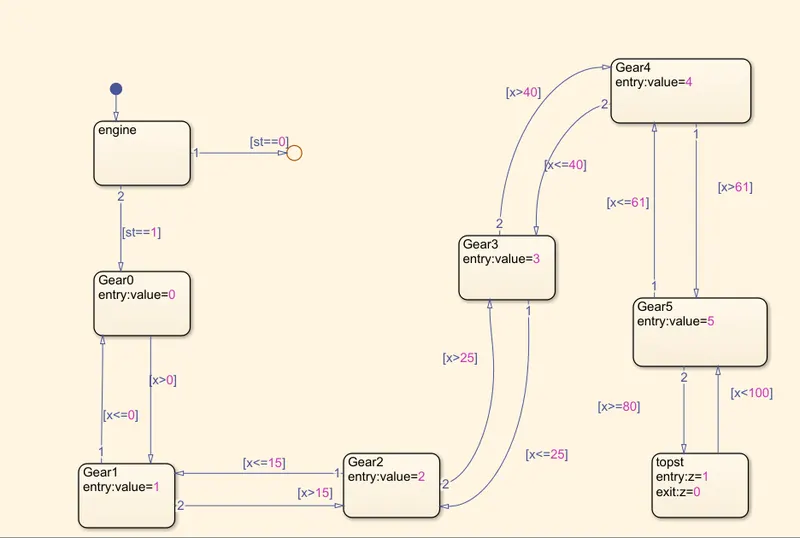
Chart:
 EXplanation:
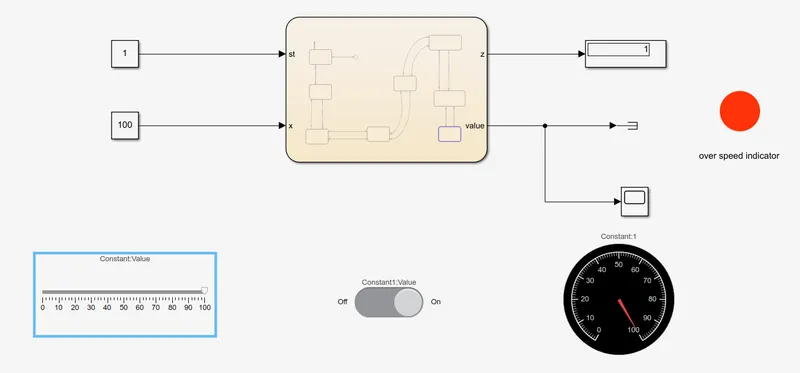
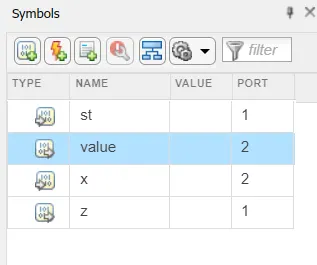
The flow chart explains the conditions of the gear according to the speed given in the sequence.the st and x are the inputs and z and value are output given in the symbol panel.
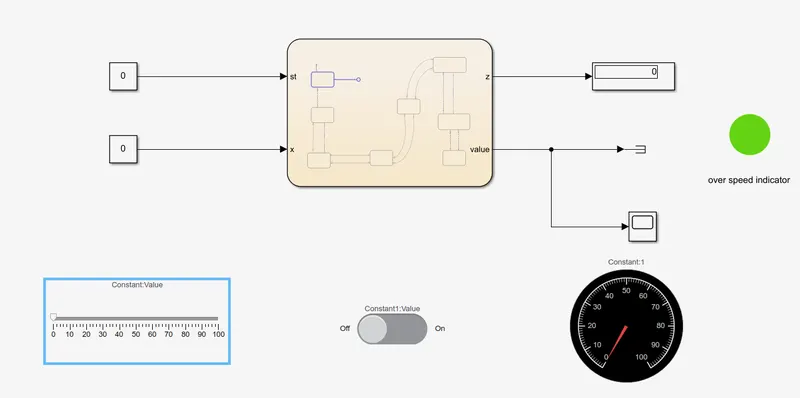
The slider is connected to the constant as the value in slider changes the input values changes similarly to acceleration.This input goes to the state flow according to the speed the gear is been changed.The another constant is connected to slider switch to show the switch is on or off adn also the terminator to connected to speedometer so that the speed is been noted and the lamp is connecyted to z output to indicate the overspeed if the speed is above 80 the lamp turns red.
Results:
When the engine is off
2) When the speed is 15kmph
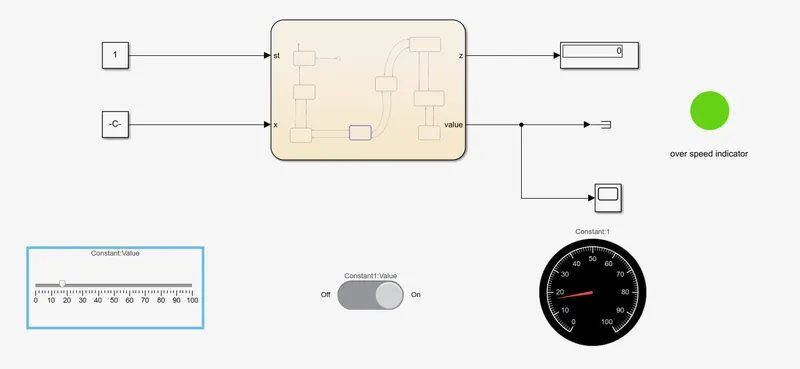
The above image the speed is 15 and the overspeed is in green color.
3)When speed is 16 to 25
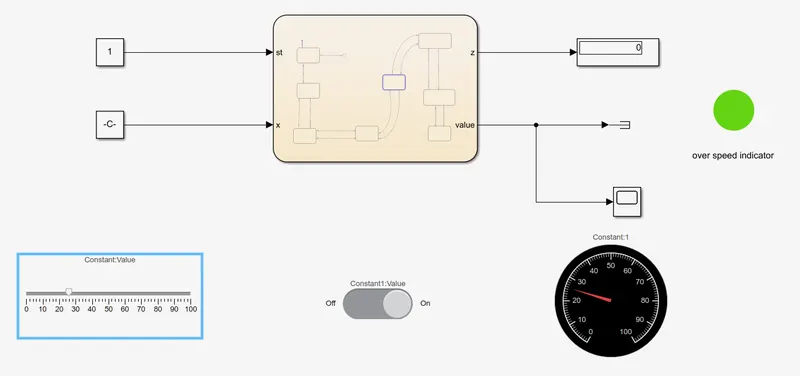
4)When speed around 26 to 40
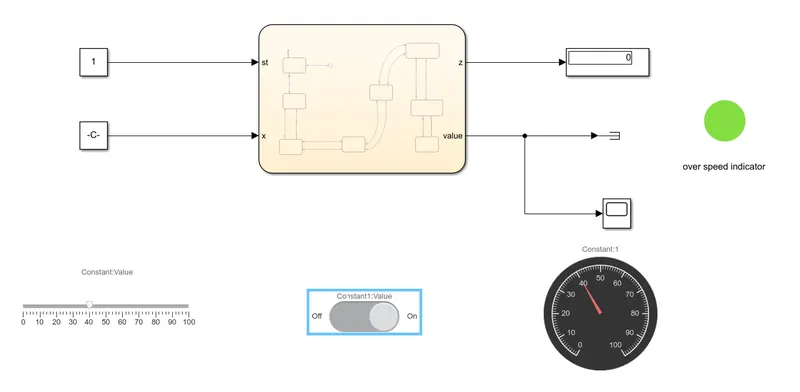
5)When speed is 41 to 60
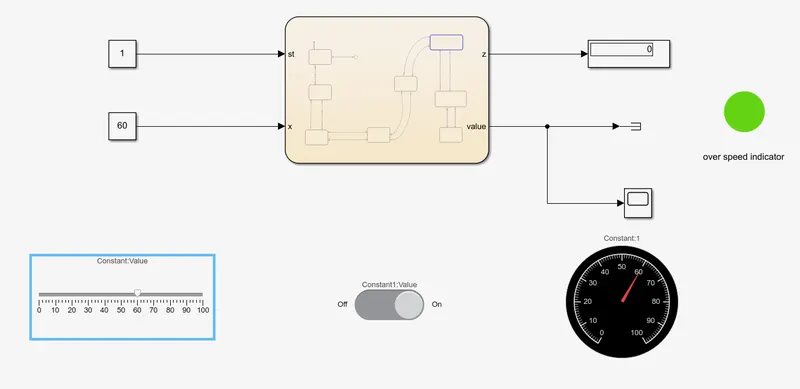
6) When speed is above 60
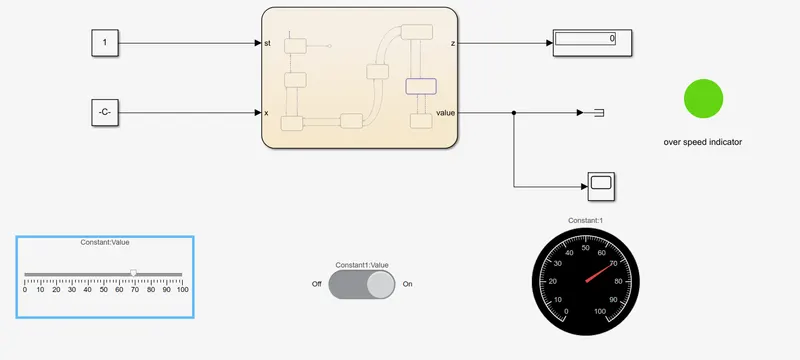
7)When over speed the light turns red