Week - 4
Stateflow is a feature of converting logic into systematic arrangement in the form of transition diagrams and flowcharts.
1. To implement the control logic of a 'Washing machine' using Stateflow we have the following given information:
a. System activates when Power Supply ON.
b. If Water Supply OFF, system stops, LED indicator red.
c. Soaking time 200s.
d. Washing time 100s.
e. Rinsing time 20s.
f. Drying time 50s.
g. Finishing LED turns ON after completion of all processes.
Procedure:
a. We first put the 'Chart' block on the modelling page because that is where our stateflow logic will be made.
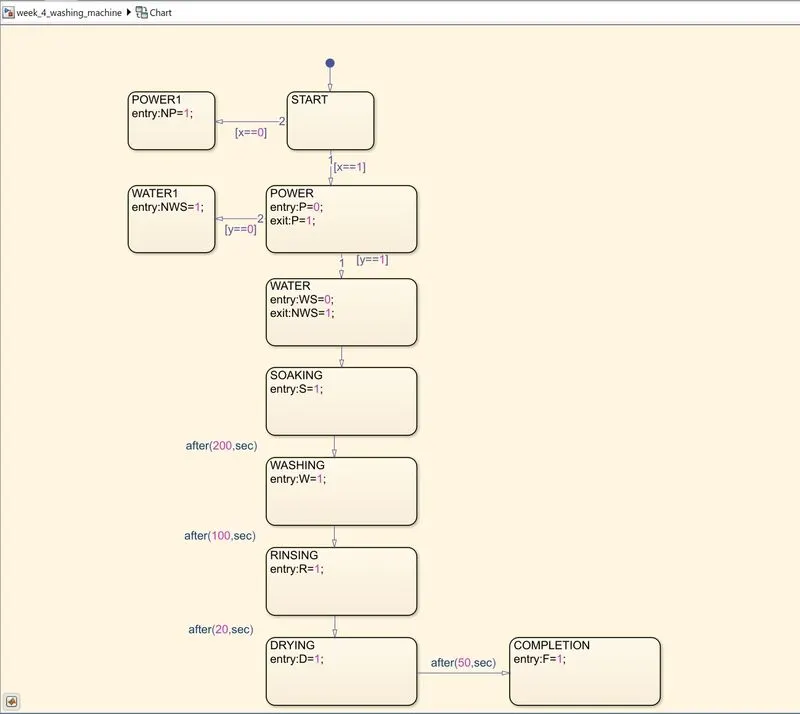
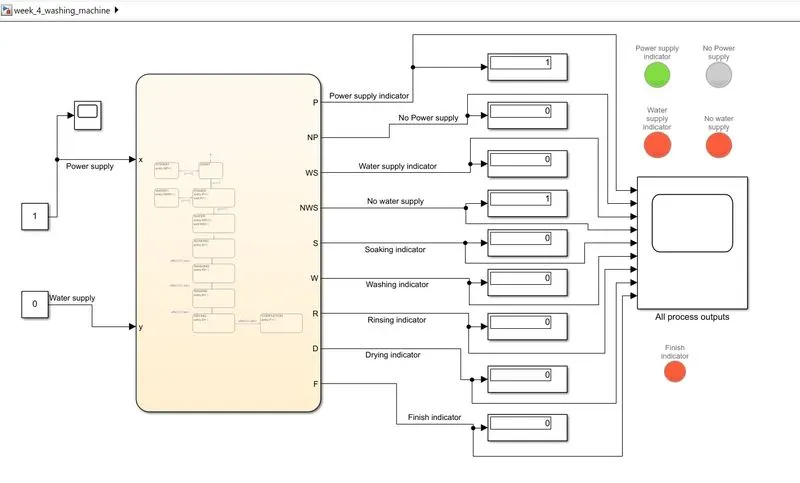
b. Inside the 'Chart' block we will insert 'State' blocks for every state. That includes: Start, Power supply availability, Water supply availability, Soaking, Washing, Drying, Rinsing and Finishing.
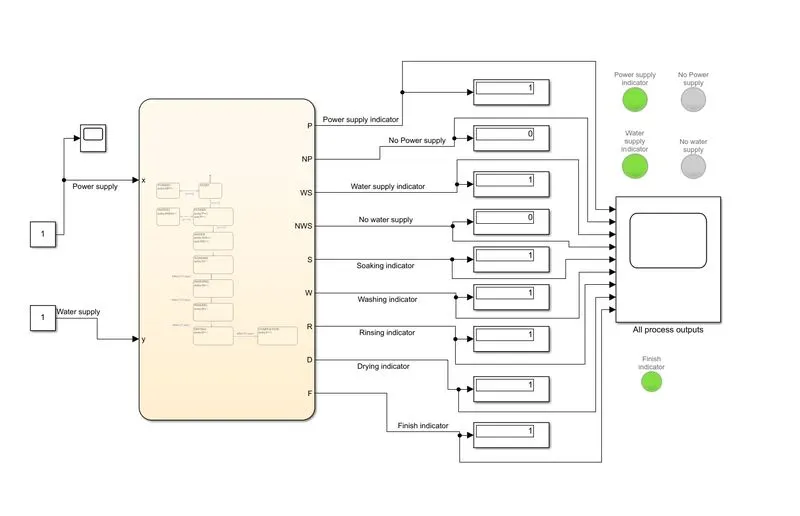
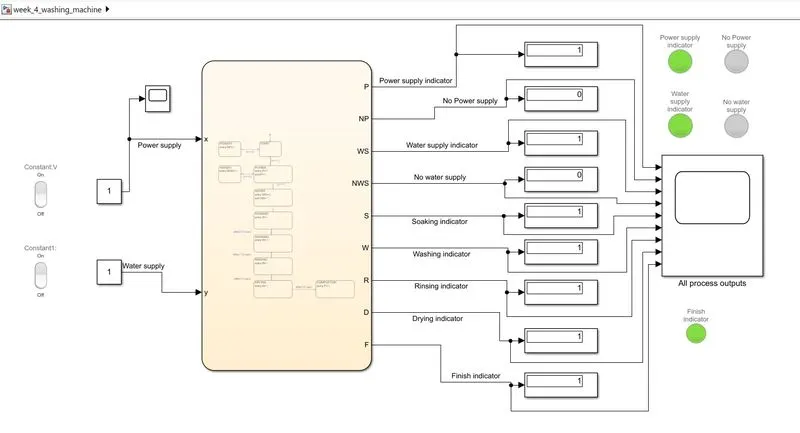
c. We will have two inputs: x and y. x indicates power supply and y indicates water supply. Power supply availability will be represented by 1 and unavailability will be represented by 0. Similar pattern will be followed for the water supply input. This can be done with the help of a 'Rocker switch' block that we can manually turn ON and OFF.
d. We will apply the given conditions:
i. x==1
ii. x==0
iii. y==1
iv. y==0
to make the system check for power supply and water supply availability. Once available the system will progress to the next state else the system will go to the Power or Water unavailability blocks and the LED will turn RED.
e. Since soaking process needs to be done for 200 seconds so we will add a delay of 200s before the transition to washing takes place with the command 'after(200,sec)'.
f. Similarly, we will add the delay of 100seconds, 20 seconds and 50 seconds to Washing, Rinsing and Drying respectively.
g. Once these processes are completed, we will require the Completion block to send out the output signal.
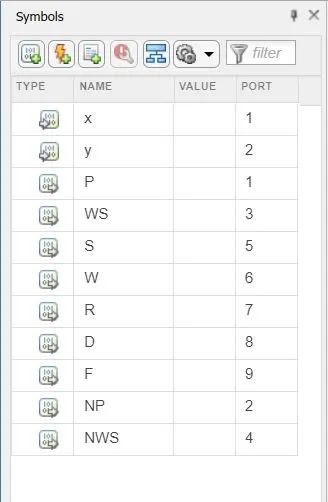
h. These signals can be managed in the Symbols pane under 'Configuration and simulation'. Here we will have to assign the output and input signals as required.
i. In the Simulink model page we will have to assign scopes and display blocks to display the outputs from the chart. The display block will give us the final state of the processes in binary terms (1 for completion, 0 for not)
j. For the LEDs we will use 'Lamp' blocks and configure them to glow RED or GREEN as required and connect them to the desired output signals.
k. We set a simulation time of around 500seconds and obtain the results.
Model:
Results:
From the images shown above, we can see that when the power supply and water supply both are available (indicated by GREEN LED), the entire process is completed and the Finish indicator glows GREEN signalling successful completion of operation.
But when we disconnect the water supply, No Water supply LED glows RED and the process is stopped. Hence the Finish indicator glows RED, signalling non-completion of operation.
2. To make a Gear shift logic we are given the following information:
a. Gear 1 for speeds 0 to 15 kmph
b. Gear 2 for speeds 16 to 25 kmph
c. Gear 3 for speeds 26 to 40 kmph
d. Gear 4 for speeds 41 to 60 kmph
e. Gear 5 for speeds 61 kmph and above
Procedure:
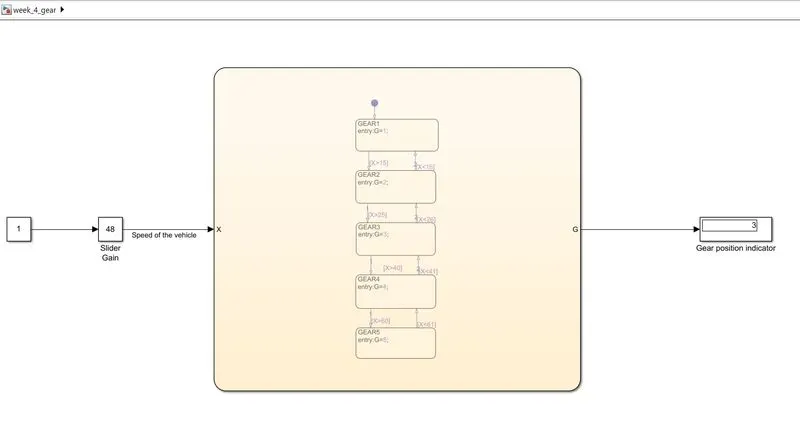
a. We will input the speed of the vehicle for our gear system. For this we will use a 'Slider Gain' block connected to a constant 1 with a range from 0 to 120. With this we can manually change the speed of the vehicle in real time from 0 kmph to 120 kmph.
b. Now we will use the 'Chart' block to enter the logic.
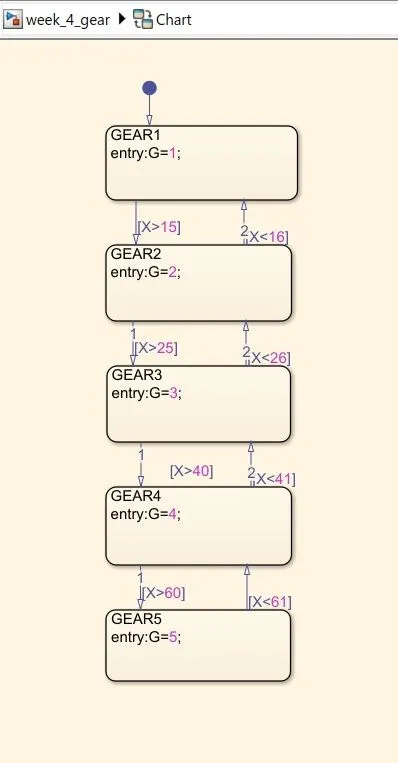
c. In the chart block we will need 5 states to represent the 5 gears.
d. The speed input will be x. Now for the first gear the transition to the second gear will be based on the condition x>15 and the transition from the second gear to the first gear will be on the condition x<16.
e. Similarly, the transition from second gear to third gear will be on the condition x>25; and x<26 will make the shift from gear 3 to gear 2.
f. For the third gear to fourth gear the condition will be x>40 and for the downshift the condition will be x<41.
g. To go from the fourth gear to fifth gear we have x>60 and the downshift condition will be x<61.
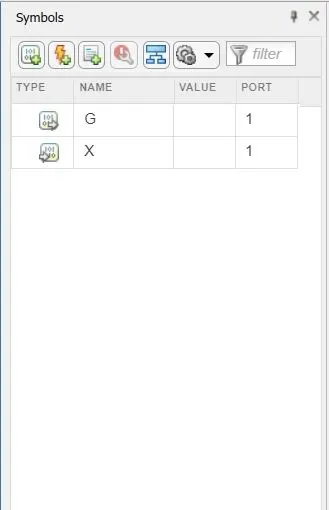
h. To indicate the gear position for the speed the vehicle is in we will have to assign a output G from all the states. The state that currently satisfies the speed condition will give the output that will be displayed using a 'Display' block.
i. Setting the simulation time to 'inf' we can change the speed input manually in real time and check the gear changes.
Model:
Results:
We have found that as we use the Slider gain to change the speed of the vehicle, the gear shift logic works and displays the gear position of the vehicle accordingly.
References:
1. https://in.mathworks.com/help/stateflow/ug/chart-during-actions.html