Week - 4
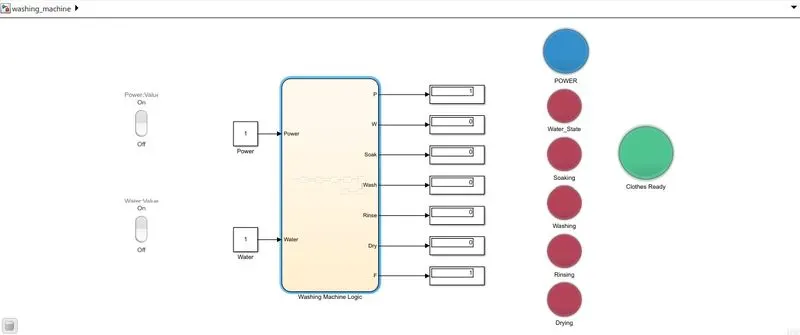
Q1. Implementing a washing-machine using Stateflow method. We will use the following blocks in this simulink model:
- Chart- The chart block is used to create stateflow models. We use a default state and the simulink state boxes to create a stateflow model.
- Constant blocks: Used to give power and water as the input to the chart.
- Rocker Switches: Used to give input to the chart model ie. 1 or 0.
- Displays: The display gives the output of the 7 states of the model ie. Power ON or OFF, Water, Soak mode, Washing mode, Rinsing Mode, Drying mode and finally Clothes done.
- Lamps: Used to give an indication as to which mode is currently in process.
The rocker switches and lamps are connected to the constant blocks and respective displays using the connect button on the block and selecting the connecting element.
The model is shown below:
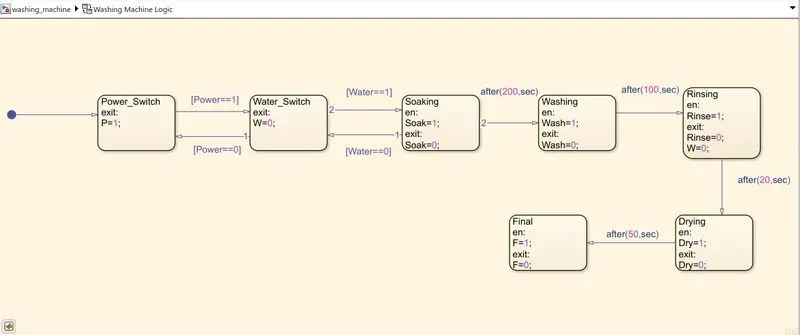
The steps followed in making the washing machine logic are as follows:
- Add a new state block inside the chart, a default state will be created automatically(blue).
- Add a title to the block and the actions/code must be written below it. The arrows must contain a condition and they have to be directed in the appropriate direction ie. towards the next or previous block.
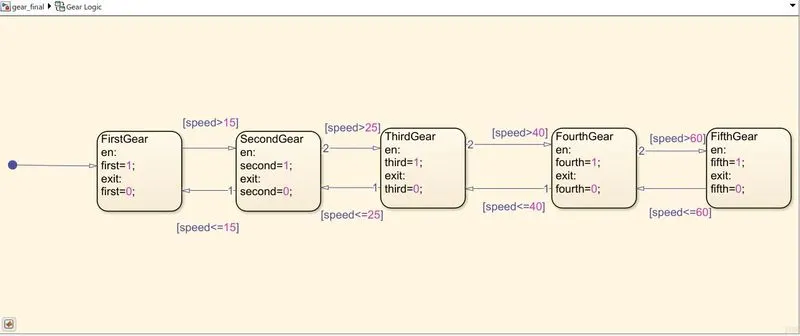
- "en:(or entry:) instructions" is the syntax for writing instructions that need to be executed when the state is first entered.
- "exit: " "instructions" is the syntax for executing instructions as the state is completed and before proceeding to the next state.
- The after() instruction is a condition that goes to the destination state after the given seconds have elapsed. The instruction is after(no.of seconds,sec) where sec is the amount of seconds(calculated by MATLAB) that are calculated when the state is in operation.
Below is a screenshot of the statechart that is created by using the logic as asked in the problem:
Q2: Changing/Shifting gears in a vehicle according to it's speed.
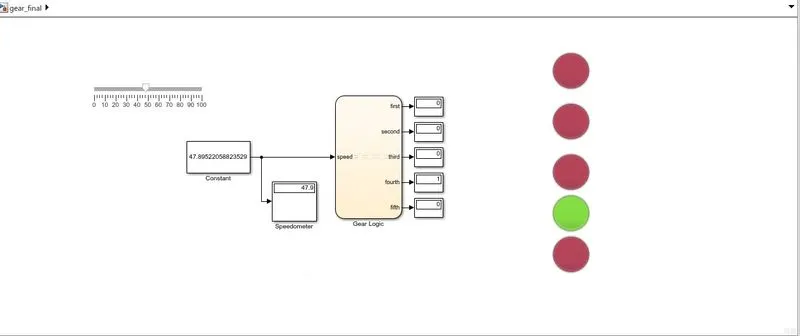
In this model we use the following blocks:
- Slider: To vary the speed of the vehicle in real time during the simulation time.
- Constant block: Speed input or the slider output as this constant block is connected to the slider block.
- Speedometer(Display): It's the display block connected to the constant and displays the output of the constant block.
- Other displays: For the gears, 1 indicates that the gear is operation and 0 that the gear is not in operation.
- Lamps: Indication of the current gear using lights.
The final model is shown below:
Steps used to create the chart are as follows:
- Add a new state in the chart, a default(blue) state appears. The default gear is gear 1 according to the problem as if the speed is over 0 kmph, the first gear is applied.
- Make 5 different states named first, second,third,fourth and fifth gear.
- At the entry(en:) enable the gear ie. make it's value 1 and while exiting(exit:) make it 0.
- The arrows have the different speed limits as given in the problem eg. if speed>=15, go to gear 2 and if it drops below it go to gear 1.
- To simulate this, we need to slow down the simulation using 'simulation pacing' property and use the slider to vary the speed and observe the operation of gears and the shifting.
Here is what the chart looked like finally: