Week - 4
AIM:
- To implement control logic of a "washing machine" using Stateflow.
- To make a Simulink chart for "Gear Shift" logic.
OBJECTIVE:
I. To design and simulate a control logic for a washing machine using the Stateflow in Simulink as per the given sequence:
- If the power supply is available then the system gets activated.
- If the water supply is not available, stop the process & indicate through an LED.
- Soaking time should be 200 seconds followed by a washing time of 100 seconds.
- Then rinsing happens for the next 20 seconds and the dryer runs for 50 seconds.
II. To design & simulate an automatic Gear shift control logic using the Stateflow in Simulink as per the given sequence:
| Speed(km/hr) | Gear |
| 0-15 | 1 |
| 16-25 | 2 |
| 26-40 | 3 |
| 41-60 | 4 |
| 61 and above | 5 |
PROCEDURE:
- Control Logic of a Washing Machine:
Blocks Used:
| Sl. No. | Symbol | Name of Block | Function |
| i |  |
Rocker Switch | The Rocker Switch block toggles the value of the connected block parameter between two values during simulation. It is a part of the Dashboard blocks and dashboard blocks do not use ports to connect to model elements. To connect dashboard blocks to variables and block parameters, use connect mode. Connect mode facilitates the process of connecting dashboard blocks in your model, especially when we want to connect multiple blocks at once. |
| ii |  |
Lamp | The Lamp block displays a color to indicate the value of the input signal. We can use the Lamp block with other Dashboard blocks to build an interactive dashboard of controls and indicators for our model. One can specify pairs of input values and colors to provide the information they want during simulation. |
| iii |  |
Constant | The Constant block generates a real or complex constant value signal. We use this block to provide a constant signal input |
| iv |  |
Stateflow Chart | A finite state machine is a representation of an event-driven (reactive) system. In an event-driven system, the system responds to an event by making a transition from one state (mode) to another. This transition occurs if the condition defining the change is true.
A Stateflow chart is a graphical representation of a finite state machine. States and transitions form the basic elements of the system. |
| v |  |
Display | The Display block shows the value of the input data. One can specify the frequency of the display. For numeric input data, one can also specify the format of the display. |
Input:
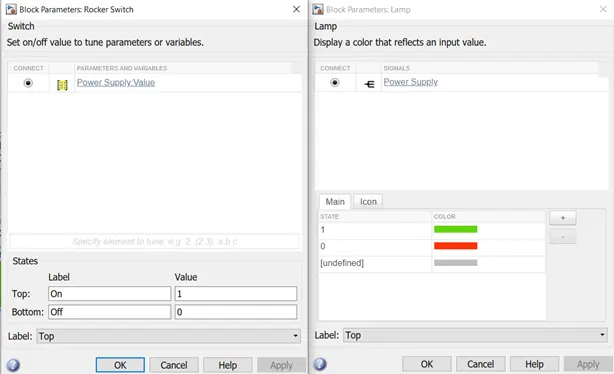
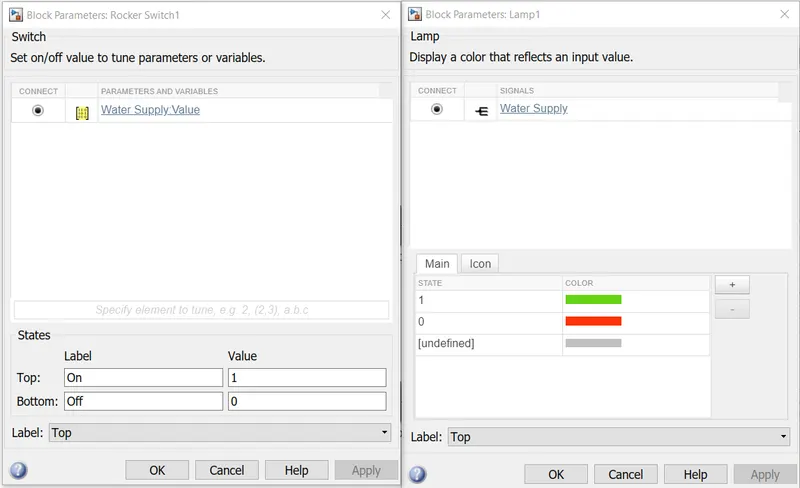
Rocker Switches have been used to model the input Power Supply & Water Supply. The switches control the input values in the constant block denoted by Power Supply & Water Supply. Two lamps are connected to indicate the state of the switches. The lamp turns "RED" if the switch is in the "OFF" state and turns "GREEN" if the switch is in the "ON" state as shown below:
The "ON" state is defined by the value 1 and the "OFF" state is defined by the value 0.
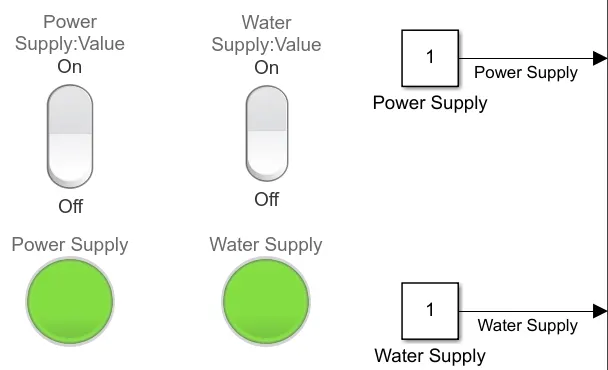
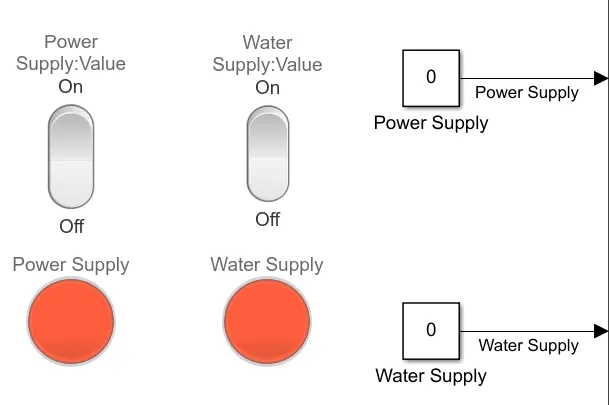
The input setting for the Rocker Switch & Lamp for both the Power supply & Water supply is shown below:
Simulink Model:
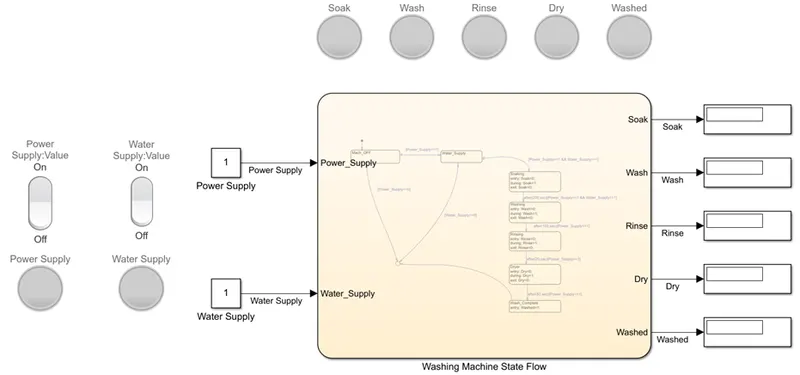
The following is the complete Simulink model of the control logic for a Washing Machine i.e. the Upper hierarchy model.
The Lower hierarchy chart is designed as follows:
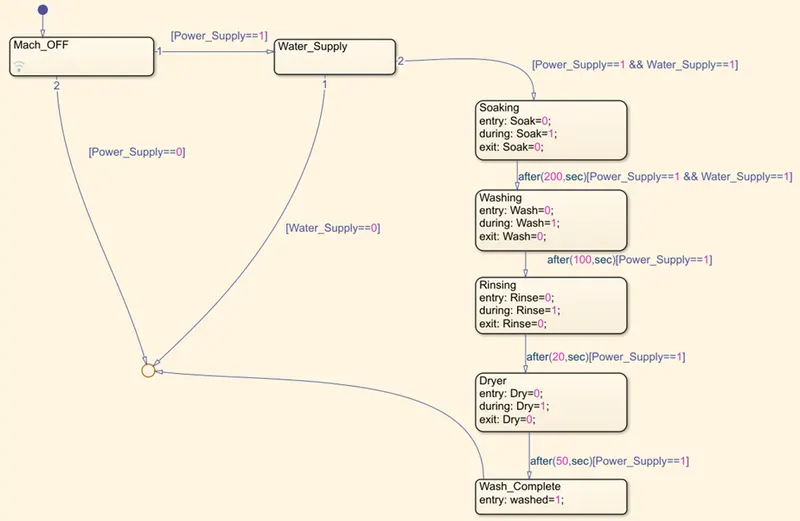
Three logic has been defined entry, during, and exit. When a state is in operation the "during" condition becomes active and an output signal is generated which is linked with a lamp that turns "GREEN".
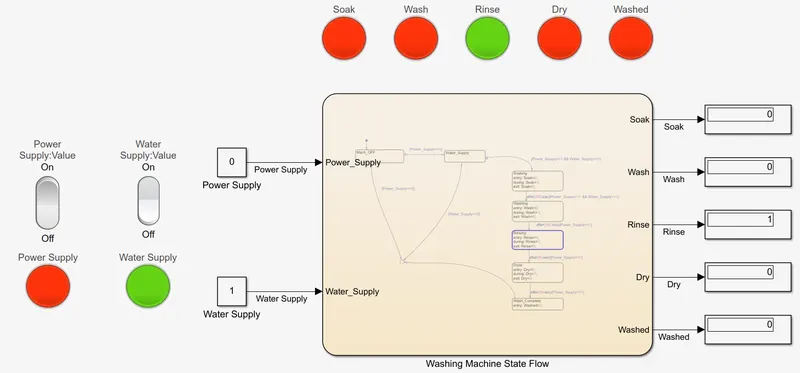
In this model first of all Power Supply is checked and then the Water supply is checked. If both are in the "ON" state, the washing mechanism starts. However, one must note that apart from the time limit for each state another logic has been included i.e. Power Supply must be in the "ON" state at all times, or else the system will cease to function. One such situation has been shown in the Output section.
Output:
The Simulink model is run for 400 seconds and the output has been observed step by step.
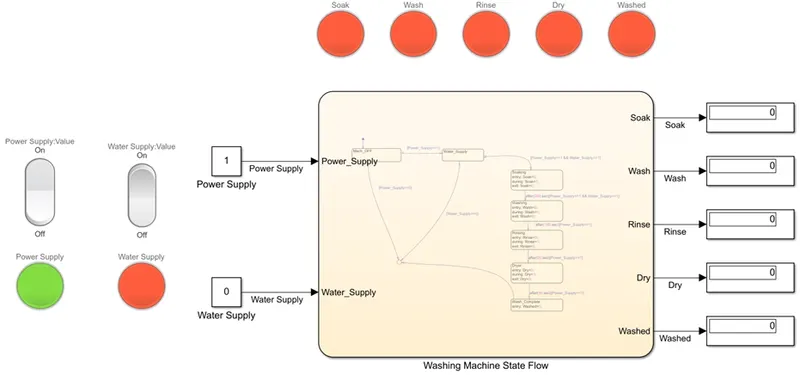
Initially, the Power Supply was turned on but the Water Supply was kept off, as a result of which the system didn't operate and the output is as shown in the screenshot below:
However, later on, the Water Supply was also turned on and then the system started to operate. The simulation was done in steps to observe the operation clearly. Soaking operation was carried out for 200 seconds followed by Washing operation for 100 seconds, further Rinsing operation was carried out for 20 seconds following which the dryer was turned on for 50 seconds after which the washing process was completed.
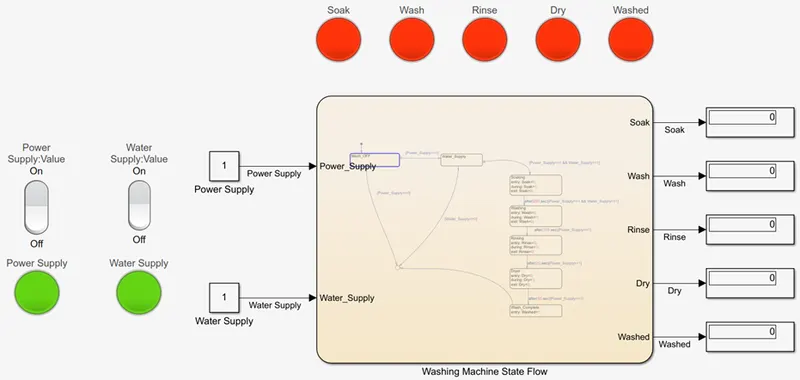
- Both Power Supply & Water Supply have been turned "ON"
- Soaking operation begins
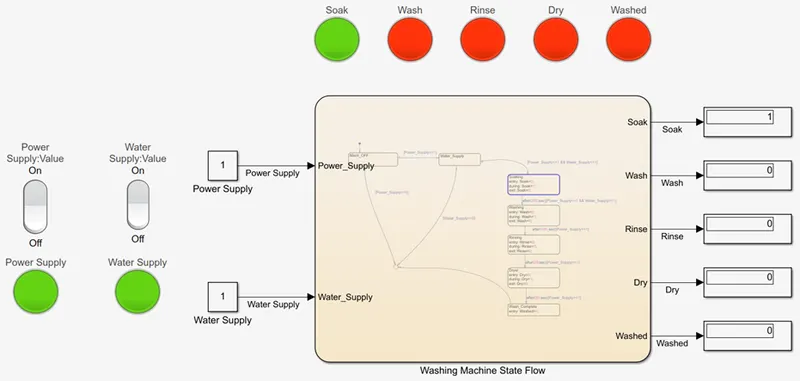
- Soaking operation ends and Washing operation begins
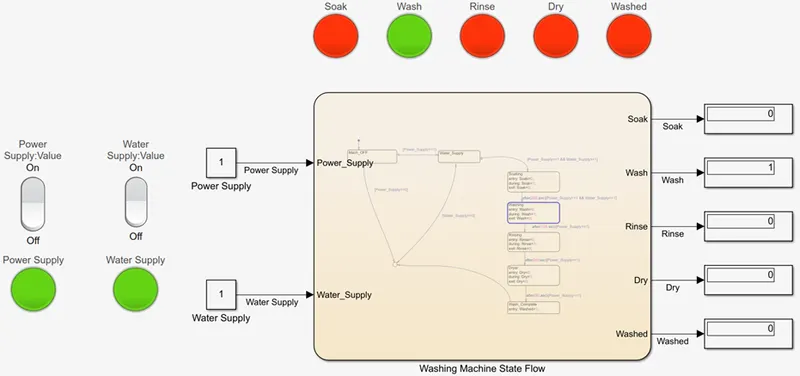
- Washing operation ends & rinsing operation begins
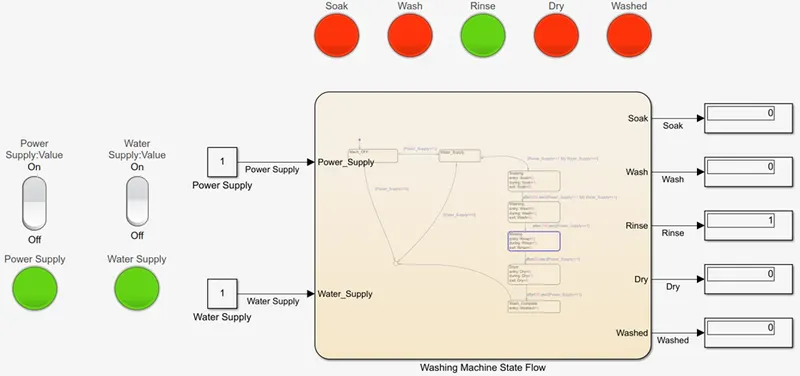
- Rinsing operation ends & Dryer is turned on
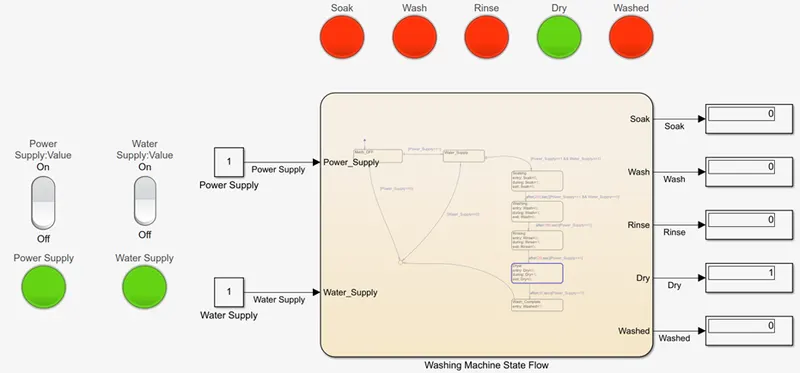
- Drying ends & the washing process is complete
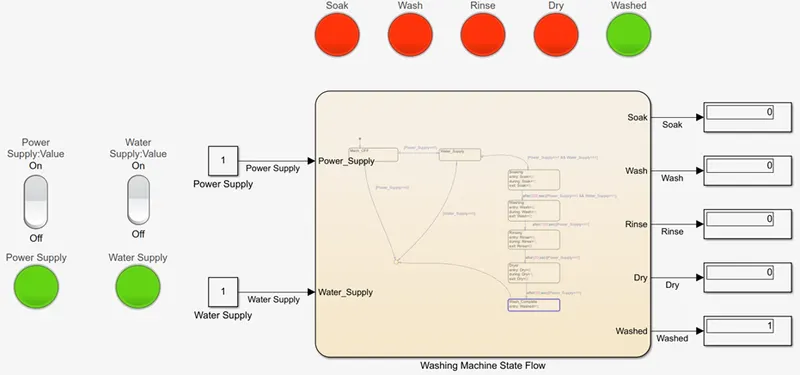
Another instance where power is cut-off mid-way when Rinsing operation was in progress
Observation:
From the above screenshots in the output section one can easily observe that in order for the Washing Machine to start operating two initial conditions must be satisfied i.e. both Power Supply & Water Supply must be available. Also, Power Supply must be available throughout, else the operation will stop as can be seen in the last screenshot where during the Rinsing operation the Power Supply was cut-off, and then it was observed that the operation got terminated.
- Gear Shifting Logic:
Blocks Used:
| Sl. No. | Symbol | Name of Block | Function |
| i |  |
Signal Builder | The Signal Builder block allows us to create interchangeable groups of piecewise linear signal sources and use them in a model. One can quickly switch the signal groups into and out of a model to facilitate testing. In the Signal Builder window, we can create signals and define the output waveforms. |
| ii | |
Constant | The Constant block generates a real or complex constant value signal. We use this block to provide a constant signal input |
| iii |  |
Slider Gain | The Slider Gain block performs a scalar gain that one can modify during simulation. We can modify the gain using the slider parameter. |
| iv |  |
Multiport Switch | The Multiport Switch block determines which of several inputs to the block passes to the output. The block bases this decision on the value of the first input. The first input is the control input and the remaining inputs are the data inputs. The value of the control input determines which data input passes to the output. |
| v | |
Lamp | The Lamp block displays a color to indicate the value of the input signal. We can use the Lamp block with other Dashboard blocks to build an interactive dashboard of controls and indicators for our model. One can specify pairs of input values and colors to provide the information they want during simulation. |
| vi |  |
Slider Switch | The Slider Switch block toggles the value of the connected block parameter between two values during simulation. For example, one can connect the Slider Switch block to a Switch block in a model and change its state during simulation. |
| vii | |
Stateflow Chart | A finite state machine is a representation of an event-driven (reactive) system. In an event-driven system, the system responds to an event by making a transition from one state (mode) to another. This transition occurs if the condition defining the change is true.
A Stateflow chart is a graphical representation of a finite state machine. States and transitions form the basic elements of the system. |
| viii |  |
Scope | The Scope block displays the time-domain signals |
Input:
The input Speed is provided in two ways:
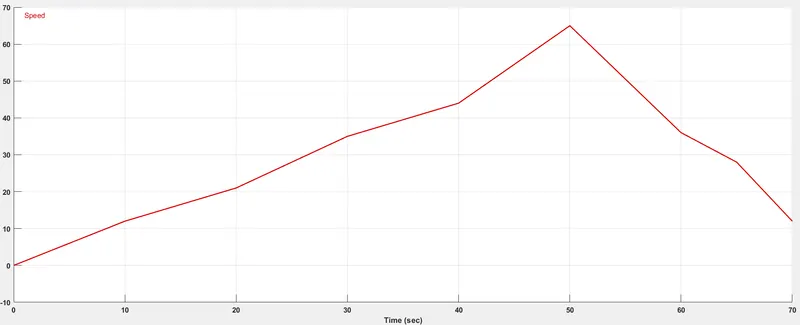
- with the help of a Signal builder block wherein Speed is plotted w.r.t. time.
- with the help of a constant & slider gain block (for real-time analysis)
The input with the help of a Signal builder block is plotted according to the following table:
| Time(seconds) | Speed(km/hr) change |
| 0-10 | 0-12 |
| 10-20 | 12-21 |
| 20-30 | 21-35 |
| 30-40 | 35-44 |
| 40-50 | 44-65 |
| 50-60 | 65-36 |
| 60-65 | 36-28 |
| 65-70 | 28-12 |
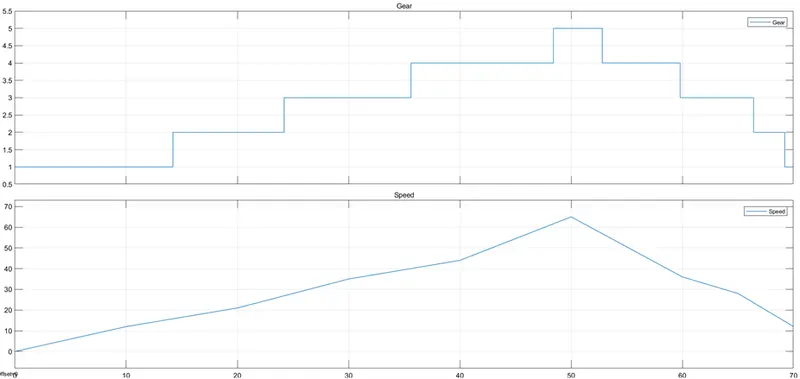
The table above gives us the gradual change in speed w.r.t. time and the same is plotted inside the Signal Builder block as shown below:
The input with the help of a Slider Gain block is obtained as follows
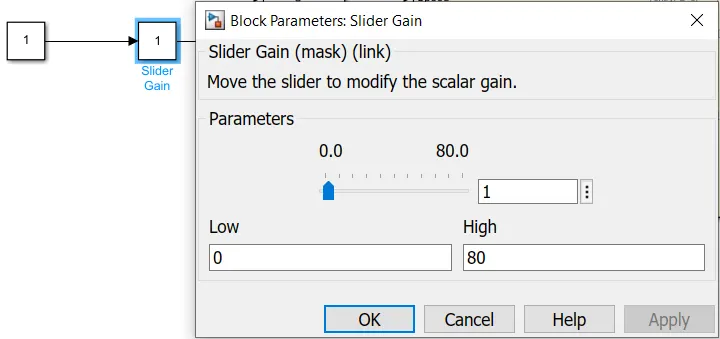
Here, the input is a constant value 1, the slider is at position 1 right now, it can be changed by sliding the arrow. Also, one can adjust the range of the slider by varying the Low & High values. The Slider Gain block helps us attain real-time speed values. The value at the SLider Gain block multiplies with the value of the constant block to generate an output signal.
Simulink Model:
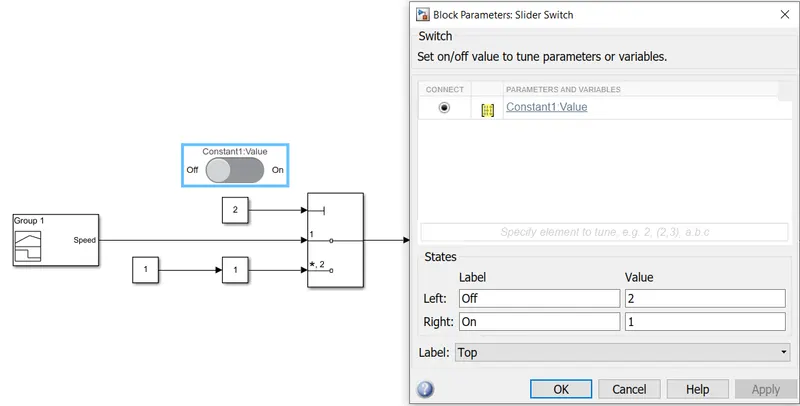
The following Simulink model shows the two different inputs which one can use to observe the shifting of gear. The inputs are managed by a multiport switch the input of which is controlled with the help of a Slider switch. The "ON" state in this slider switch turns on the input from the Signal Builder block, whereas the "OFF" state in the slider switch turns on the input from the Slider Gain block.
The Upper hierarchy model is shown below:
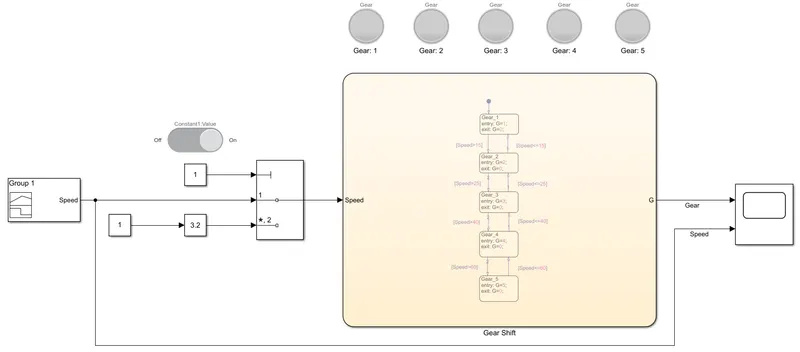
The Logic Chart has been divided into 5 different states for the 5 gears and the shifting arrangements are made as per the following table:
| Speed(km/hr) | Gear |
| 0-15 | 1 |
| 16-25 | 2 |
| 26-40 | 3 |
| 41-60 | 4 |
| 61 and above | 5 |
The Lower hierarchy chart is as shown below:
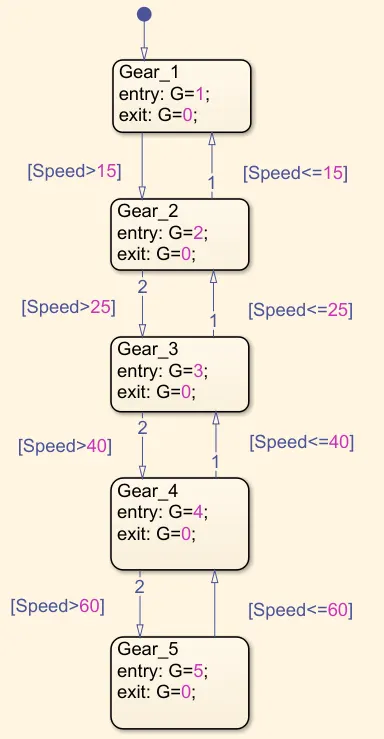
The logic has been defined in a realistic way keeping in mind the speed trajectory of a real vehicle wherein the shifting up & down of gears at regular intervals is a common phenomenon. It is due to this reason that two paths have been defined. i.e. if speed increases beyond a certain specified limit, shifting-up of gear takes place, and if the speed falls down beyond a certain specified limit, shifting-down of gear takes place. This has been done keeping in mind the fact that the speed of a vehicle is never only increasing or decreasing or constant, instead, it varies depending upon various factors e.g. terrain, traffic, weather, etc.
For example: The Gear_1 state will be in operation until the input speed is 15 km/hr. As soon as the input speed crosses 15 km/hr the Gear shifting takes place & Gear_2 state starts operating.
Output:
(for input from Signal Builder block)
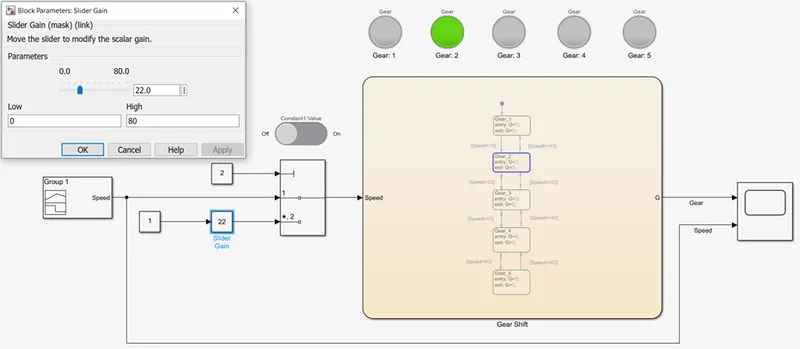
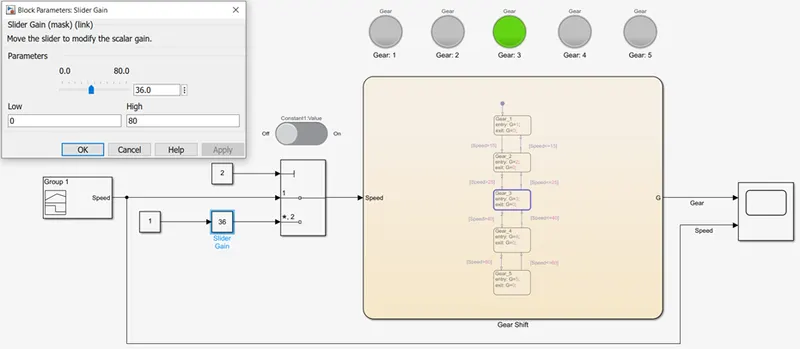
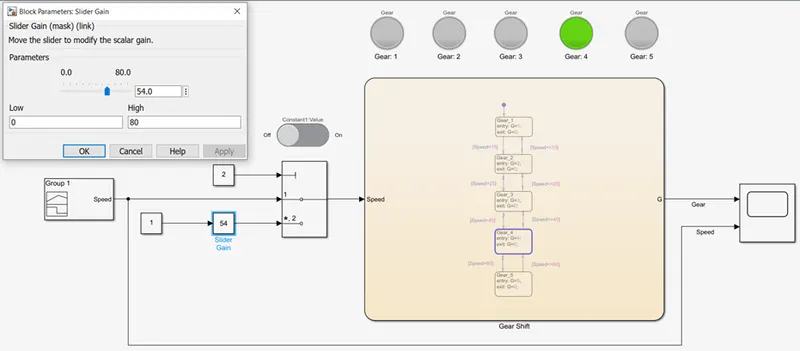
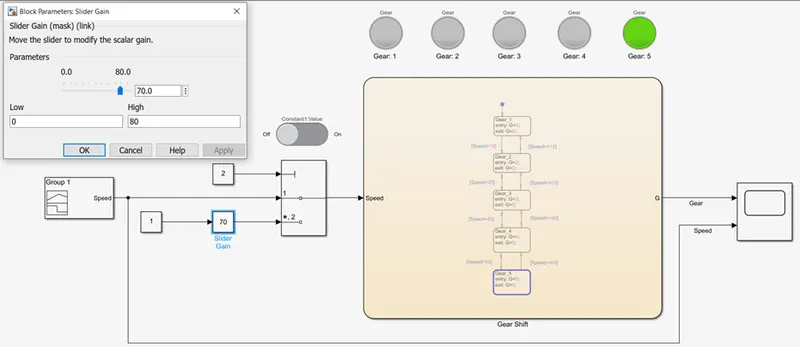
(for input from Slider Gain block)
When the input speed from the Slider Gain is 12 km/hr, the Gear 1 is in operation.
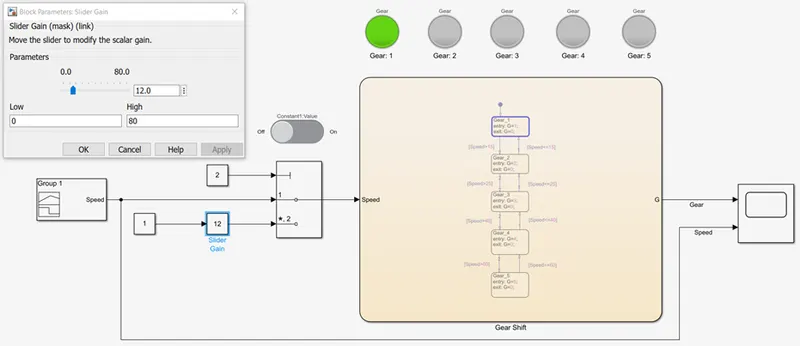
When the input speed from the Slider Gain is changed to 22 km/hr, the Gear 2 is in operation.
When the input speed from the Slider Gain is changed to 36 km/hr, the Gear 3 is in operation.
When the input speed from the Slider Gain is changed to 54 km/hr, the Gear 4 is in operation.
When the input speed from the Slider Gain is changed to 70 km/hr, the Gear 5 is in operation.
Observation:
From the output obtained for both inputs (signal builder & slider gain), it can be observed that the states have been defined in such a way that the gear shifts up & down on the basis of the speed input.
CONCLUSION:
The Stateflow chart can be used to develop a perfect graphical representation of a finite machine wherein states and transitions are the basis of the entire model. After designing the two models above in the question I have gained extraordinary insight into the use of Stateflow chart. It is more or less like a flow diagram where we input the conditions and extract an output. It is easier than writing lines of code for the same work. Moreover, the GUI assists us in preparing as well as making necessary changes or corrections in a given model easily. It is also easy to debug errors and make hassle-free additions or deletions.