Perform a Stateflow in MATLAB & Simulink
1. AIM : Perform a Stateflow in MATLAB & Simulink.
2. OBJECTIVES OF THE PROJECT :
- Solve the below Problem to perform a challenge:
- Implement control logic of a “washing machine” using Stateflow as per given sequence:
- If the power supply is available, the system gets activated
- If the Water supply is not available, stop the process & indicate through LED
- Soaking time should be 200s followed by Washing time of 100s.
- Then rinsing happens for next 20s & dryer runs for 50s
- After all the processes have completed turn on the finished LED
- Make a Simulink chart for the “Gear shift” logic as per below conditions:
- Speed Range(kmph) Gear
- 0 to 15 1
- 16 to 25 2
- 26 to 40 3
- 41 to 60 4
- Above 61 5
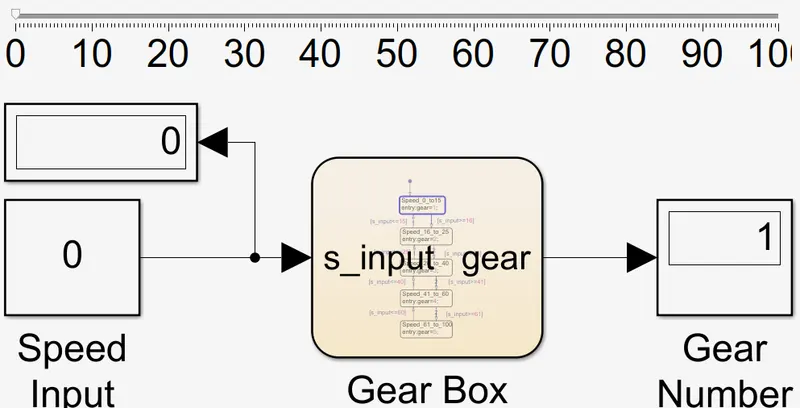
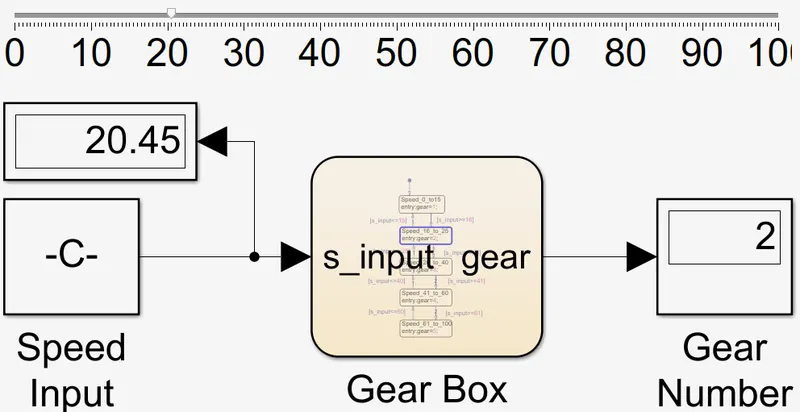
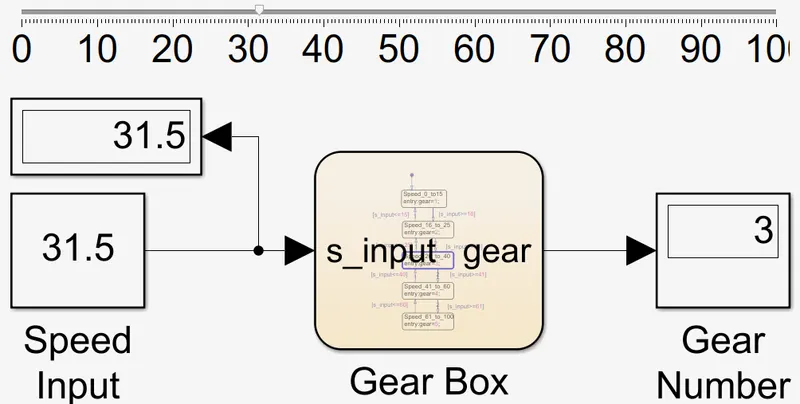
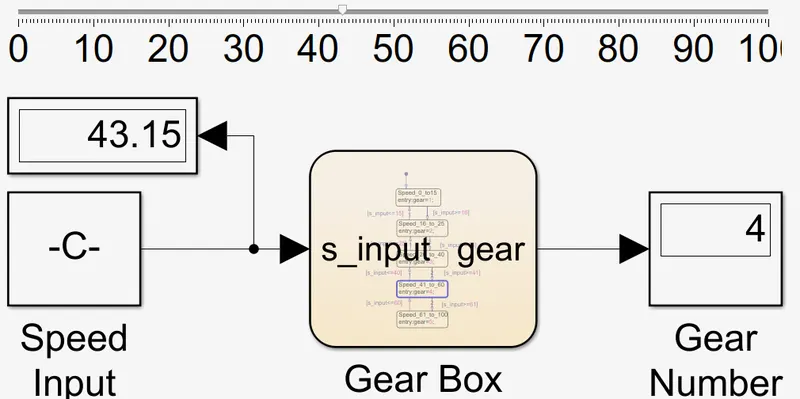
- Give speed input while the simulation is running & display the gear number.
- Implement control logic of a “washing machine” using Stateflow as per given sequence:
3. BODY OF THE CONTENT :
- SOME KEYWORDS:
- Control logic is a key part of a software program that controls the operations of the program. The control logic responds to commands from the user, and it also acts on its own to perform automated tasks that have been structured into the program.
- Stateflow is a control logic tool used to model reactive systems via state machines and flow charts within a Simulink model.
- A Stateflow chart is a graphical representation of a finite state machine consisting of states, transitions, and data.
- PERFORMING FIRST PROBLEM:
In this Problem, Only A basic cycle of washing machine will be performed. Such as Soaking, Washing, Rinsing, Dryer etc....
Let's perform above cycles with time condition & some visual indicators for power connection, water flow & current cycle status.
Here is my control logic of a “washing machine” using Stateflow as per below,
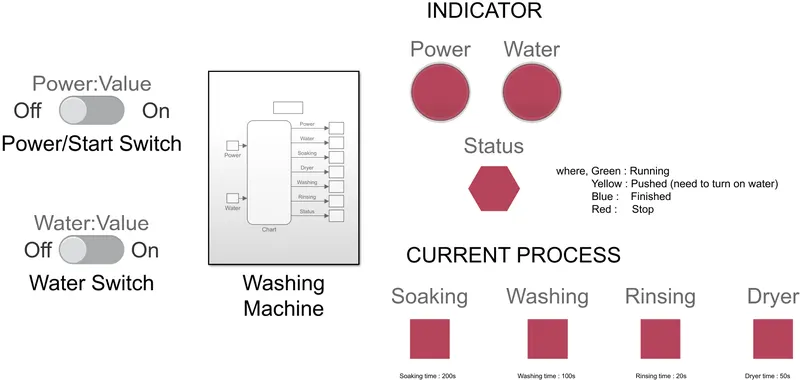
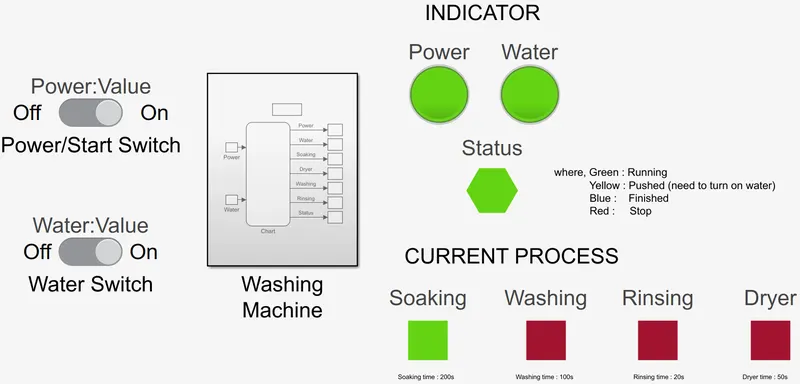
As per diagram on the left-side there are Two switches given, one for Power on/off and another for water. And on right-side some indicator are given. It's will turn on/off while the system is running. Using a switch we are giving input to the "Washing Machine subsystem" & Using Indicators a graphical representation was created. Inside the "washing machine subsystem" as below.
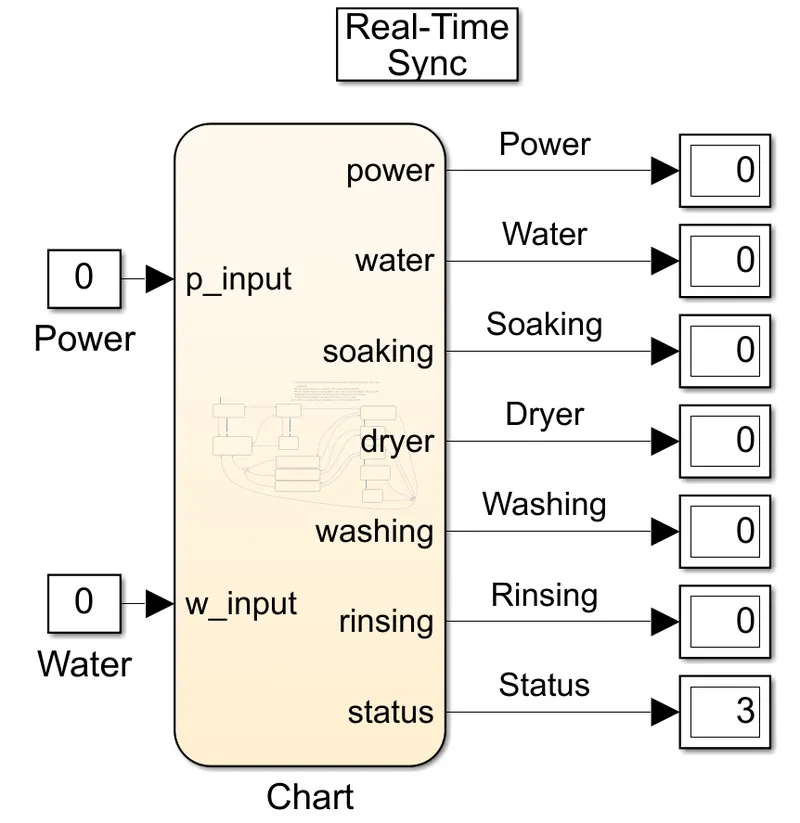
As per 'washing machine subsystem' a 'Power' & 'Water' constant value is linked with the switches respectively. And the generated output of the cycle is displayed by the 'display block' and the Indicators are linked with these 'display blocks' respectively. Where based on the 'Display blocks' value Indicator changing its color. And 'Real-Time sync block' is used to give input in actual time.
Here "Chart" is a simulink's stateflow environment. In that we have to draw processes as below using a stateflow object.
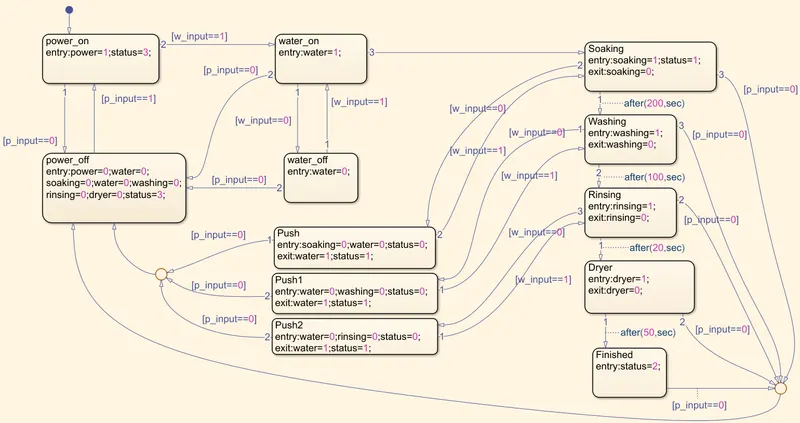
From the ablow fig. We can see how all the processes are going to work. where, 'p_input' and 'w_input' are as input variables and after the 'entry' & 'exit' commands all variable are as output variables. And we can see many conditions between the state blocks based on challenge.Here we can visualise how the system is going to perform. Now tall understanding about the model is completed. So, Now we are going to see how it will perform when the system is on.
- When Power is ON. It look like,
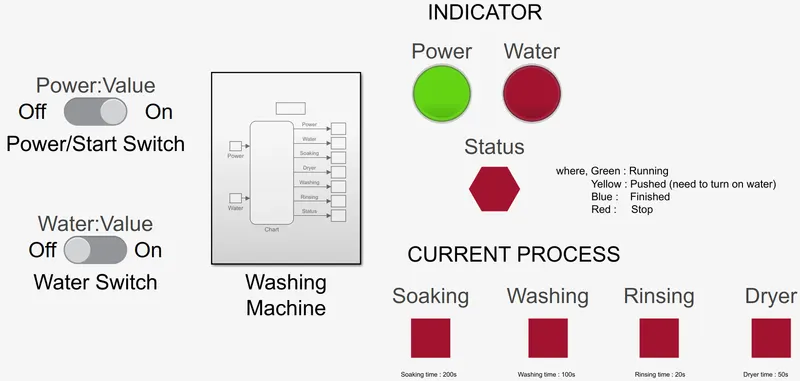
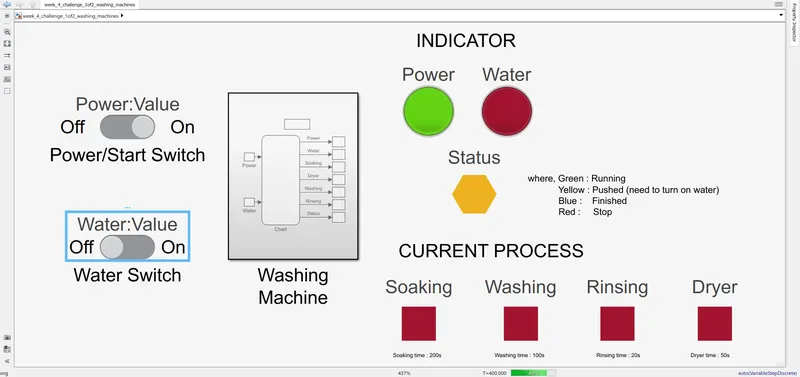
The Process is still not started as can be seen from the status indicator, because the water Switch/valve is off.
- After turn on Water switch/Valve, we can see the 'Status' indicator showing green light & 'Soaking' prosses is started.
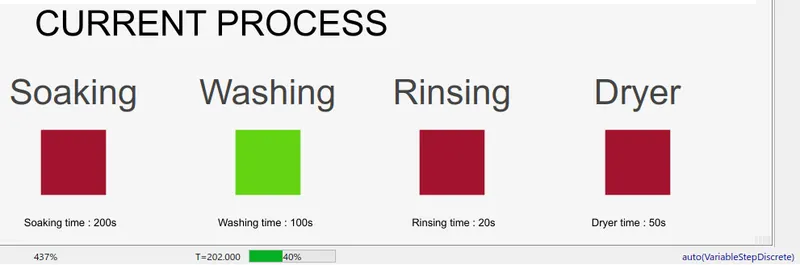
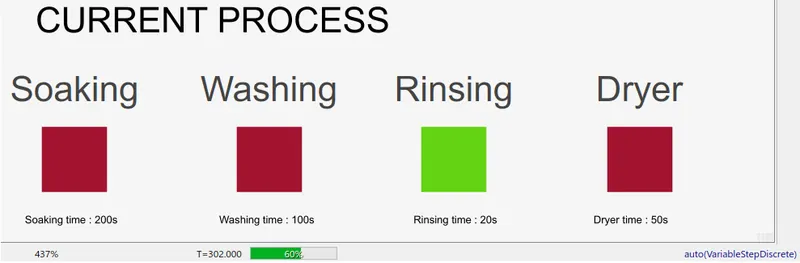
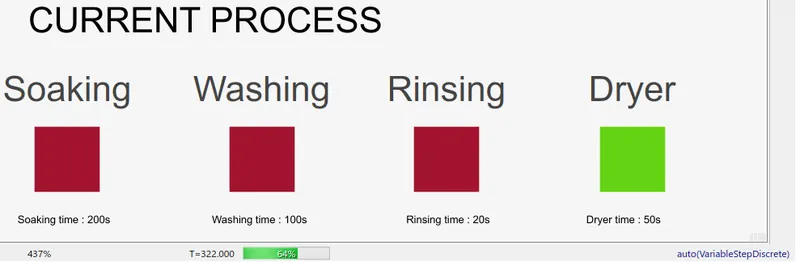
- How the process is going to change after its finished time can be seen from below images.
- And Last at the end of all the process A Blue Light Indicate in 'Status indicator'. as below,
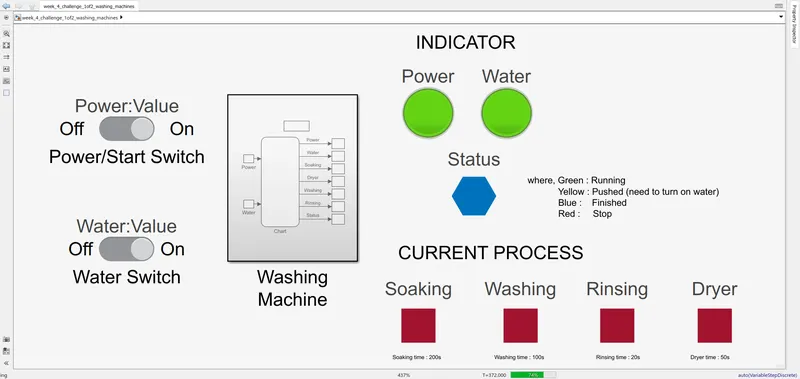
- If the Water connection off/close 'Status indicator' will show 'Yello light' as below, and stop the process, Now If connection is back process start from its last stage, not from beginning.
- Also In the running system if the Power cutoff happens(by turning of power switch), then All the process is going to off and after switching on the process starts at the beginning.
- PERFORMING FIRST PROBLEM:
The Problem is Make a Simulink chart for the “Gear shift” logic. Where the Gear changes with respect to varying speed with time.
Below is the Simple Simulink chart for the "Gear shift" logic.
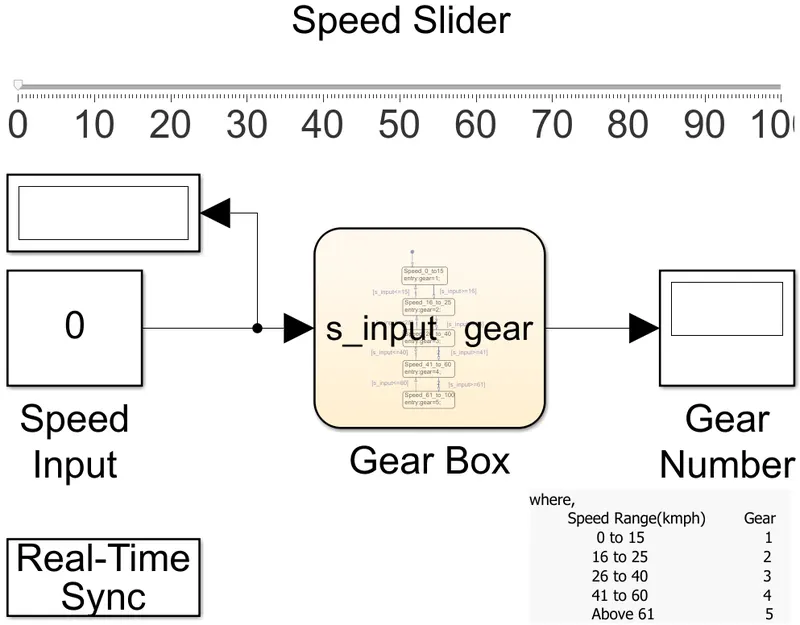
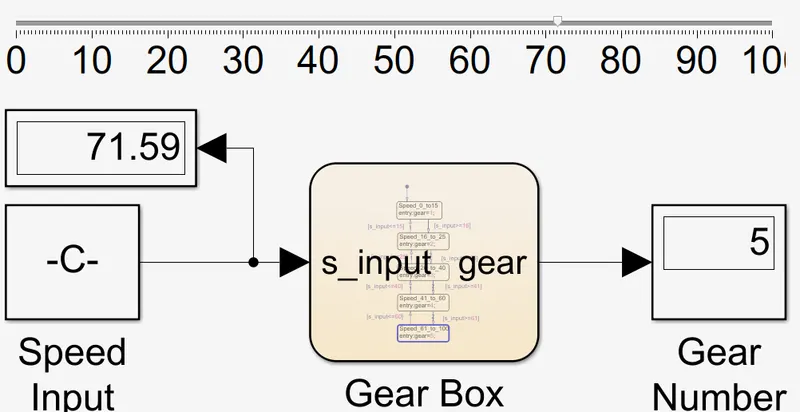
As above Image, There is a "Speed Input Constant Block" it use as input for "Gear Box chart" & "Speed Input" value comes from "Speed Slider". While the simulation is running we can give inputs from "Speed Slider". And Using a "Display block" input value can be seen. Then "GearBox chart" simulates those values based on no. of condition and giving some output. Here as output we receive " Gear Number". On last to give value in real time "Real TIme Sync" block is used.
Let's see inside the "GearBox Chart" Block as below.
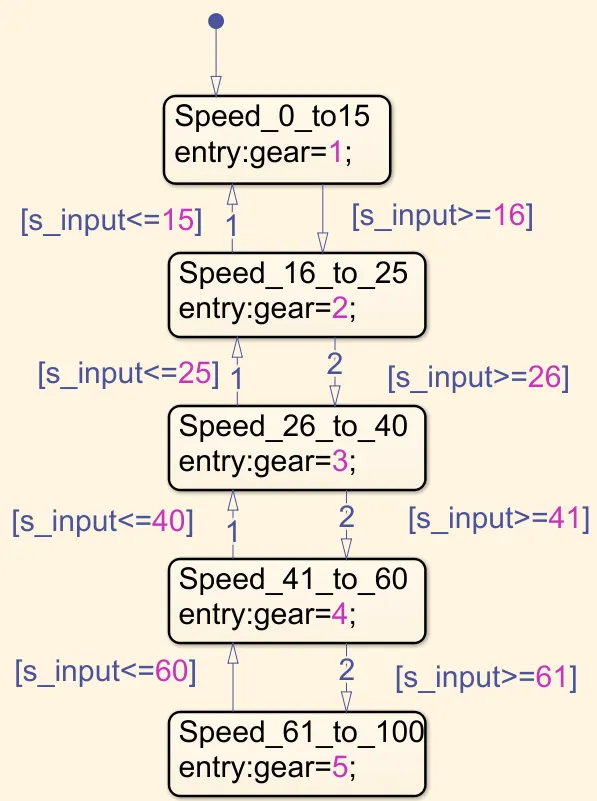
Here, Using a "State" & " Applying the Conditions" a whole chart is created. Where "s_input" variable use as input value & "gear" variable use as output value. The "gear" value is being changed in every state. And Every state represent a 'speed range' of gear using a applied condition.So, Let's see How the gear number is change with respect to speed limit given in challenge.
4. CONCLUSION :
By performing the above challenges , I became familiar with the Stateflow, control logic, Simulink chart... Such as how to use the "stateflow environment", how to use its tool, how to apply conditions/variables in a flow & most important how to perform with real time.......