Project 1 - Parsing NASA thermodynamic data
1. AIM : Parsing NASA thermodynamic data (dat.file)
2. GOVERNING EQUATIONS :
The thermodynamic data are stored as polynomial fits to specific heat, enthalpy, and entropy. There are seven coefficients for each of two temperature-ranges. Thus for each species there are 14 coefficients in all.
The NASA polynomials have the form:
`C_p/R =a_1+a_2*T+a_3*T^2+a_4*T^3+a_5*T^4`
`frac{H}{RT}=a_1+a_2*T/2+a_3*T^2/3+a_4*T^3/4+a_5*T^4/5+a_6/T`
`S/R=a_1*lnT+a_2*T+a_3*T^2/2+a_4*T^3/3+a_5*T^4/4+a_7`
where, `a1, a2, a3, a4, a5, a6,` and `a7` are the numerical coefficients supplied in NASA thermodynamic files(.dat).
`C_p` = specific heat(J/mol*K)
`R` = universal gas constant (J/mol*k)
`T` = temperature (K)
`H` = enthalpy (J)
`S` = entropy (J/K)
SOME DEFINITIONS :
Specific heat : The specific heat is the amount of heat per unit mass required to raise the temperature by one degree Celsius.
Gas constant : In physics, the gas constant is proportionality constant used to relate the energy scale to temperature scale, when one mole of particles at a defined temperature is considered. The ideal gas constant is the combination of Boyle’s law, Avogadro’s number, Charles’s law and Gay-Lussac’s law. Thus, gas constant R value can be given as R = 8.3144598 J/mol*k.
Enthalpy : Enthalpy is the sum of the internal energy and the product of pressure and volume.
Entropy : Normally entropy is defined as a measure of randomness or disorder of a system.
3. OBJECTIVES OF THE PROJECT:
- Write a function that extracts the 14 coefficients and calculates the enthalpy, entropy and specific heats for all the species in the data file.
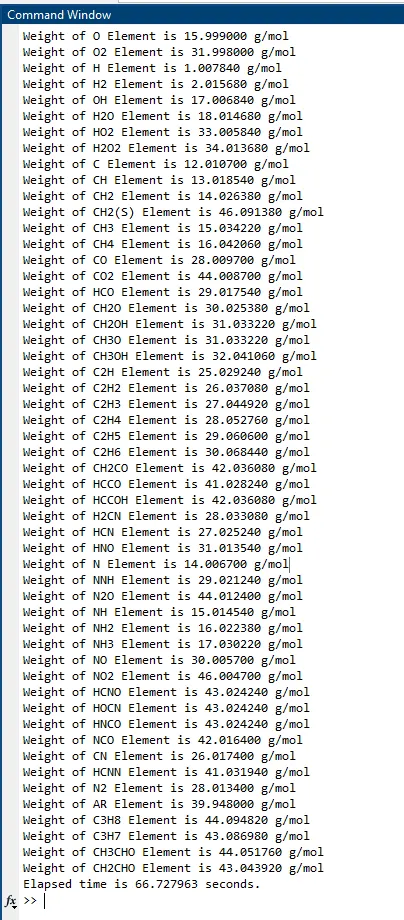
- Calculate the molecular weight of each species and display it in the command window.
- Plot the Cp, Enthalpy and Entropy for the local temperature range (low temperature : high temperature) specific for each species.
- Save the plots as images with appropriate names and dump them in separate folders for each species with suitable name. All these should be generated automatically.
4. BODY OF THE CONTENT:
- EXPLORING FILE (.dat) :
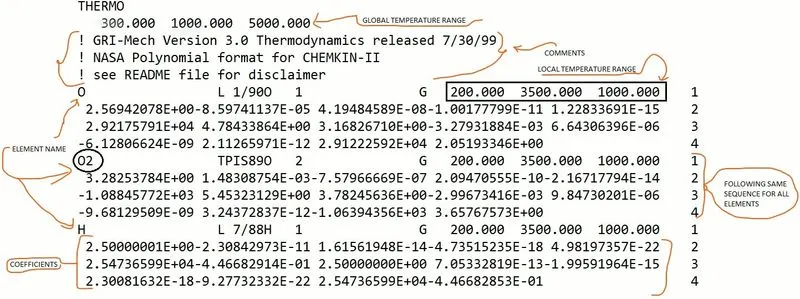
Here is one screenshot of the (.dat) file given.
The first 5 lines are taken as comments, So skipping those lines. (1) line has a Molecule name & Local temperature range as shown. (2)(3)(4) contains a coefficient, where 8 to 14 are low temperature coefficient and 1 to 7 are high temperature coefficient.Similarly this pattern is the same for all next molecule. This (.dat) file has a total of 53 molecules.
- EXPLAINING LOGIC BEHIND MY CODE :

Step 1 : Opening 'THERMO.dat' file for reading. Here if output, thermo = positive value , means the selected file is valid.

Step 2 : Read the line using "fgetl" command and run 5 times to skip first five line as comments.

Step 3 : Running 'for-loop' for 53 times, because 53 elements are present in file(.dat).
Means, Here I am extracting all values of a,Cp,H,S and generating plots & saving it in their folder in one loop cycle. So for the number of loops it will save a number of plots.
INSIDE THE FOR LOOP :

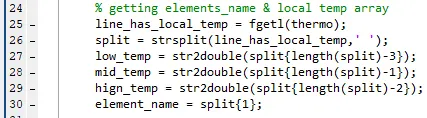
After skipping the first 5 lines, using the fgetl() command we take 1 line from the 'set of four lines' & using split command extracting the local temperature & element name.

from local temperature values we create a low to higher temperature array.

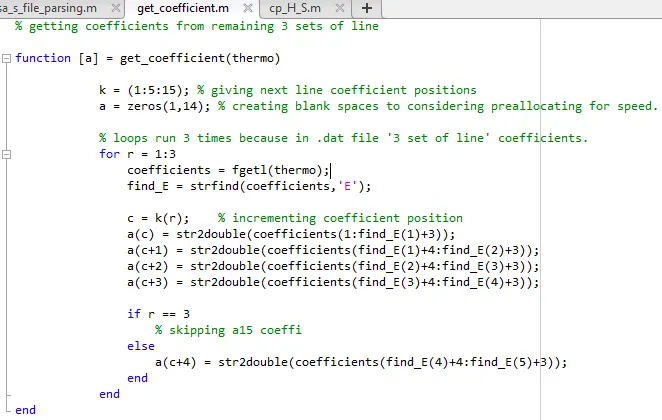
Using " [a] = get_coefficient(thermo) " this function.
For remaining 3 sets of line, for each line we finding 'E' position(find_E), using the value of 'E' position we extracting a set of numbers around letter 'E' and convert them to a number value to use as a coefficients.here is three line so,loop run 3times to get all 14-coefficients of one elements.

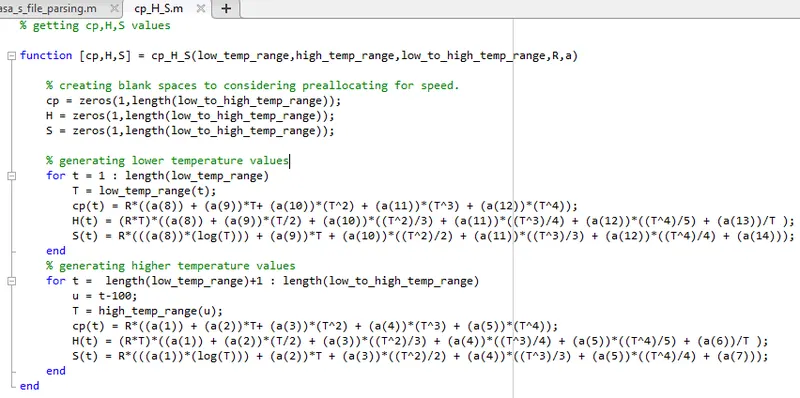
Using "[cp,H,S] = cp_H_S(low_temp_range,high_temp_range,low_to_high_temp_range,R,a)" this function.
here we use the value of 'low_temp_range' & 'high_temp_range' & sequentially putting each value of temp. in 'NASA's polynomials' equations (Cp,H,& S).

Now, we are creating & locating a folder to save each element plots in their respective folder.
in line-46, we Identify the current folder to use later(at the end of 'for loop'). Then create a folder of the element name using mkdir(),(line-48). Then changing directory to their element named folder.
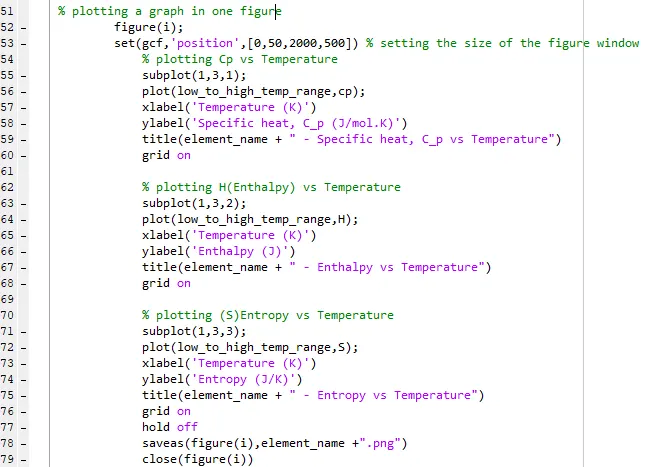
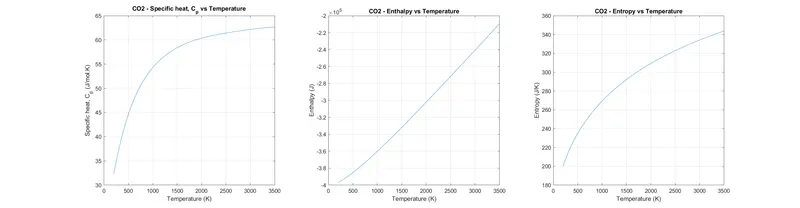
Now, Plotting a figure that contain 3 graph of each element (Specific heat, C_p vs Temperature, Enthalpy vs Temperature, Entropy vs Temperature) . In line-53 fixing the size of figure window. Then plotting three different graphs in one window using the 'subplot' command and giving some labels.
Then save as a .png file, After visualizing the command it will close the figure window(line-79).I can also hold that window for some time but 1 or 2 seconds are enough for visual inspection. OR I can also suppress the output of the figure window (but later I have to open the .png file)..

Now, I need to change the directory to their previous location after saving all plots because the "elements_weight" function exists in the previous location & also to get the next element data in the next loop (getting next 'four sets of lines'). At (line-83) a one cycle of loop ended.
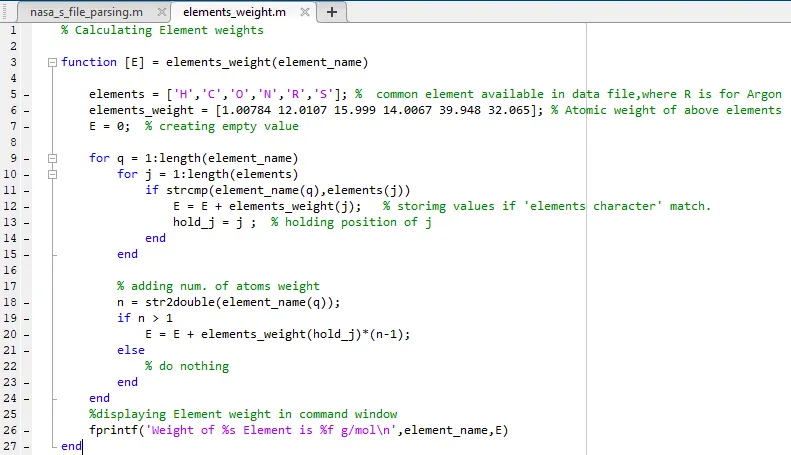
In line-82, Using '[E] = elements_weight(element_name)' function calculating Element weights.
In line-5 creating an array of common element available in data file. Then creating an array of its weight(line-6). In (line-11) for-loop using "strcmp" comparing each element from (.dat)file , and If it matches it will add a particular weight in the "E" variable. Next in (line-20) if n is a number and its >1 then its again add a weight as value of n. Here (line-20) the value of "hold_j" come in to play to add only particular weight in 'E'.
Then using the 'fprintf' command displaying the weight of the element in the command window.

on last, Closing the (.dat) file.
- LOGIC BEHIND CHOOSING ASPECTS TO PARSE OUT OF THE FILE :
In matlab using such commands (fopen, fclose, fgetl, fprintf, etc..) we can use the data that is available in the file.
Basically, Parsing is the process of analyzing a string of symbols, either in natural language, computer languages or data structures, conforming to the rules of a formal grammar.
When the data is available in large amounts at that time 'the file parsing' method/concept is very useful to manage that data to generate meaningful output.
5. MATLAB CODE :
# INPUT :
clear variables
close all
clc

tic
thermo = fopen('THERMO.dat','r');    % reading the file

for i = 1 :5   % where, 5 is number of line as comments to skip
    comments = fgetl(thermo);
end     % skipping first 5 lines as comments

% Nomenclature
% T = temperature (K)
% R = universal gas constant (J/mol*k)
% cp = specific heat(J/mol*K)
% H = enthalpy (J)
% S = entropy (J/K)
% M = molecule

R = 8.3145; % universal value of R
% getting element name, coefficients & creating plots of elements
for i = 1 : 53    % loops run 53 times because there are total 53 elements

    % getting elements_name & local temp array
    line_has_local_temp = fgetl(thermo);
    split = strsplit(line_has_local_temp,' ');
    low_temp = str2double(split{length(split)-3});
    mid_temp = str2double(split{length(split)-1});
    hign_temp = str2double(split{length(split)-2});
    element_name = split{1};

    % creating local temperature ranges
    low_temp_range = linspace(low_temp,mid_temp);
    high_temp_range = linspace(mid_temp + 1,hign_temp);
    low_to_high_temp_range = [low_temp_range  high_temp_range];

    % getting coefficients (a) using a function
    [a] = get_coefficient(thermo);

    % getting cp, H, S values using a function
    [cp,H,S] = cp_H_S(low_temp_range,high_temp_range,low_to_high_temp_range,R,a);

% creating folder and plotting figure in their element_name folder

        % locating a specific folder to save all element in that folder
        current_file_path = pwd; % saving current_file_path.
        % creating folder of element  name
        [~,~] = mkdir(element_name);    % suppressing [status,msg] output using "~,~".
        cd (pwd + "\"+ element_name)

% plotting a graph in one figure
        figure(i);
        set(gcf,'position',[0,50,2000,500]) % setting the size of the figure window
            % plotting Cp vs Temperature
            subplot(1,3,1);
            plot(low_to_high_temp_range,cp);
            xlabel('Temperature (K)')
            ylabel('Specific heat, C_p (J/mol.K)')
            title(element_name + " - Specific heat, C_p vs Temperature")
            grid on

            % plotting H(Enthalpy) vs Temperature
            subplot(1,3,2);
            plot(low_to_high_temp_range,H);
            xlabel('Temperature (K)')
            ylabel('Enthalpy (J)')
            title(element_name + " - Enthalpy vs Temperature")
            grid on

            % plotting (S)Entropy vs Temperature
            subplot(1,3,3);
            plot(low_to_high_temp_range,S);
            xlabel('Temperature (K)')
            ylabel('Entropy (J/K)')
            title(element_name + " - Entropy vs Temperature")
            grid on
            hold off
            saveas(figure(i),element_name +".png")
            close(figure(i))

cd (current_file_path)  % changing directory to their default location
[E] = elements_weight(element_name);   % Calculating Molecular weights and displaying  it in command window
end

fclose(thermo); % finally closing the file
toc     % calculating elapsed time
# FUNCTION :
- function to get coefficients
% getting coefficients from remaining 3 sets of line

function [a] = get_coefficient(thermo)

            k = (1:5:15); % giving next line coefficient positions
            a = zeros(1,14); % creating blank spaces to considering preallocating for speed.

            % loops run 3 times because in .dat file '3 set of line' coefficients.
            for r = 1:3
                coefficients = fgetl(thermo);
                find_E = strfind(coefficients,'E');

                c = k(r);    % incrementing coefficient position
                a(c) = str2double(coefficients(1:find_E(1)+3));
                a(c+1) = str2double(coefficients(find_E(1)+4:find_E(2)+3));
                a(c+2) = str2double(coefficients(find_E(2)+4:find_E(3)+3));
                a(c+3) = str2double(coefficients(find_E(3)+4:find_E(4)+3));

                if r == 3
                    % skipping a15 coeffi
                else
                    a(c+4) = str2double(coefficients(find_E(4)+4:find_E(5)+3));
                end
            end
end- function to get Cp, H, S values
% getting cp,H,S values

function [cp,H,S] = cp_H_S(low_temp_range,high_temp_range,low_to_high_temp_range,R,a)

    % creating blank spaces to considering preallocating for speed.
    cp = zeros(1,length(low_to_high_temp_range));
    H = zeros(1,length(low_to_high_temp_range));
    S = zeros(1,length(low_to_high_temp_range));

    % generating lower temperature values
    for t = 1 : length(low_temp_range)
        T = low_temp_range(t);
        cp(t) = R*((a(8)) + (a(9))*T+ (a(10))*(T^2) + (a(11))*(T^3) + (a(12))*(T^4));
        H(t) = (R*T)*((a(8)) + (a(9))*(T/2) + (a(10))*((T^2)/3) + (a(11))*((T^3)/4) + (a(12))*((T^4)/5) + (a(13))/T );
        S(t) = R*(((a(8))*(log(T))) + (a(9))*T + (a(10))*((T^2)/2) + (a(11))*((T^3)/3) + (a(12))*((T^4)/4) + (a(14)));
    end
    % generating higher temperature values
    for t =  length(low_temp_range)+1 : length(low_to_high_temp_range)
        u = t-100;
        T = high_temp_range(u);
        cp(t) = R*((a(1)) + (a(2))*T+ (a(3))*(T^2) + (a(4))*(T^3) + (a(5))*(T^4));
        H(t) = (R*T)*((a(1)) + (a(2))*(T/2) + (a(3))*((T^2)/3) + (a(4))*((T^3)/4) + (a(5))*((T^4)/5) + (a(6))/T );
        S(t) = R*(((a(1))*(log(T))) + (a(2))*T + (a(3))*((T^2)/2) + (a(4))*((T^3)/3) + (a(5))*((T^4)/4) + (a(7)));
    end
end- function to get element weight
% Calculating Element weights

function [E] = elements_weight(element_name)

    elements = ['H','C','O','N','R','S']; %  common element available in data file,where R is for Argon
    elements_weight = [1.00784 12.0107 15.999 14.0067 39.948 32.065]; % Atomic weight of above elements
    E = 0;  % creating empty value

    for q = 1:length(element_name)
        for j = 1:length(elements)
            if strcmp(element_name(q),elements(j))
                E = E + elements_weight(j);   % storimg values if 'elements character' match.
                hold_j = j ;  % holding position of j
            end
        end

        % adding num. of atoms weight
        n = str2double(element_name(q));
        if n > 1
            E = E + elements_weight(hold_j)*(n-1);
        else
            % do nothing
        end
    end
    %displaying Element weight in command window
    fprintf('Weight of %s Element is %f g/mol\n',element_name,E)
end
# OUTPUT :
- Screenshot of the window where all the folders are saved.

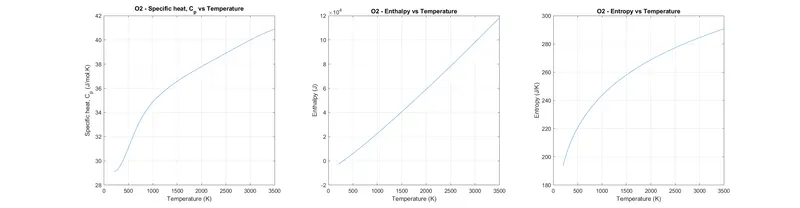
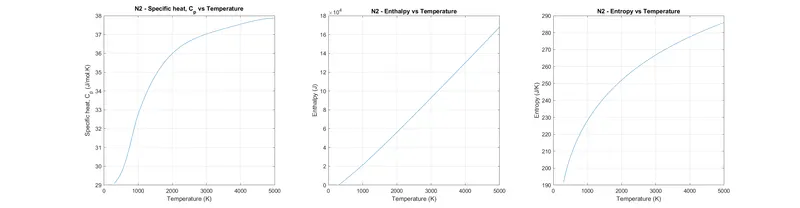
- Species displaying in the command window
- Errors faced while programming :
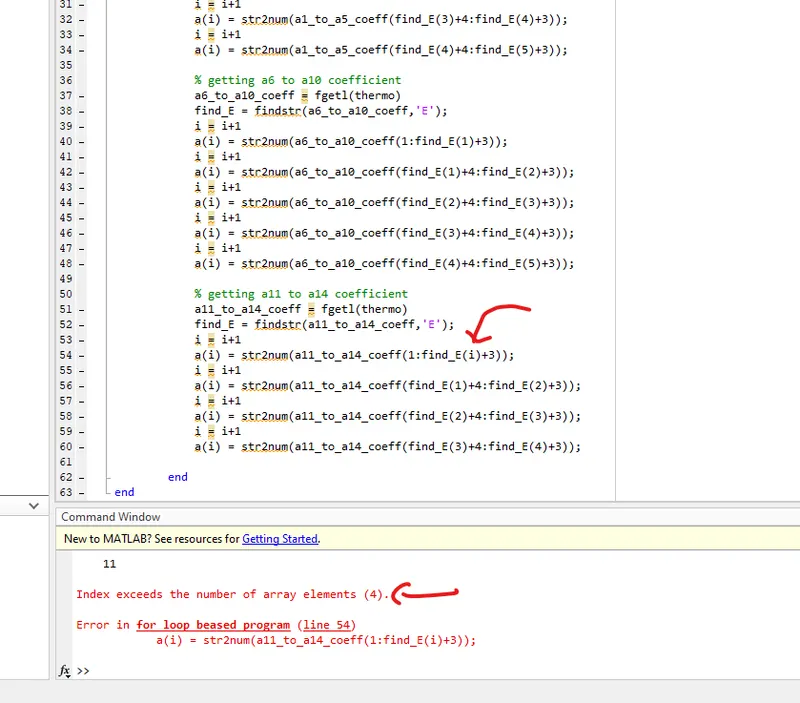
In above error : " instead of "i" have to put_1 "
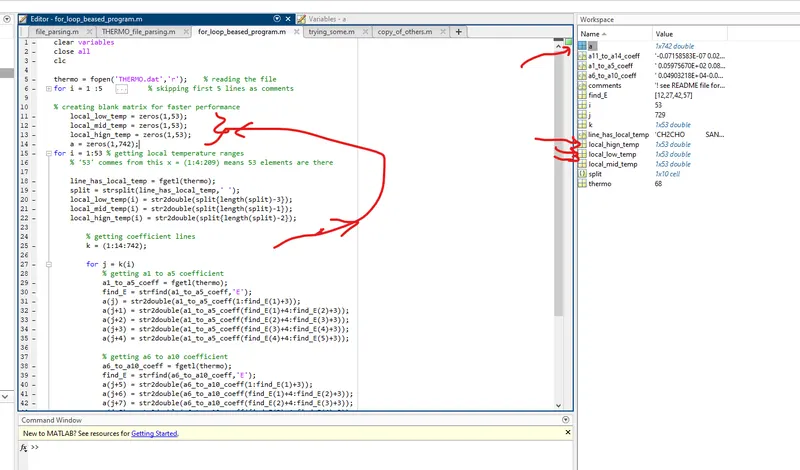
In the above error :I have to put (local_low_temp, local_mid_temp, local_high_temp) out of the for_loops ,because inside the loop it's keeping zero on every run.
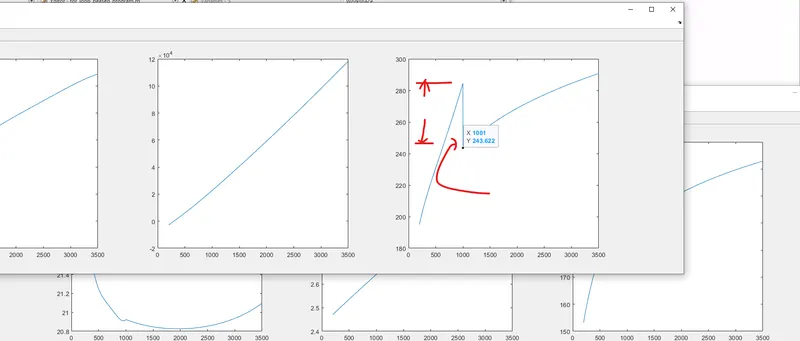
In above error : Is gaps occurring on every plot of (Entropy vs temp.)... Then later I found some typing mistakes in the equation.
*(some of the errors shown above may be different from current matlab code because those errors happen at the initial level of writing a code, then later I made some changes in code to reduce no. of line & optimize the code.)*
6. CONCLUSION:
By this project, I learned how 'the file parsing' concept/method/technique to be applied in Matlab and how to generate a meaningful output. Also I learn how to write files to store data. So by this project I can say file-parsing is a time saver tehnic when the data is available in large volume.
- REFERENCES / literature / online material :