Week - 4
AIM:
MODEL_1:WASHING_MACINE
Implement control logic of a “washing machine” using Stateflow as per given sequence:
- If the power supply is available, the system gets activated
- If the Water supply is not available, stop the process & indicate through LED
- Soaking time should be 200s followed by Washing time of 100s.
- Then rinsing happens for the next 20s & dryer runs for 50s
After all the processes have completed turn on the finished LED
MODEL_2:GEAR_SHIFTER
Make a Simulink chart for the “Gear shift” logic as per below conditions:
Speed Range(kmph) Gear
0 to 15 1
16 to 25 2
26 to 40 3
41 to 60 4
Above 61 5
Give speed input while the simulation is running & display the gear number.
MODEL_1: WASHING MACHINE
STATEFLOW:
Stateflow provides a graphical language that includes state transition diagrams, flow charts, state transition tables, and truth tables. We can use Stateflow to describe how MATLAB algorithms and Simulink models react to input signals, events, and time-based conditions. Stateflow enables us to design and develop supervisory control, task scheduling, fault management, communication protocols, user interfaces, and hybrid systems.
With Stateflow, Our model combinatorial and sequential decision logic that can be simulated as a block within a Simulink model or executed as an object in MATLAB. Graphical animation enables you to analyze and debug your logic while it is executing. Edit-time and run-time checks ensure design consistency and completeness before implementation.
Washing Machine Model:
NOTE: simulation time is taken as 420 sec instead of 370 sec process time because the individual state calculation takes time but the individual process time is the same as instructed.
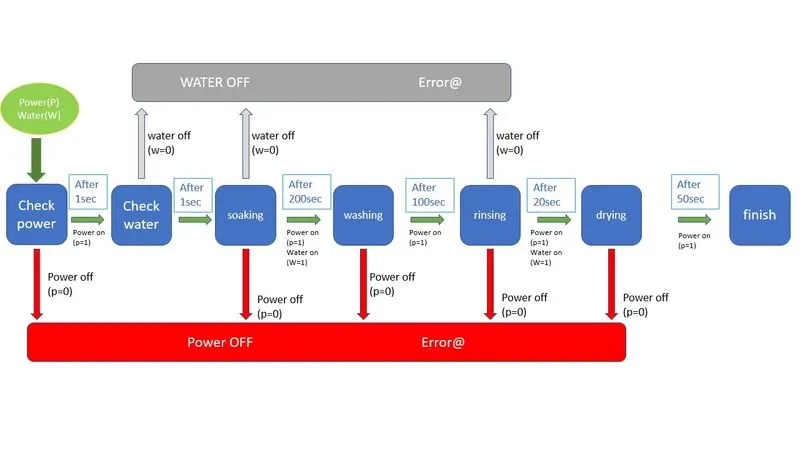
We are using a Stateflow chart to validate our condition and run the process as per the below condition:
- If the power supply is available, the system gets activated
- If the Water supply is not available, stop the process & indicate through LED
- Soaking time should be 200s followed by Washing time of 100s.
- Then rinsing happens for the next 20s & dryer runs for 50s
To start the process through our chart we will:
- Check for the power supply if it's on process starts.
- If the power is off at any stage it will throw an error.
- At the next step, we will check for the water supply if it is on then the washing process is initiated.
- Water supply is checked at soaking and rinsing process too if its not available at that time it will throw an error.
- The soaking process is initiated if the above conditions and run for 200 sec.
- After soaking washing, rinsing, and drying process is run for 100, 20, & 50 sec.
- After the drying process is done our washing machine process is completed.
 |
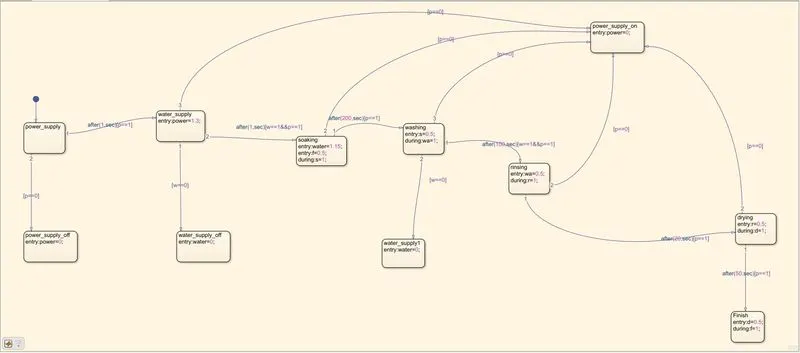
Stateflow chart values.
- when we enter the water supply condition power is given a value of 1.3 as it passes the condition. (1.3 to make it visibly different from water value)
- when we enter the soaking condition water is given a value of 1.15 as it passes the condition. (1.15 to make it visibly different from power value )
- for each state, different state variables are assigned a value of
- 0.5 at the entry for the completion of the previous state
- 1 during the execution of the current state.
- at the starting of the soaking process finish state variable f is assigned a value of 0.5 to indicate an incomplete process if an error occurs in between.
- If power is off the variable power is assigned a value of 0 to show an error.
- If water is off at any point during the soaking and rinsing process water variable is assigned a value of 0 to show an error.
|
Stateflow chart (Washing_machine_process) |
|
Simulink_Model (Washing Machine) |
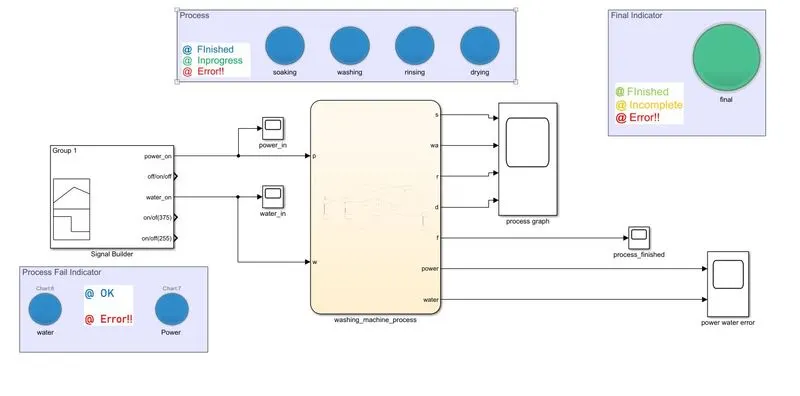
Simulink Model: Washing Machine
- Signal Builder is used for creating different signals of water supply and power supply for 420 sec to simulate our model
- The Stateflow chart has two input signals and seven output signals for power and water input and output of different washing processes.
- the lamp is used to visually indicate the process status and errors in the system.
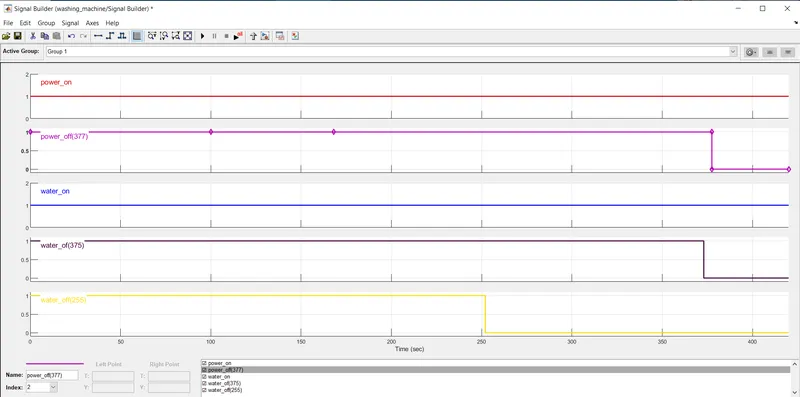
Signal Builder:
signal 1: power on for 420-sec
signal 2:power of at 377 sec: to check for power cut-off in between
signal 3: water on for 420-sec
signal 4: water is off at 375 sec: to check the condition after the rinsing process
signal 5: water if off at 255 sec: to check during the rinsing process
Lamp connection:
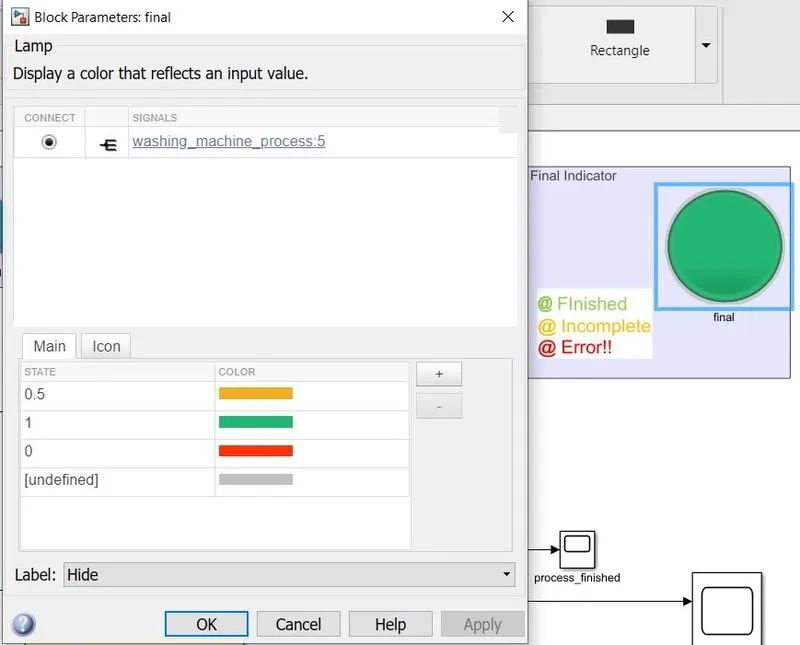 |
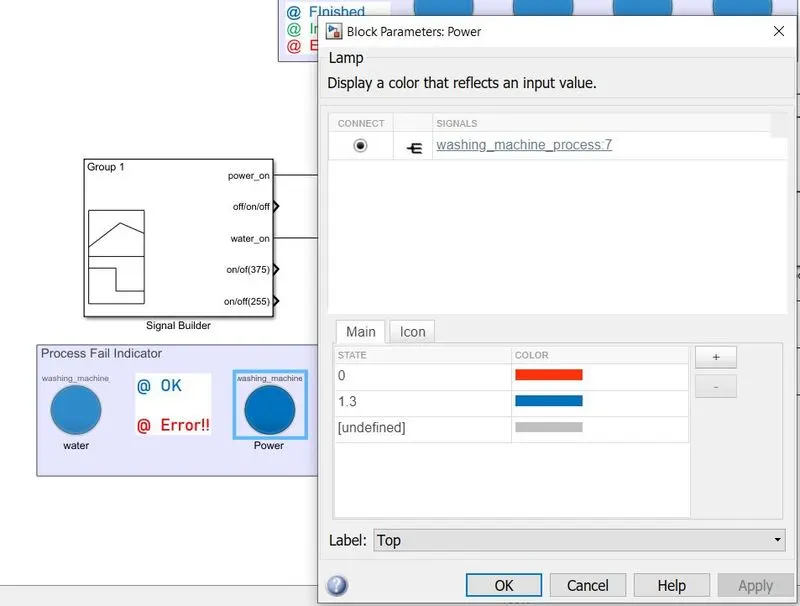 |
| Final lamp connected to the output ('f') | Error lamp is connected to the power and water output |
Results:
Case_1: water and power is on for 420 sec
when we keep the power and water available for the whole process.
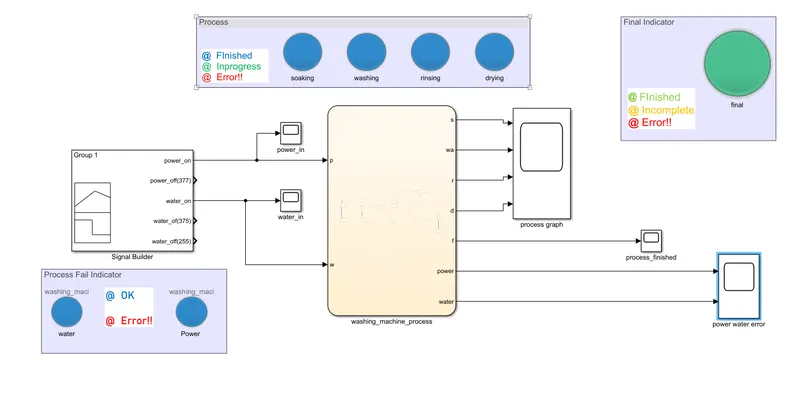 |
Main visual results for the simulation no error is shown all the process is complete final indicator shows finish signal |
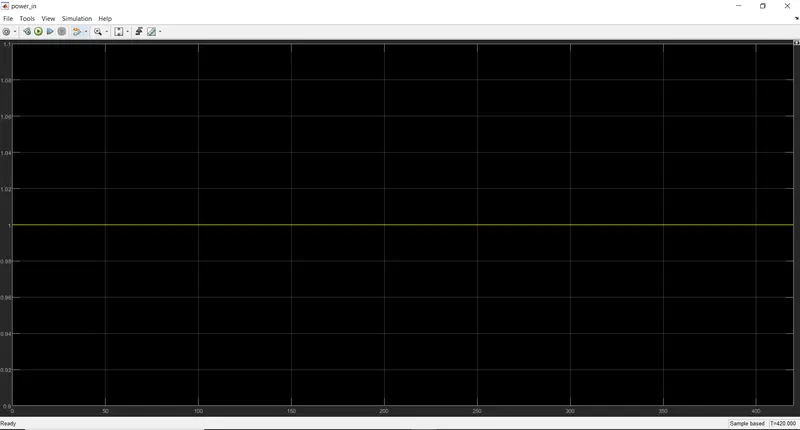 |
the power input signal on for 420 sec |
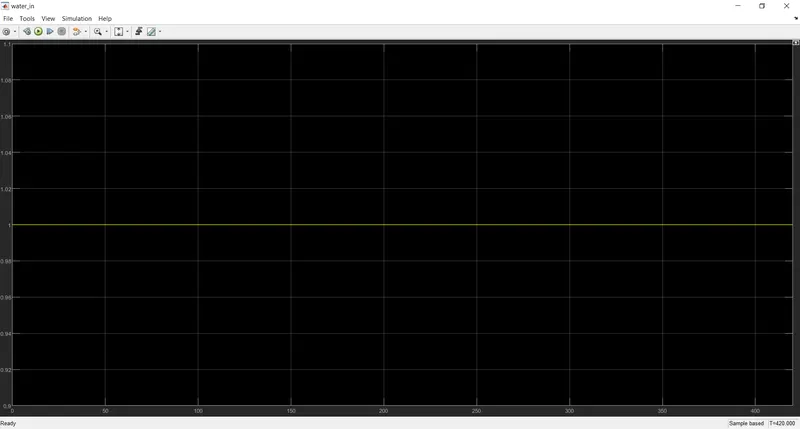 |
the water input signal on for 420 sec |
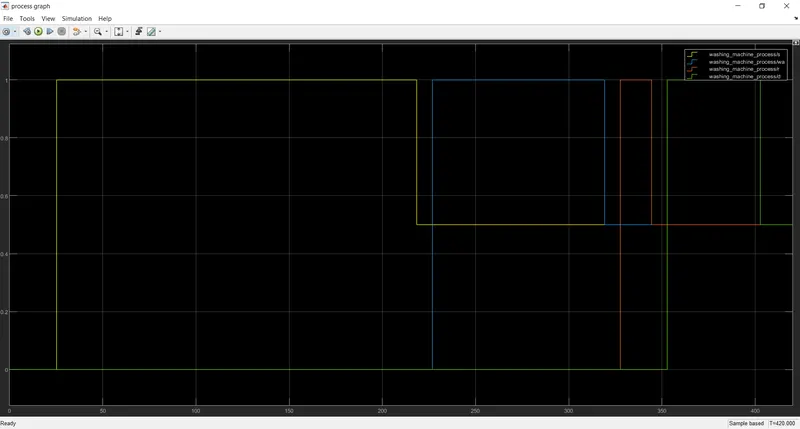 |
different process signals : shows 1 during the process o.5 after their completion we can see the delay in the process because of state calculations during the execution of the state. if we don't use them during command it won't happen but we want to show it. the process runs for the time instructed in the question. |
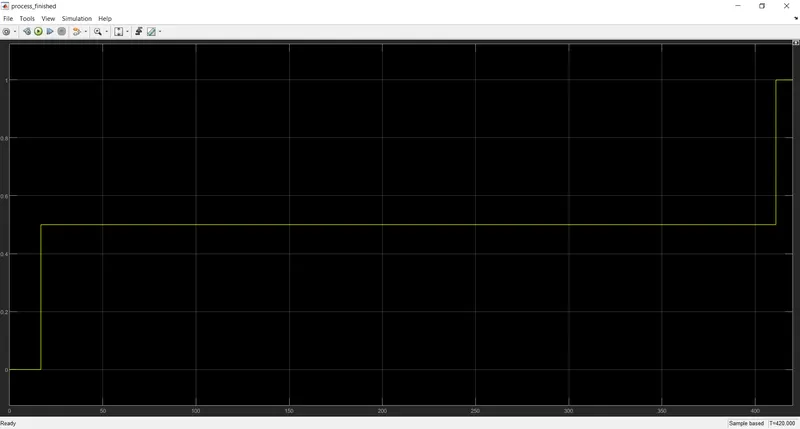 |
final variable (f) value is 0.5 when the process starts value is 1 when all processes are finished |
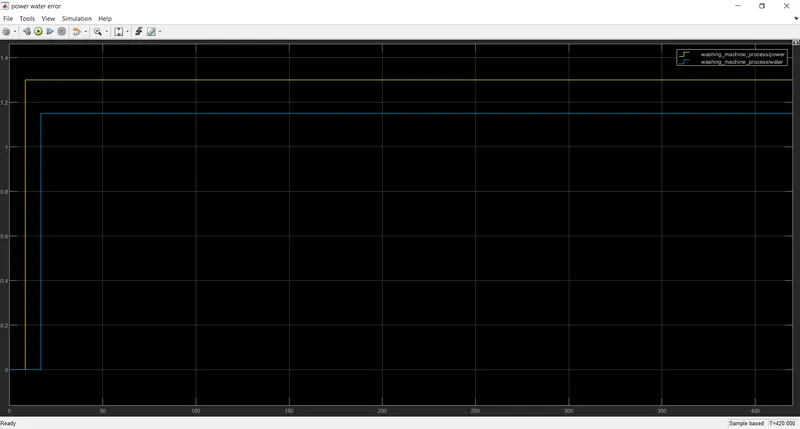 |
availability of power and water 1.3 for power 1.15 for water |
Case_2:
power is available for 377sec
water is available for 420 sec
incomplete process
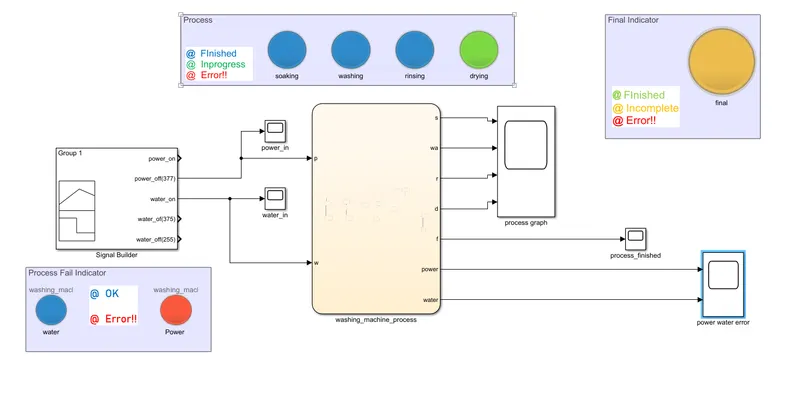 |
final indicator: incomplete process: drying in-process error: power error |
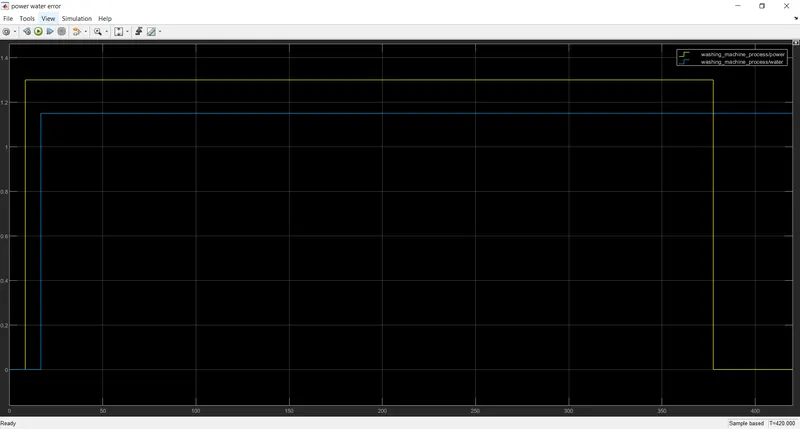 |
power graph shows 0 at 377 as it shows error. |
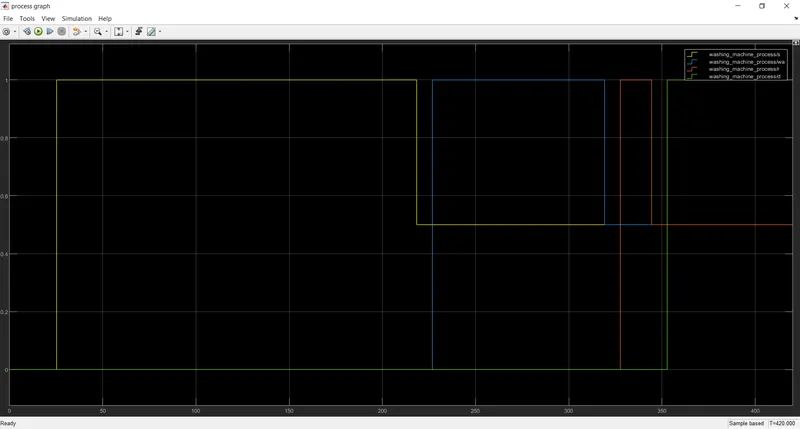 |
the drying process is in progress it's not completed as it needs to come back to 0.5. |
Case_3:
power is on for 420 sec
water cuts off at 375 sec that is after the rinsing process.
process complete.
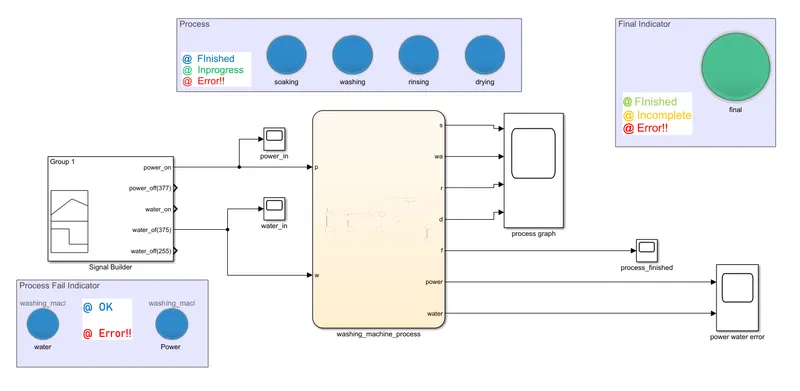 |
final indicator: finished process: all processes finished error: no error |
| |
power and water both show no error as the water is off during processes in which water is not required. |
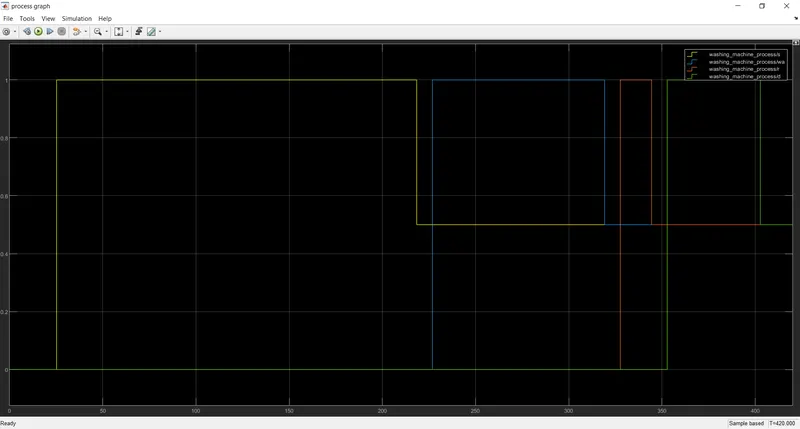 |
we can see all the processes are finished as they attain a 0.5 value. |
Case_4:
power is on for 420-sec
water is cut off at 255 sec that is during the rinsing process.
process incomplete as water cuts off during the rinsing process.
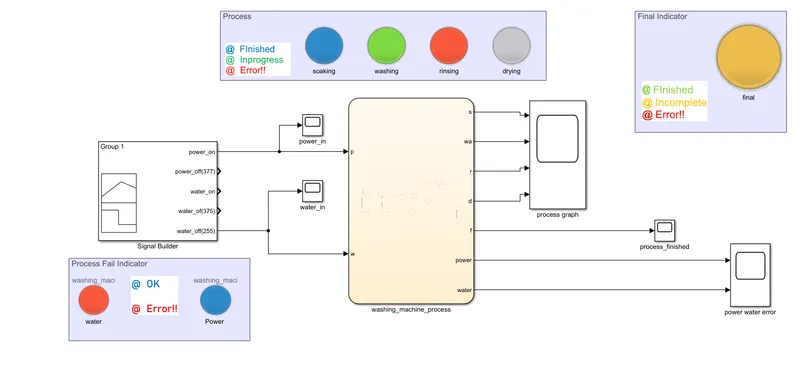 |
final indicator: incomplete process: washing in-process and error in the rinsing process error: water error |
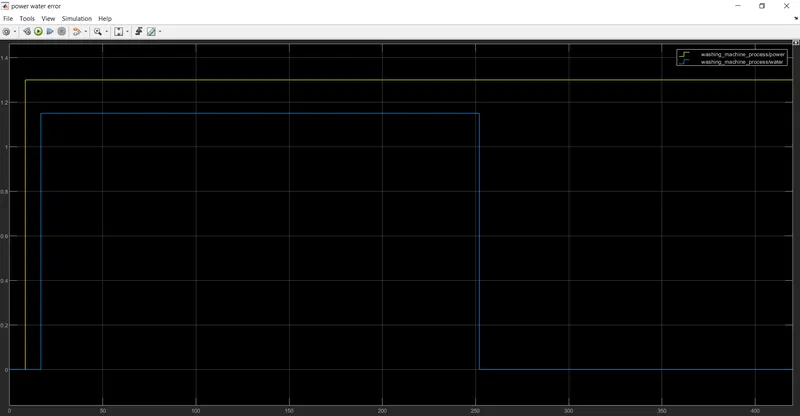 |
water comes down to 0 value at 255 sec. shows error |
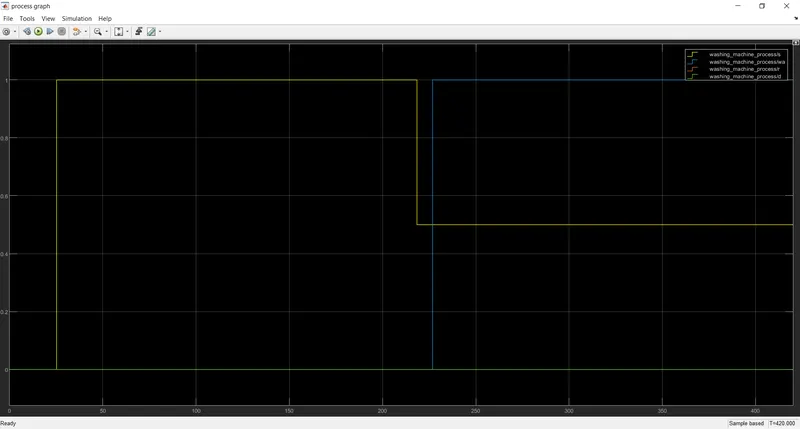 |
as the rinsing process show error it could not be executed to non-availability of water. the washing process could not finish as rinsing cant start. |
From the above result, we can conclude that our model works fine with complaining to the condition of the different processes.
MODEL_2:GEAR_SHIFTER
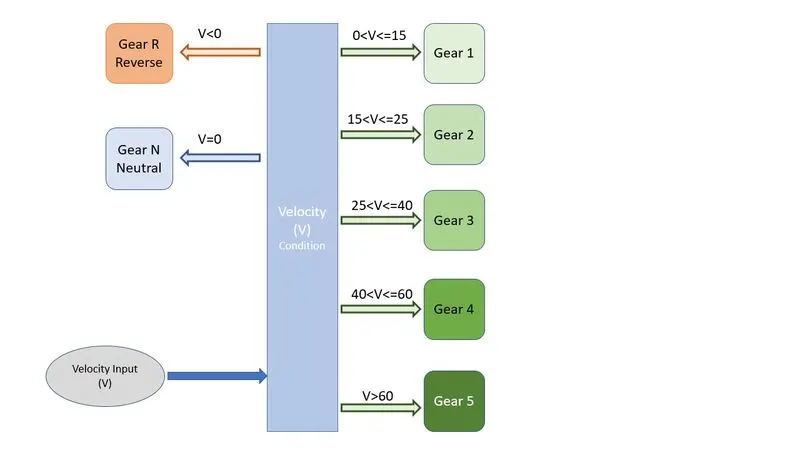
We are using a Stateflow chart to validate our condition and run the process as per the below condition:
Speed Range(kmph) Gear
0< R
0 N
1 to 15 1
16 to 25 2
26 to 40 3
41 to 60 4
Above 61 5
To get the model for the above model we need to check for the speed input and according to the condition we need to put the desired gear value.
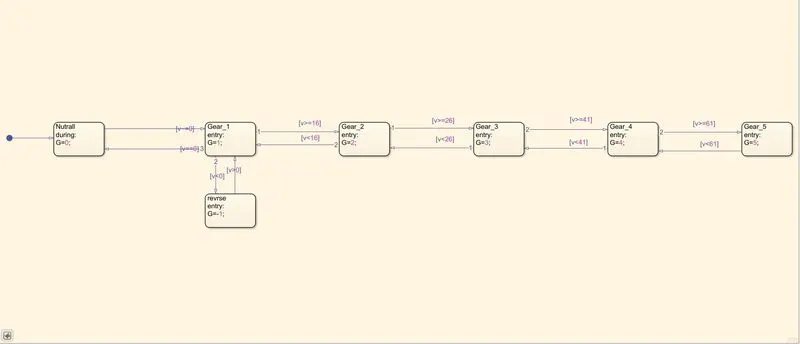
Stateflow chart
we have the input speed value for our simulation
7 states for 7 gears gear1, gear2, gear3, gear4, gear5, reverse gear & neutral are created.
for different gear values of G changes.
- Gear R G=-1
- Gear N G=0
- Gear 1 G=1
- Gear 2 G=2
- Gear 3 G=3
- Gear 4 G=4
- Gear 5 G=5
for changing gear the connection is made vice-versa so that they can change according to the velocity condition.
if the velocity value fits for the states it gets the gear value of that state.
if the velocity doesn't fit that state then according to the conditions the gear changes.
 |
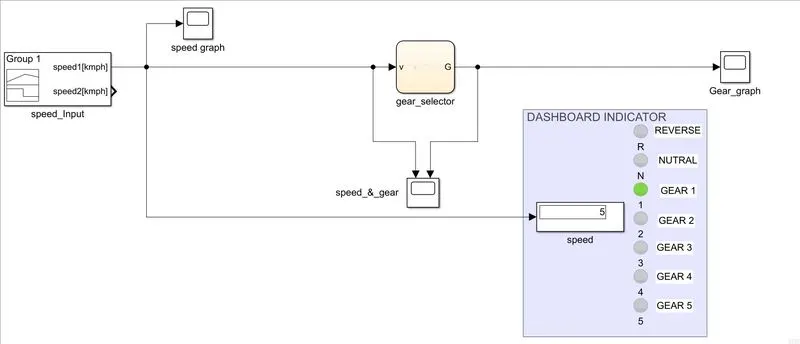 |
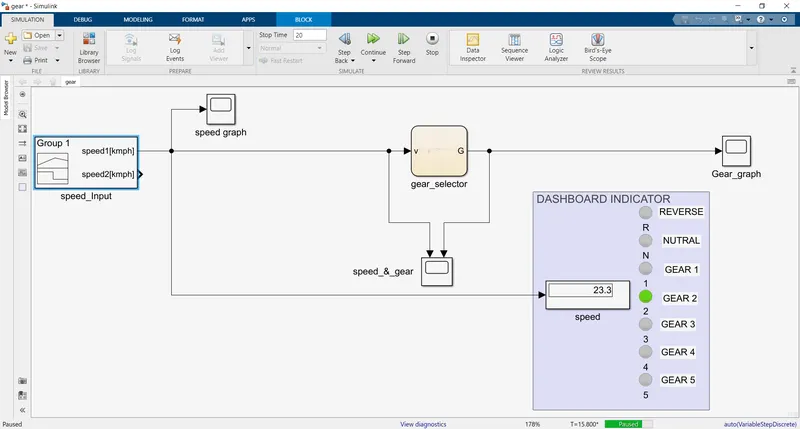
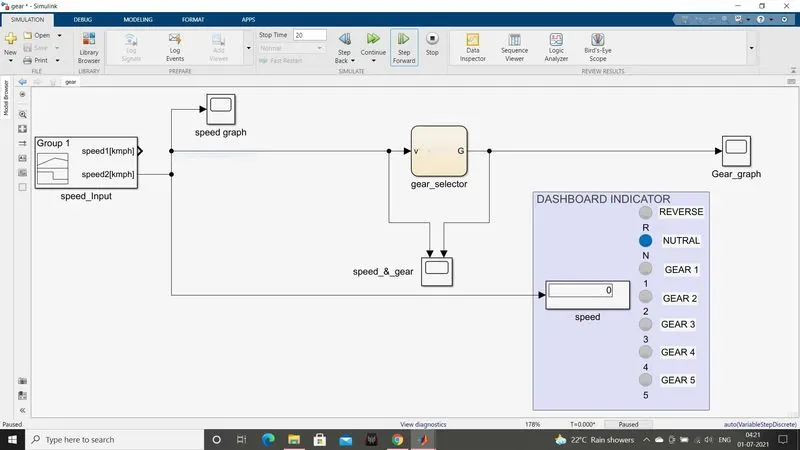
- signal builder is used for creating two different velocity signals to check our model it is then connected to a scope gear_selector chart and a display.
- the gear selector has one input for the speed and one output for the corresponding gear.
- then the output from the gear_selector chart is connected to scope
- also to compare the velocity and gear together velocity signal and gear signal are connected to a scope.
Signal Builder
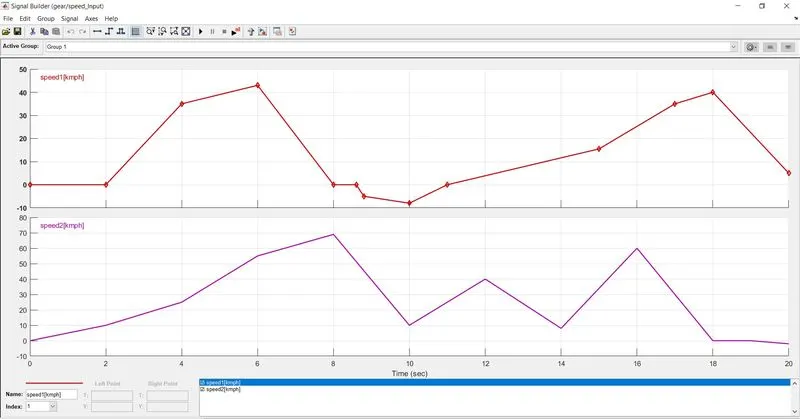 |
Lamp connection:
for different gear lamps, the values are set corresponding to the value of G.
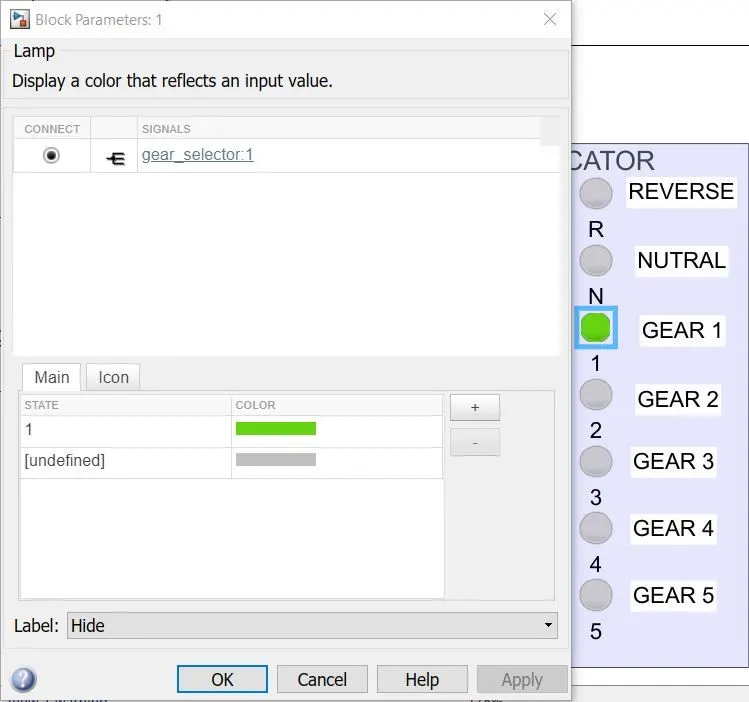 |
RESULTS
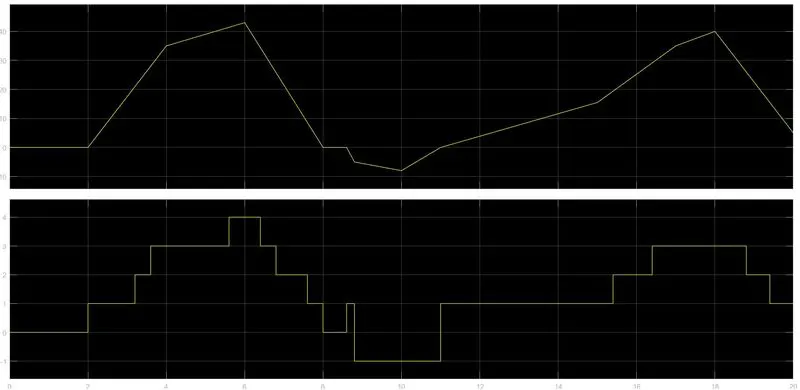 |
| speed_1 input and output value |
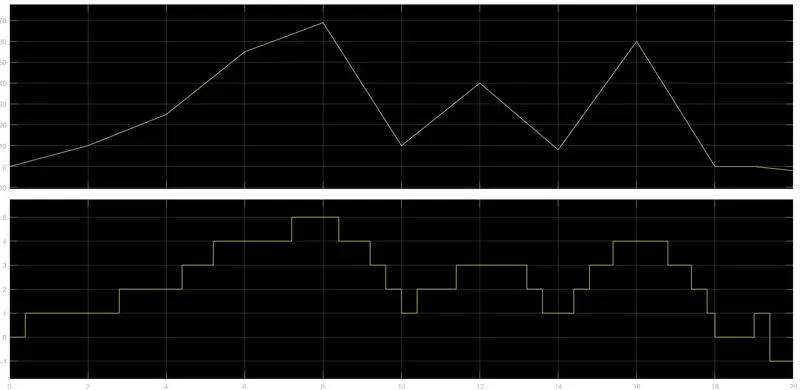 |
| speed_2 input and output value |
Gear_Display
speed_1 output.
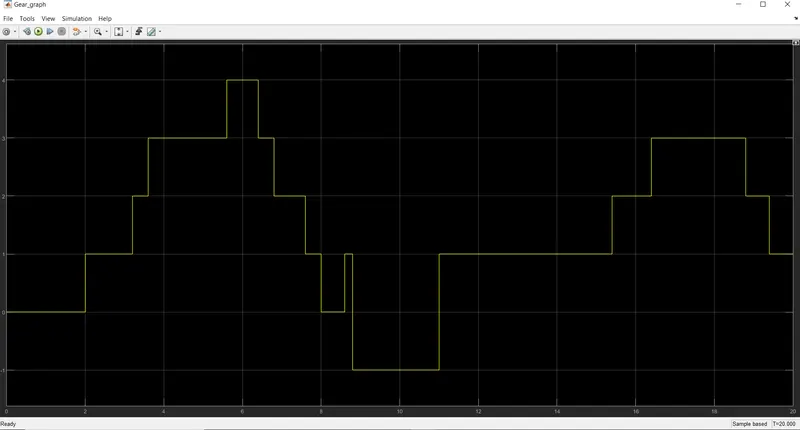 |
| gear Graph of 1st Speed (chart output signal 1) |
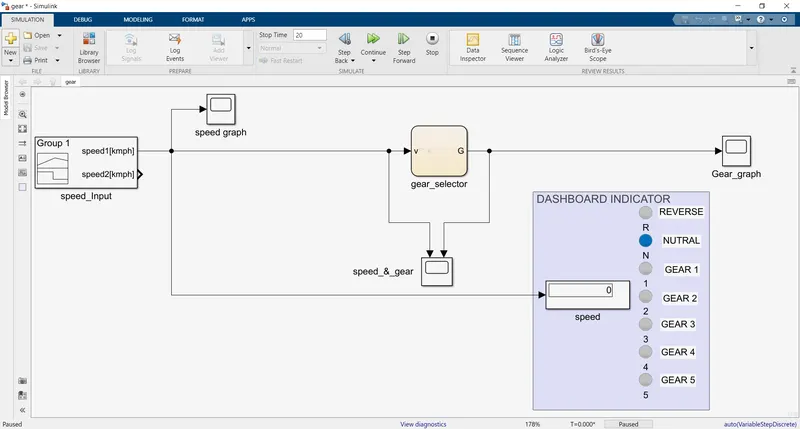 |
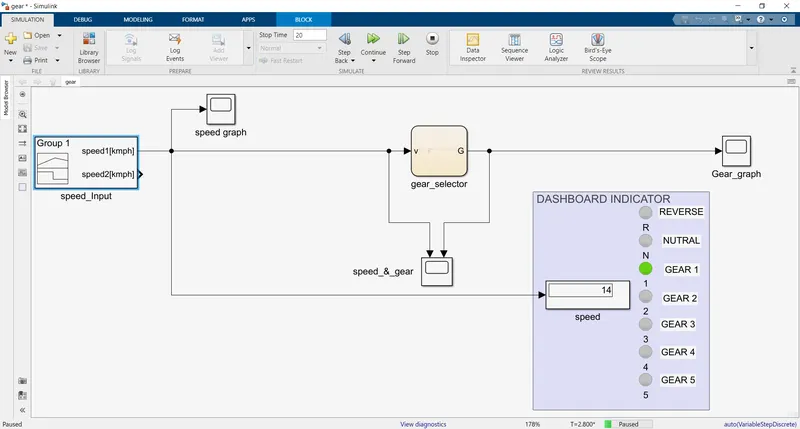 |
| Time=0 sec | Time=2.8 sec |
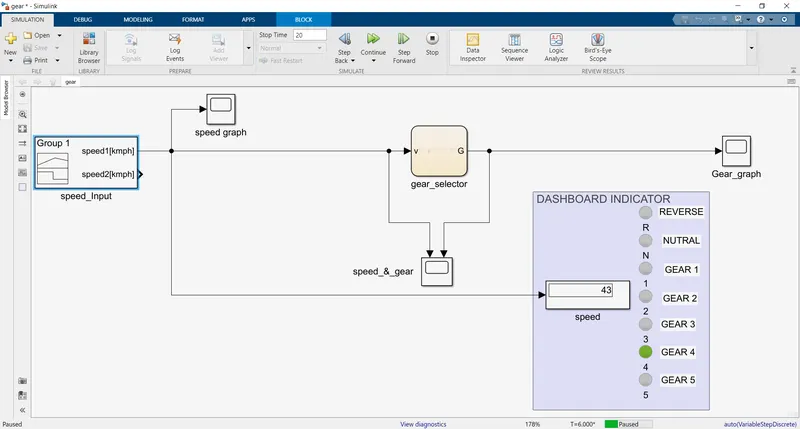 |
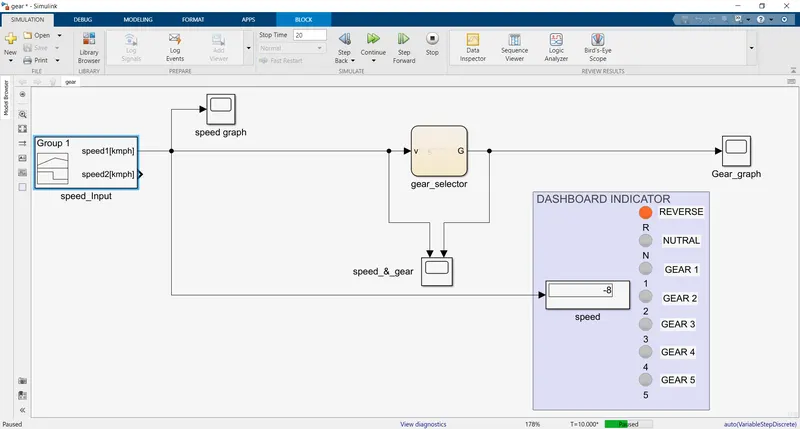 |
| Time=6 sec | Time=10 sec |
 |
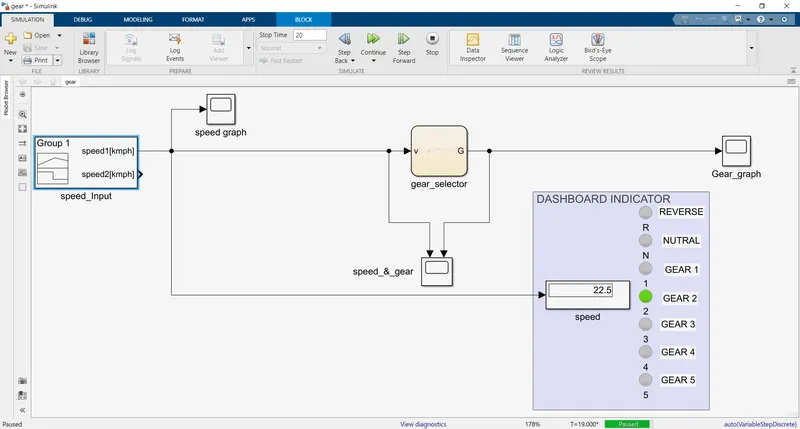 |
| Time=15.8 sec | Time=19 sec |
speed_2 output.
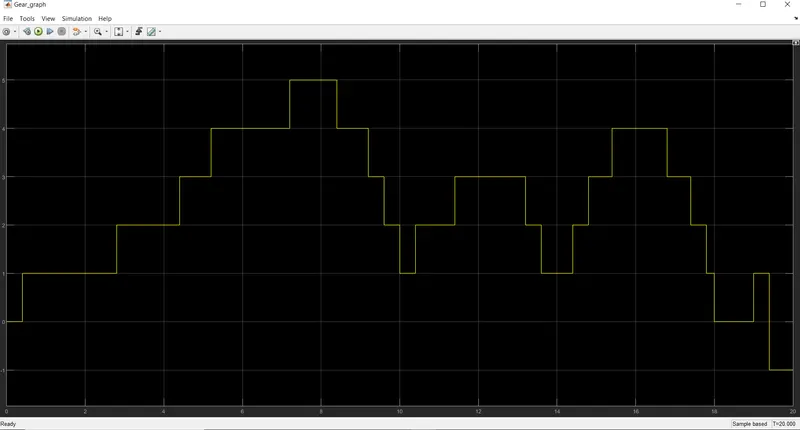 |
| Gear Graph of 2nd Speed (chart output signal 2) |
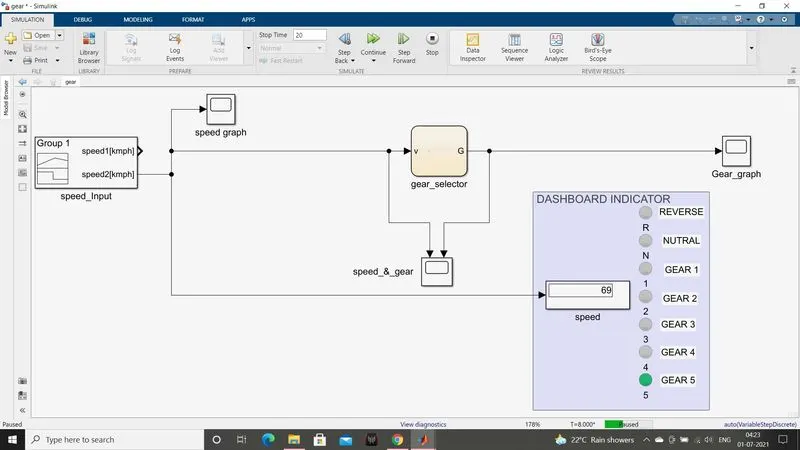
 |
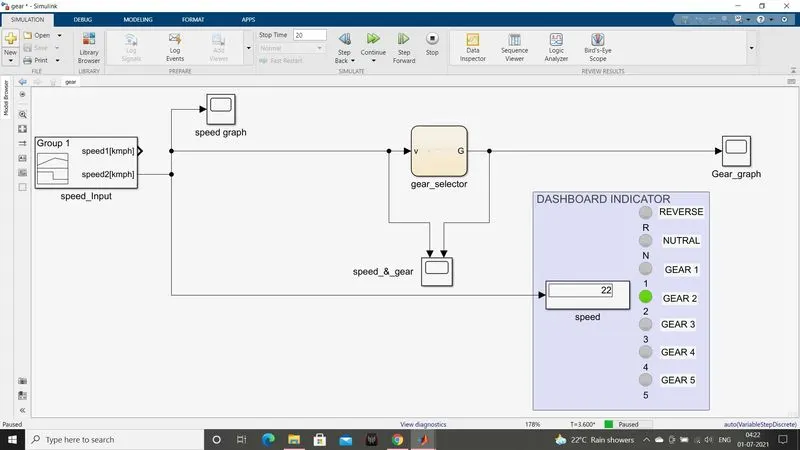 |
| Time=0 sec | Time=3.6 sec |
 |
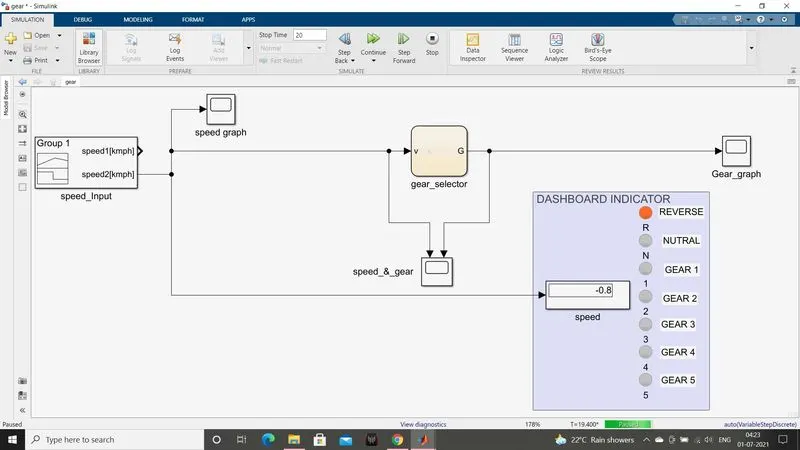 |
| Time=8 sec | Time=19.4 sec |
Form the above results we can conclude that our model is working fine as it shows the correct gear for the corresponding speed as per condition.