Week 4.2: Project Transient simulation of flow over a throttle body
Aim
- Setup a transient simulation
- Post process the results and show pressure and velocity contours.
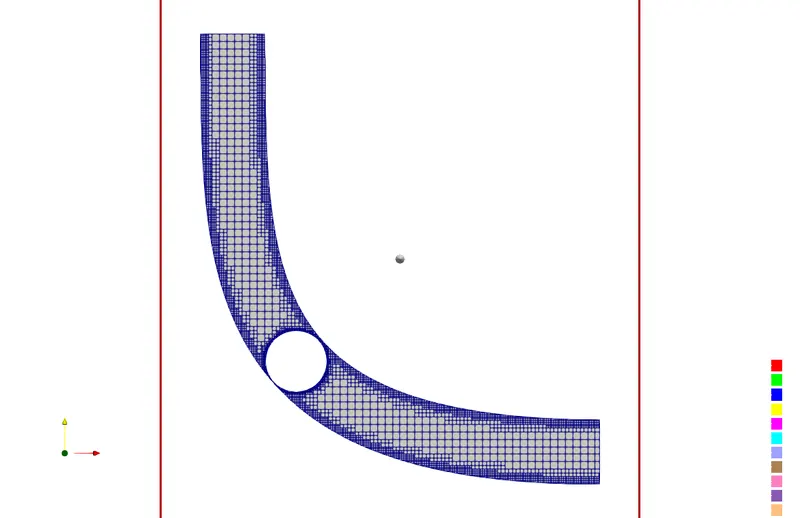
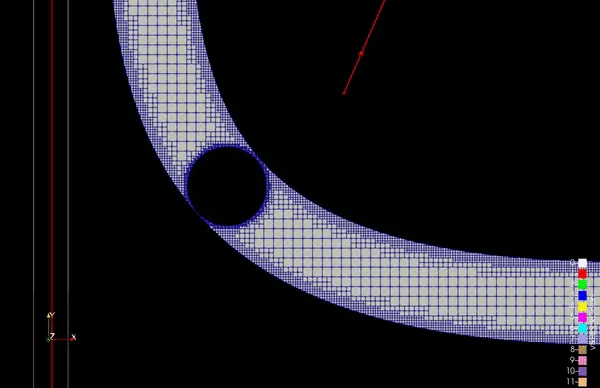
- Show the mesh (i.e surface with edges)
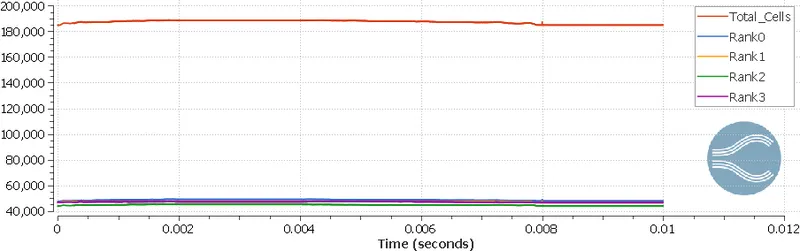
- Show the plots for pressure, velocity, mass flow rate and total cell count.
- Also show the calculations on how you calculated an end time for the simulation.
- Create an animation in which it throttle movement should be visible.
Introduction
Since we are doing the flow over a throttle body it is better to use a transient case for running the simultaion since the simulation involves the rotation of throttle valve to control the mass flow rate. Hence we can have more information on the mass flow rate at different time
Setup
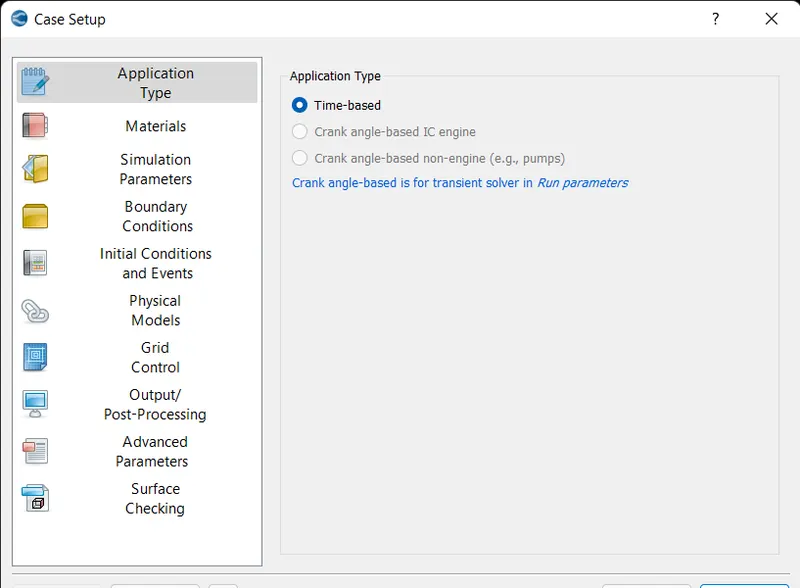
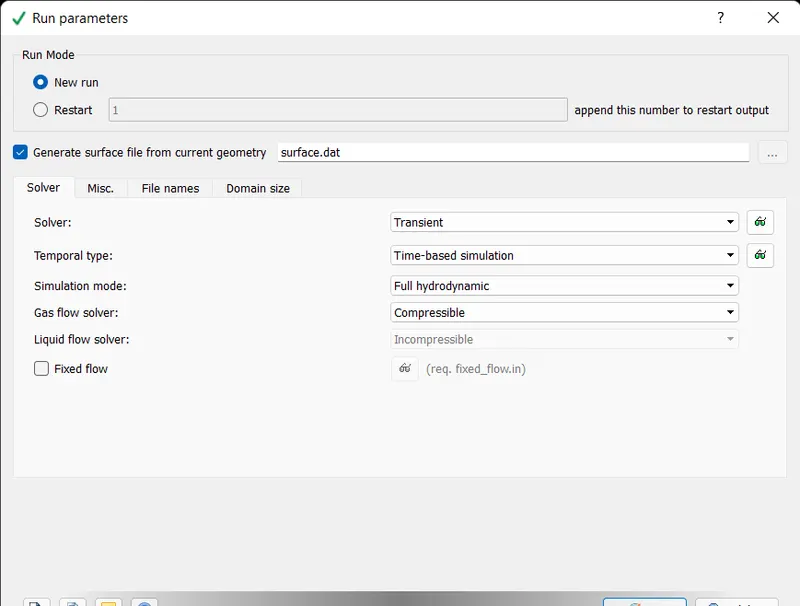
- Time based simulation is set
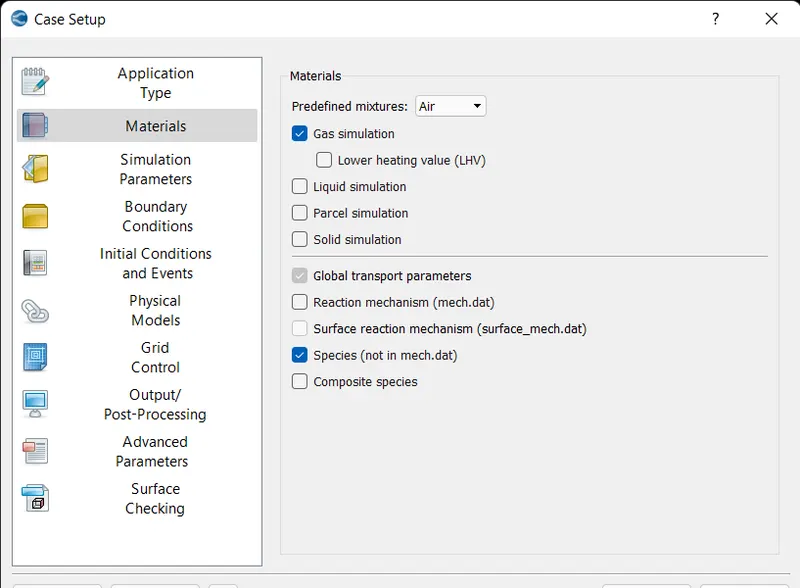
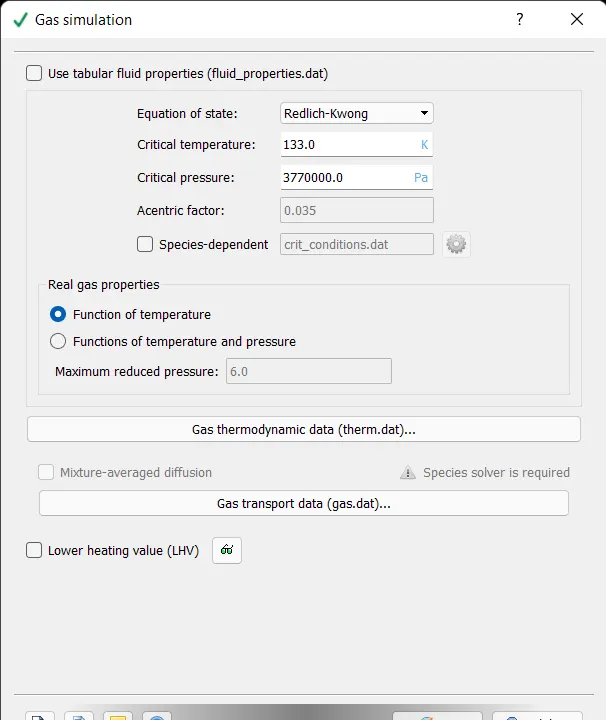
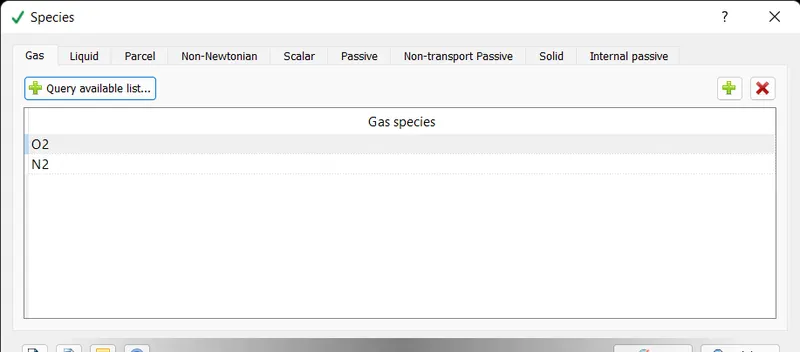
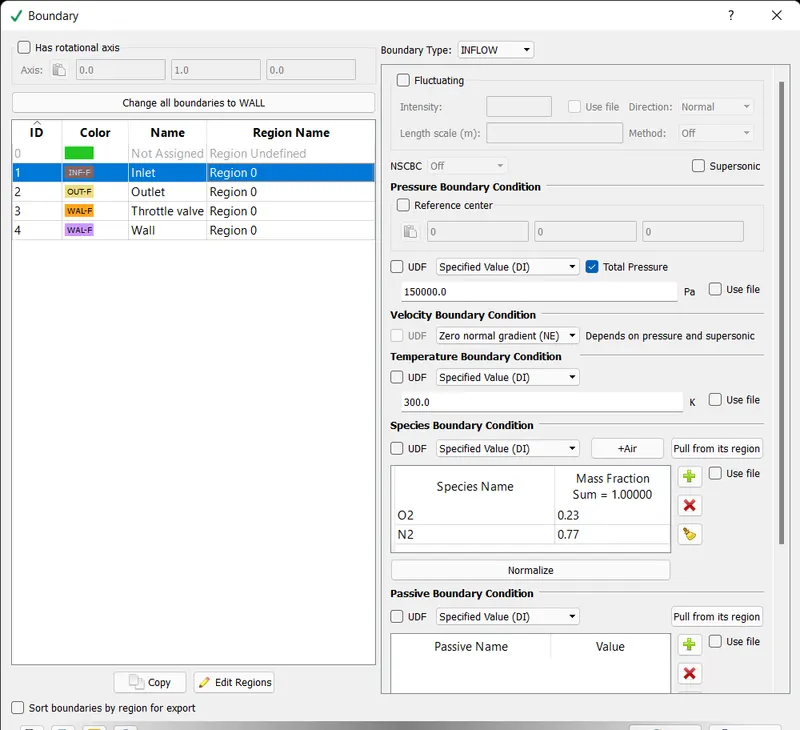
- Material is set to air contains 0.77 of nitrogen and 0.23 of oxygen also species involvemnt is also enabled
- species are added accordingly
- In run parameters enregy involvement is disabled as we dont want temperature analysis
- Steady state monitor is turned off
- A transient simulation was enabled in Run parametres
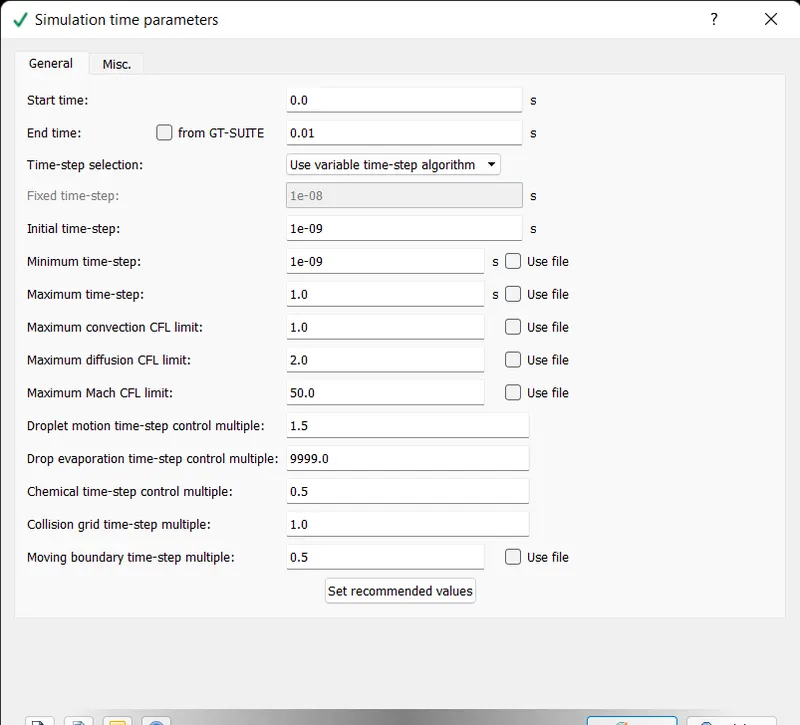
- Under Simulation run parametres the str time and end time was set to 0 to 0.01 and the initial and minimum time step 1e-9 and the amximum times tep is set to 1
End time calcualtion
Flow through time = Charactaristic length / Average velocity
Charactarisitc length = 0.2 (from the geometry)
Average velocity = 200 m/s (from steady state analysis)
So flow through time = 0.2/200= 0.001
Hence we can assign the value for end time as 0.01 as this will allow the flow to happen 10 times
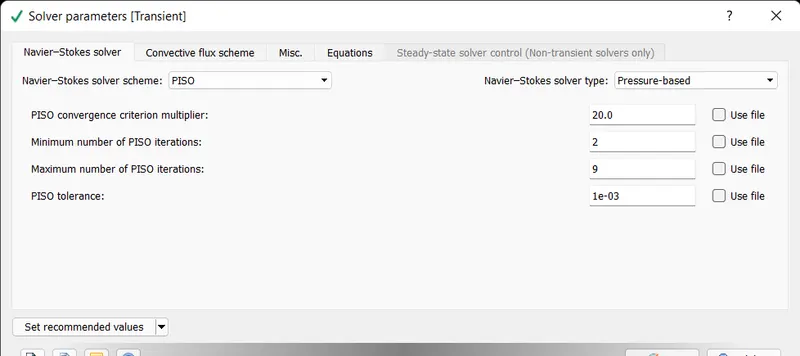
- Under solver paramteres, A pressure based simulation was enabled
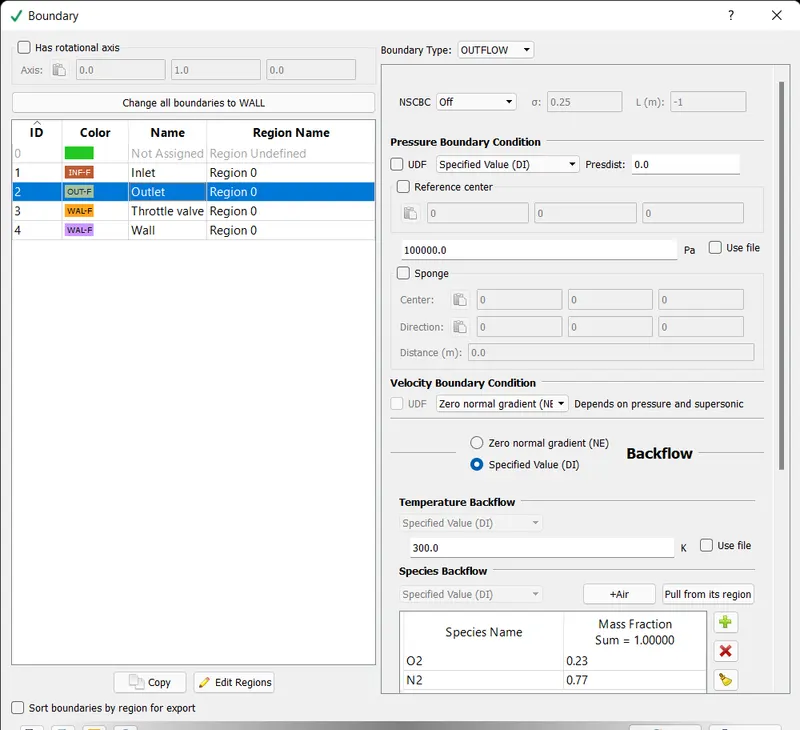
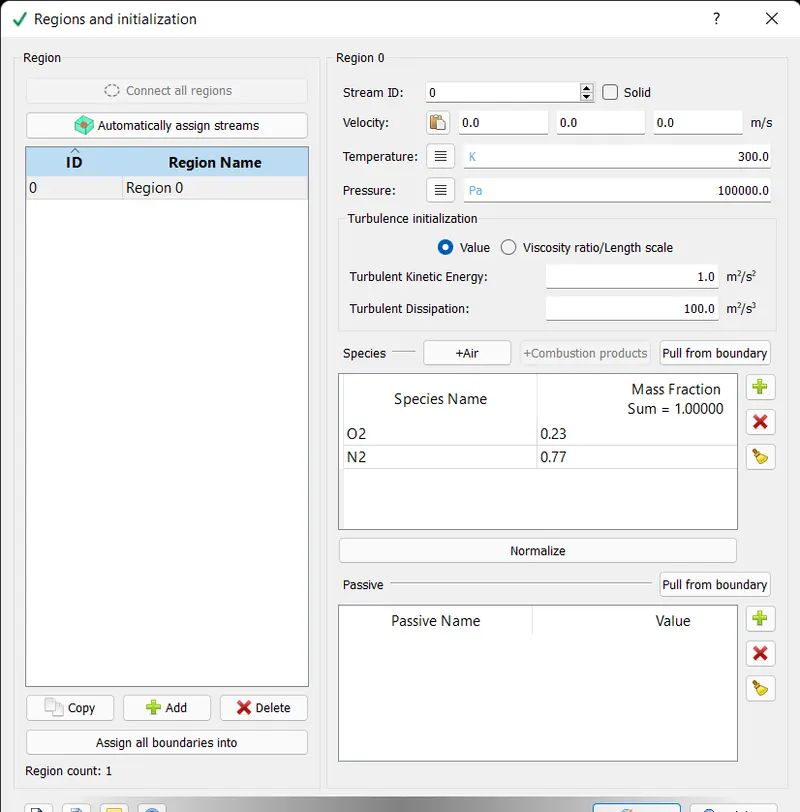
- A new region containing air is created in 'region and initialisation' and the initial pressure is set to 1e5 pa
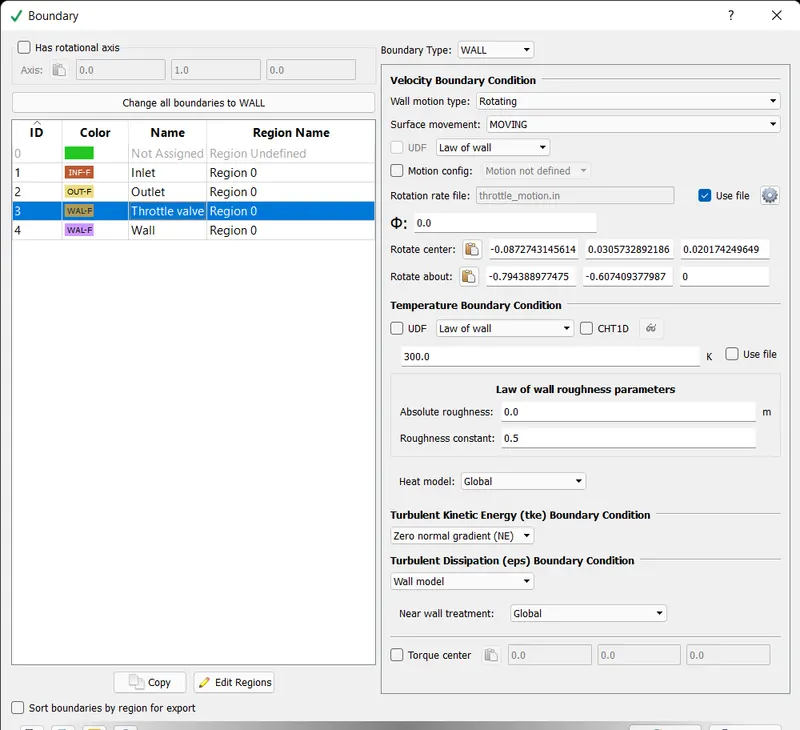
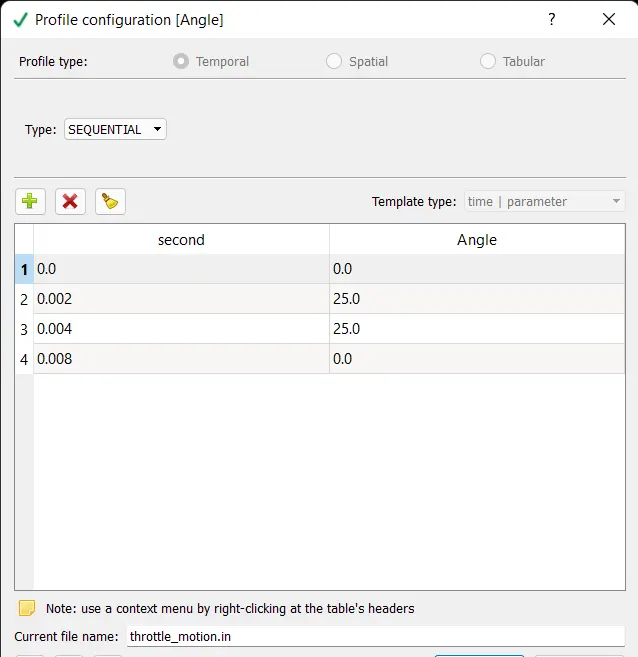
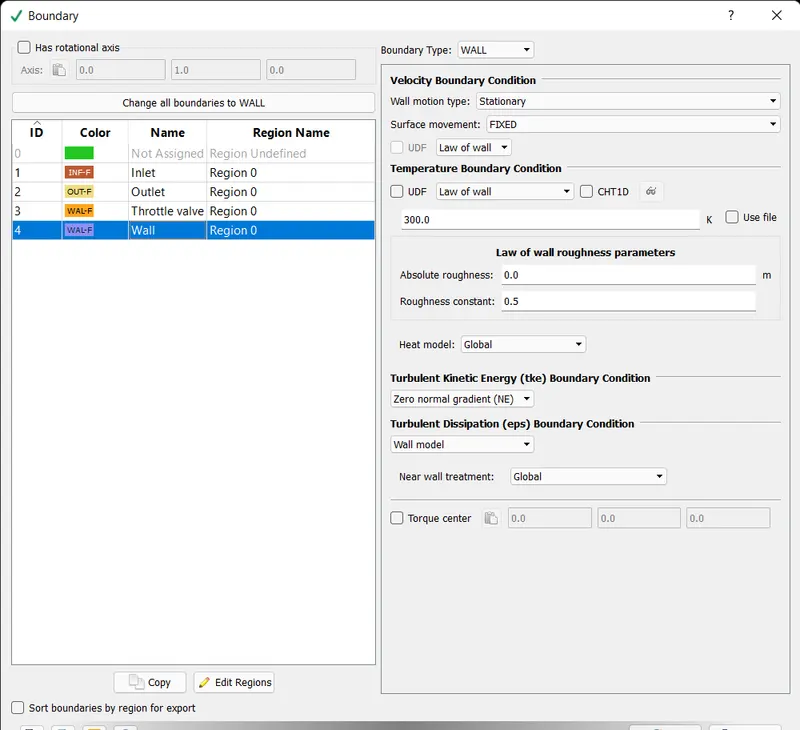
- Boundary conditions are set and shown the screen shots also rotating wall was enabled for throttle valve, the axis of rotation and the center of the rotation was also obatined using measure> Arc normals ,and these values were given to the bounder conditions of the throttle valve
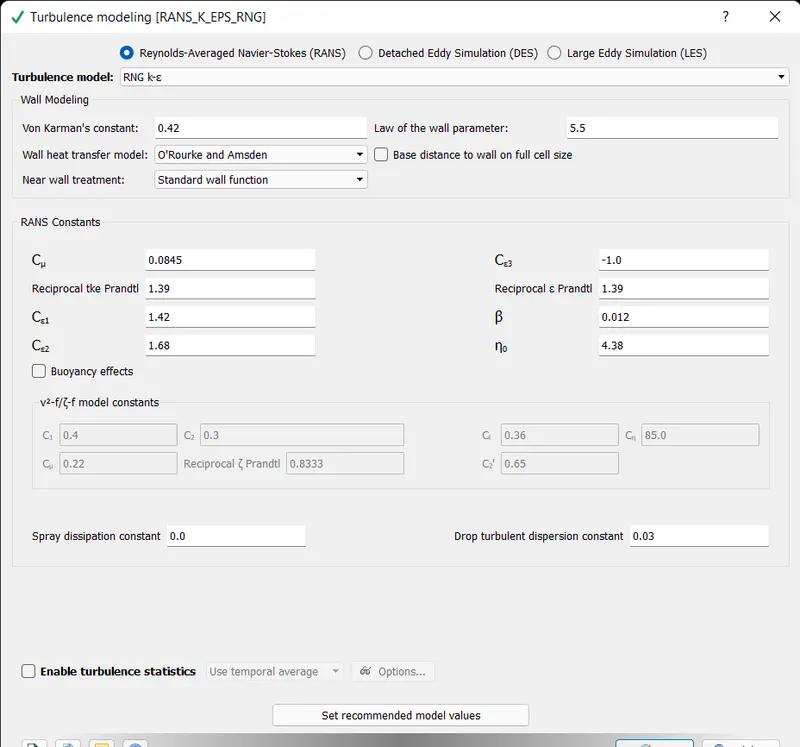
- RANS model is selected under turbulance model
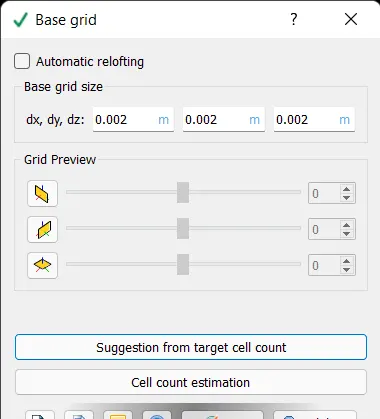
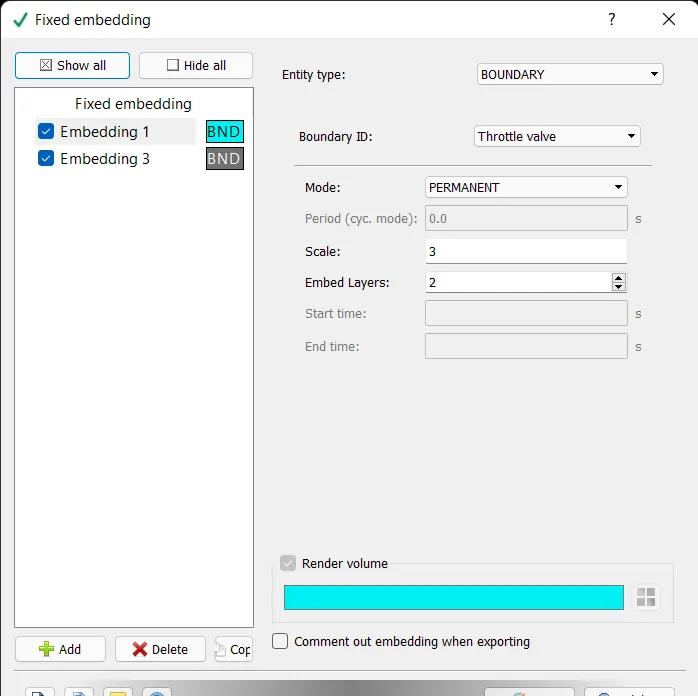
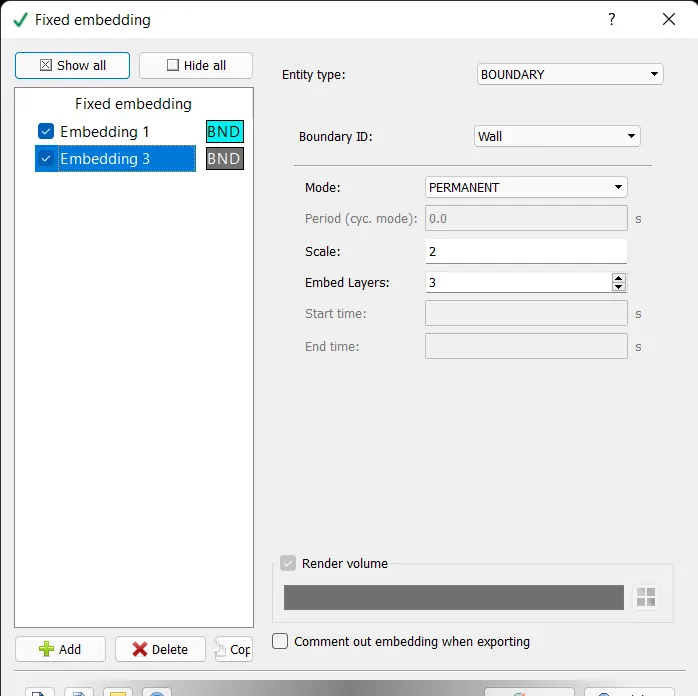
- In grid control fixed embedding is enabled and under fixed embedding scale is set to 3 and the number of layers with 2 on the throttle boundary and for the wall boundary a scale of 2 and layer of 3 was given
- Finally normals were checked and ensured that they were pointing inside of the geometry
Outputs
Plots
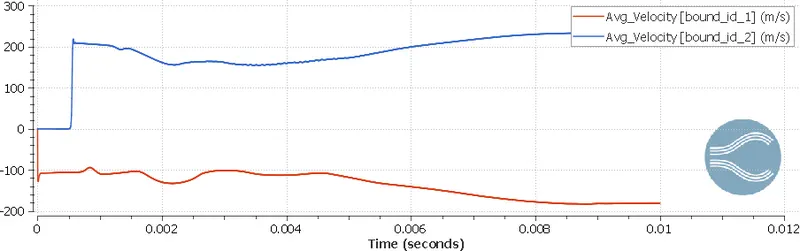
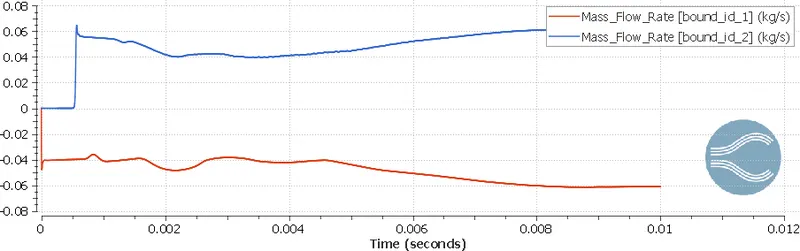
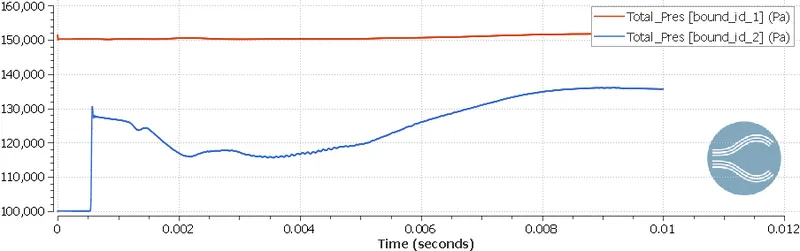
Id 1 = Inlet
Id 2 = Outlet
Mesh
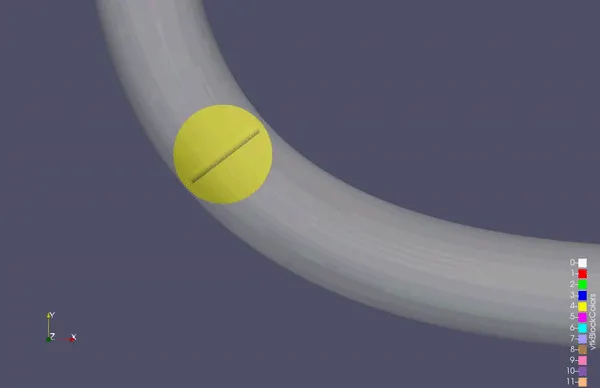
Throttle movement
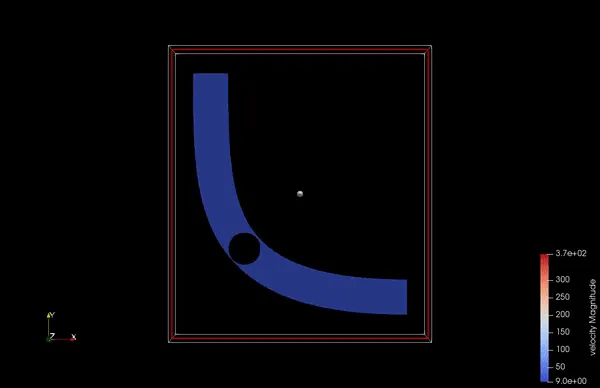
Velocity contour
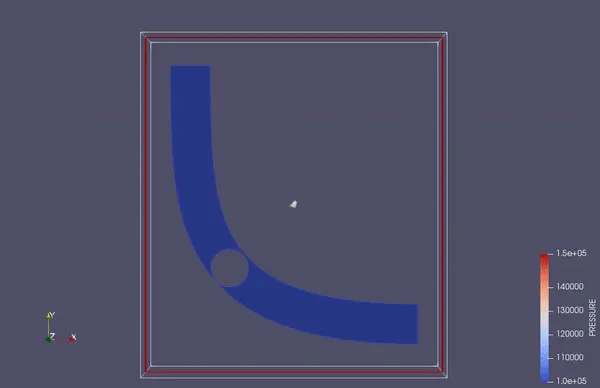
Pressure contour
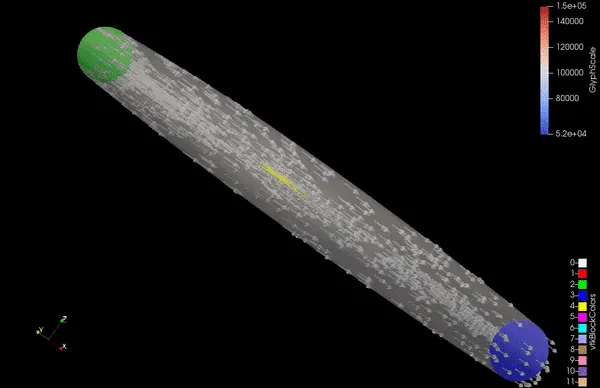
Vector animation
Observations
- As expected the mass flow rate and average velocity reduces when the throtlle restricts the flow hence the pressure at the inlet side becomes more as the throttle closes the flow
- Looking at the plots the mass flow rate and average velocity are more at the first few seconds and last few seconds , by observing the throttle movement we can conclude that at the initial position of the throttle the mass flow rate and average velocities are higher since the throttle does not restrict the flow
Conclusions
- A transient simulation of flow over the throttle is done
- Visualised the the throttle movement and the variation of pressure and velocity
- A vector contour was also obtained
- Aniamtions of throttle movement, Velocity contours and pressure contours was also obtained