Week 4.2: Project Transient simulation of flow over a throttle body
Project Transient simulation of flow over a throttle body-
Objective-
- Show the mesh (i.e surface with edges)
- Post process the results and show pressure and velocity contours.
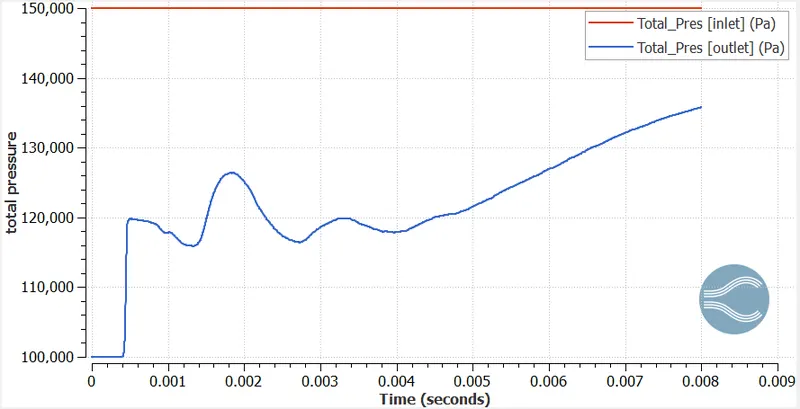
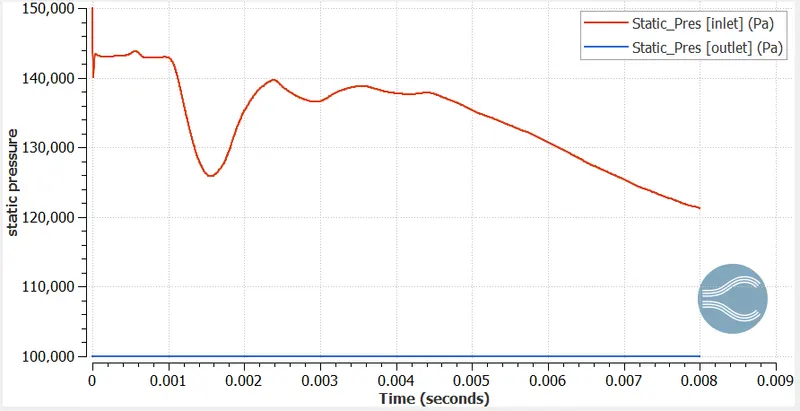
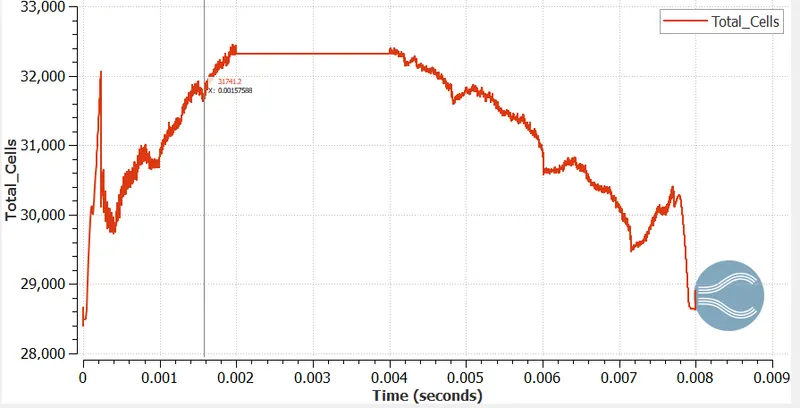
- Show the plots for pressure, velocity, mass flow rate and total cell count.
- show the calculations on how you calculated an end time for the simulation.
Elbow Throttle-
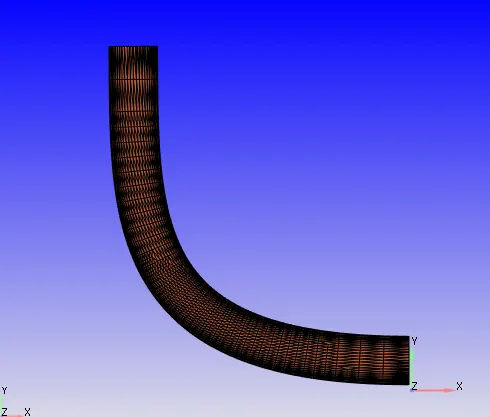
Throttle position view in paraview
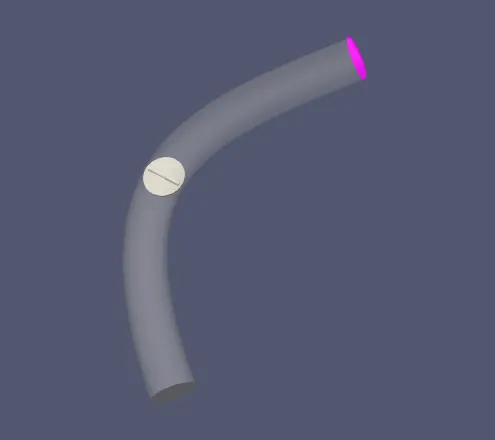
Grid
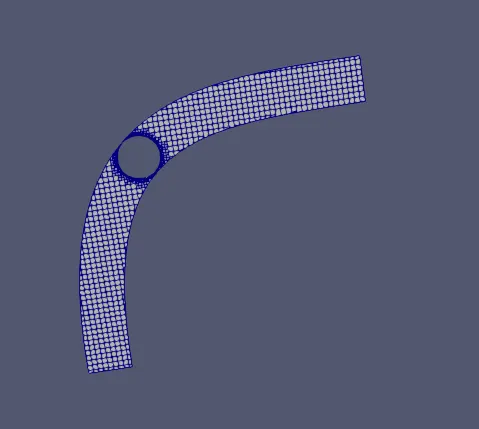
Grid size - 0.004 and fixed embedding of scale 3 is used around throttle
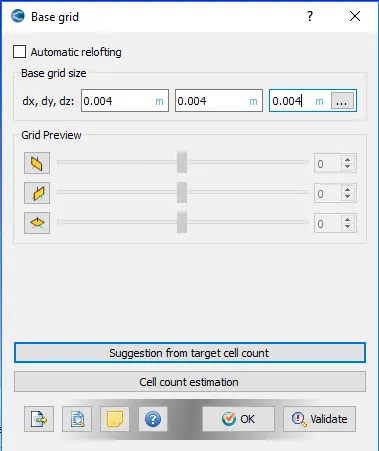
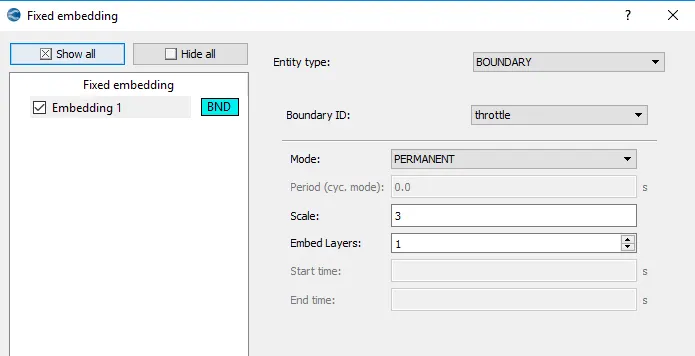
Fixed embedding - fixed embedding is technique used to create more no grids around curved surfaces or where required.
In fixed scale value determines density of grid required at throttle boundary, if scale is 1 which means mesh would be two times more dense at throttle boundary as compared to other parts of elbow throttle
SIMULATION PARAMETERS-
Run parameters
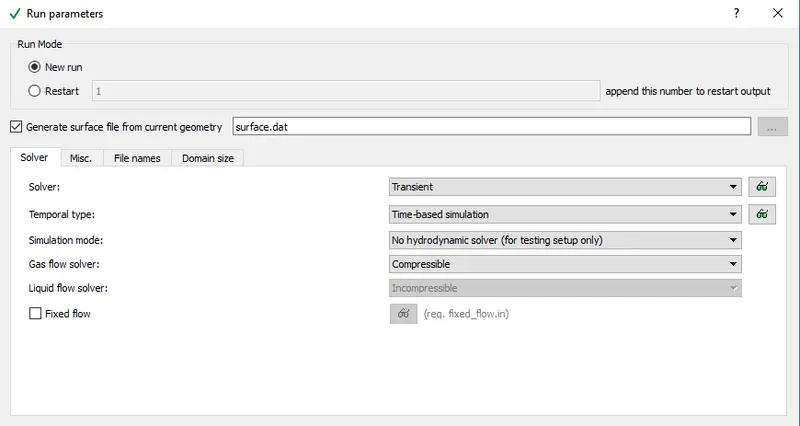
solver is transient and simulation is time based. for transient state analysis we use no hydrodynamic simulation mode to get optimum results
Time parameters
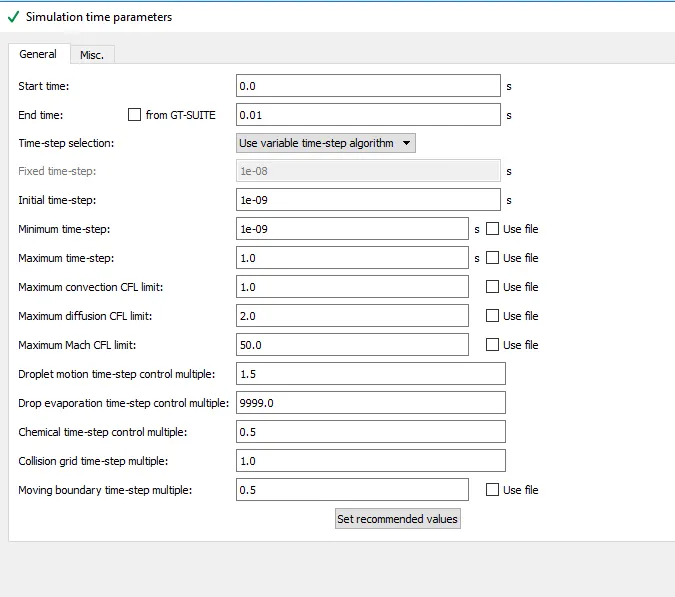
calculation of end time - end time is calculation by considering length of elbow and velocity of flow. Time required is calculated by dividing velocity of flow by length of elbow throttle.
length of elbow = 0.2 , velocity 120
end time = 0.2/120 = 0.001 , so 0.001ms istime taken for d=flow to reach from inlet to outlet, so our simulation time would be 3 to 4 times of 0.001ms, so lets take 0.01ms as our simulation time.
Boundary-
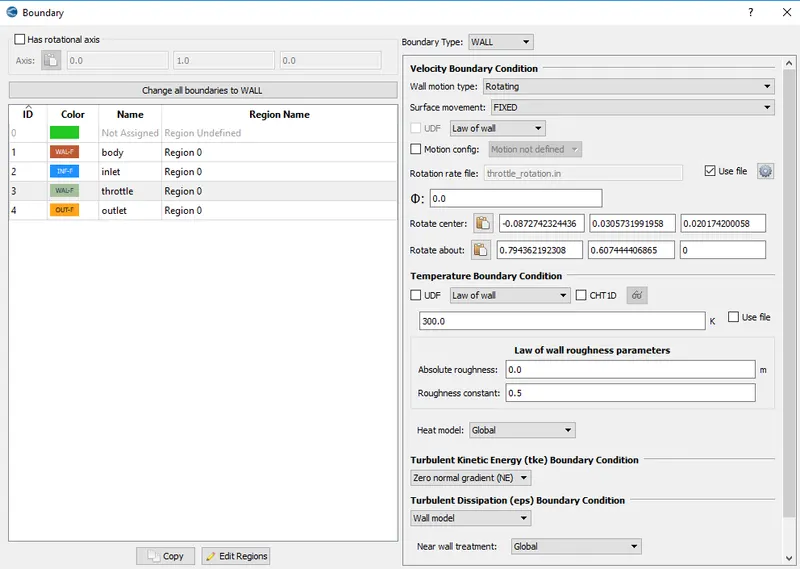
Throttle is rotating and rotate centre and rotation axis are calculated using measure tool in converege
inlet - inflow
outlet - outflow
elbow wall - law of wall
throttle - law of wall
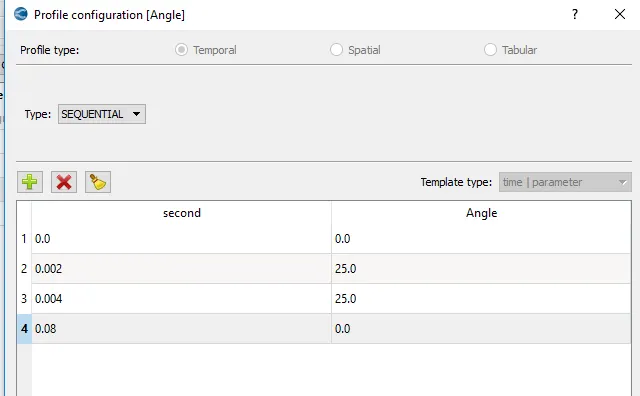
time step - 0 to 0.02 throttle angle is 0 degrees
time step - 0.02 to 0.008 throttle angle is 25 degrees
time step - 0.008 to 0.01 throttle angle is 0 degrees
PRESSURE CONTOUR
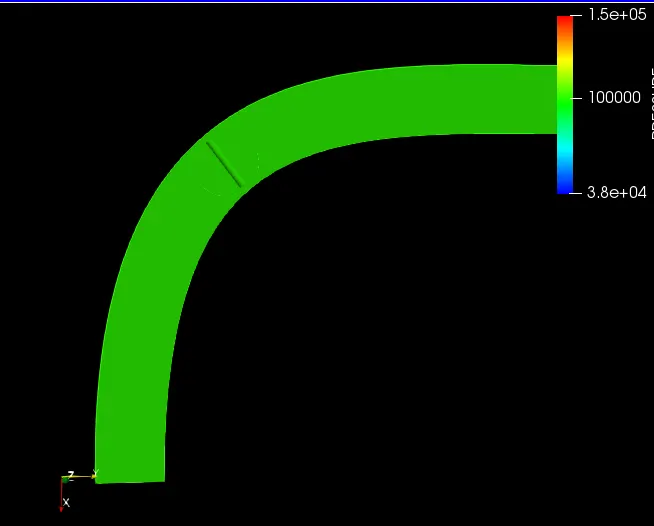
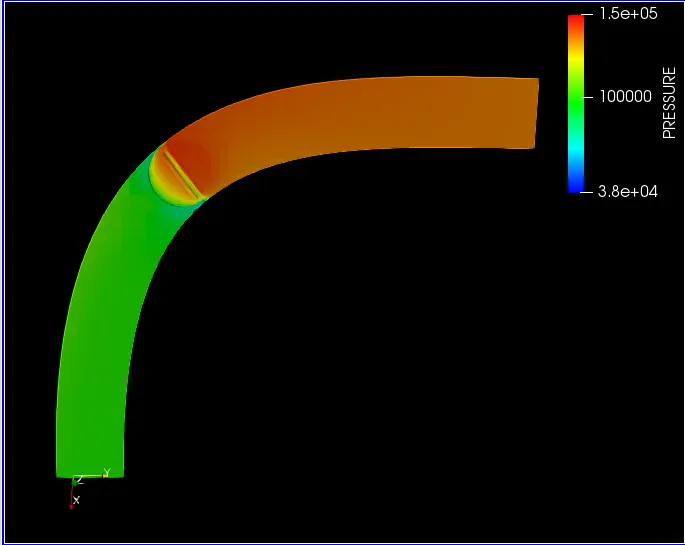
pressure at initial time step pressure at 25 degrees
pressure at final time step
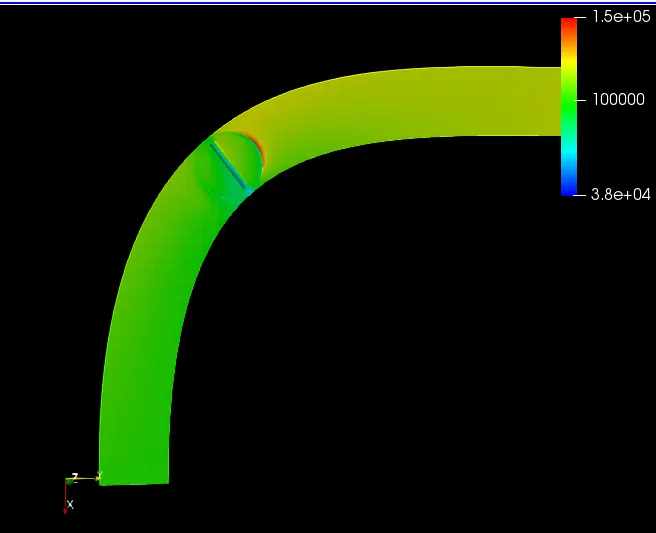
Pressure at initial time step is we can see 10000pa which is uniform through out the geometry, but as time step increases pressure variation can be seen throughout geometry. At time step 4 to 8 throttle position is 25degrees , so the pressure at inlet increases and is maximum as compared to outlet side because of hindrance caused in flow due to dercrease in flow area at throttle. At time step 8 to 10 throttle moves back to its initial position , hence presure can be seen is uniform along the geometry
PRESSURE AT THROTTLE
pressure at front of throttle
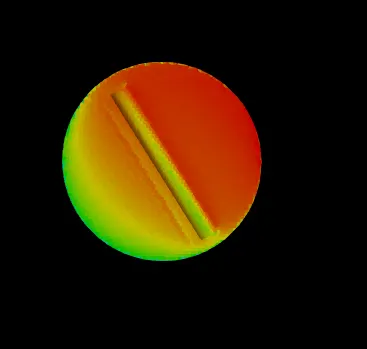
Pressure is maximum at front surface area of throttle when its position is 25 degrees , this is because the flow hits front of throttle and throttle acts as barrier for flow.
pressure at back of throttle
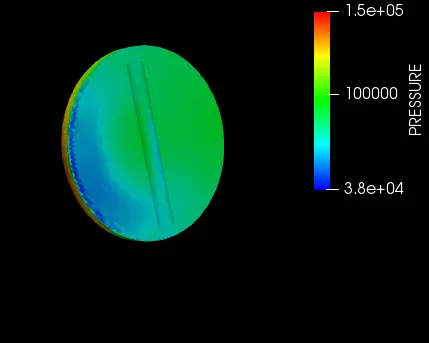
pressure at back position of throttle is minimum , this is because when throttle open at 25 degrees , where front of throttle faces all flow force , there is gap created at back of throttle where flow is minimum since pressure drop at back of throttle is maximum.
VELOCITY CONTOUR
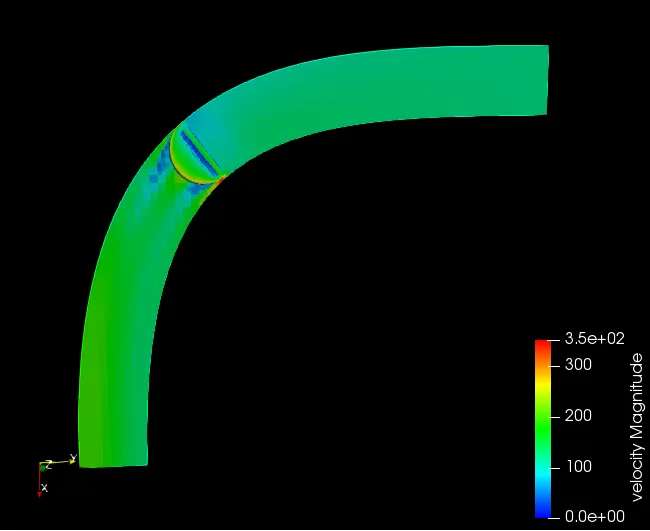
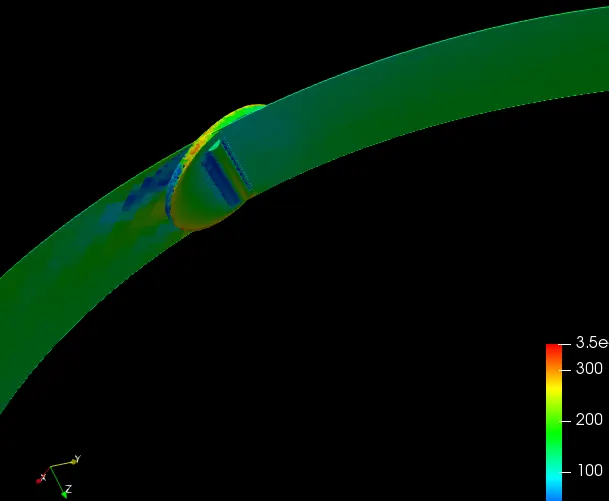
Velocity at initial position is uniform but as throttle moves to 25 degrees we can see variation in velocity in above two figures. velocity from initial to throttle is less than velocity from throttle to outlet, this is because of pressure drop from throttle to outlet. pressure decreases near outlet which result in increase of velocity.
velocity at throttle can be seen to be zero at top and bottom of throttle, this is because of now flow zone created at those places. when throttle opens at 25 degrees and flow hits and passes from suface of throttle and at same time at top and bottom of throttle a gap is generated in which there is now flow and hence velocity in that area is zero
FLOW DIRECTION
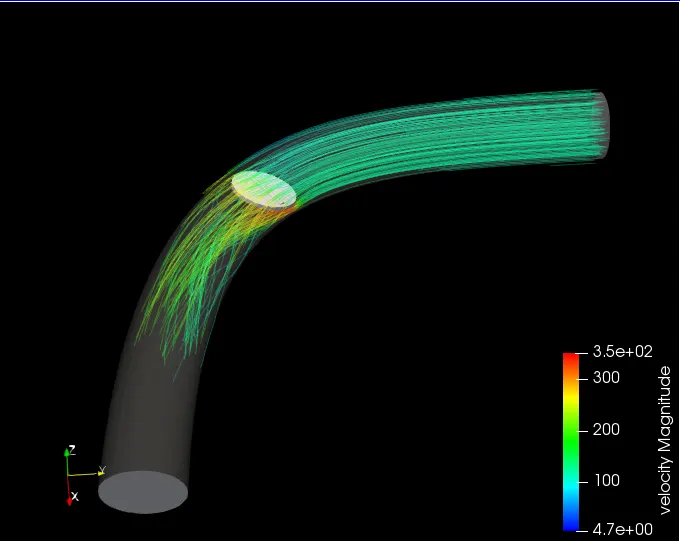
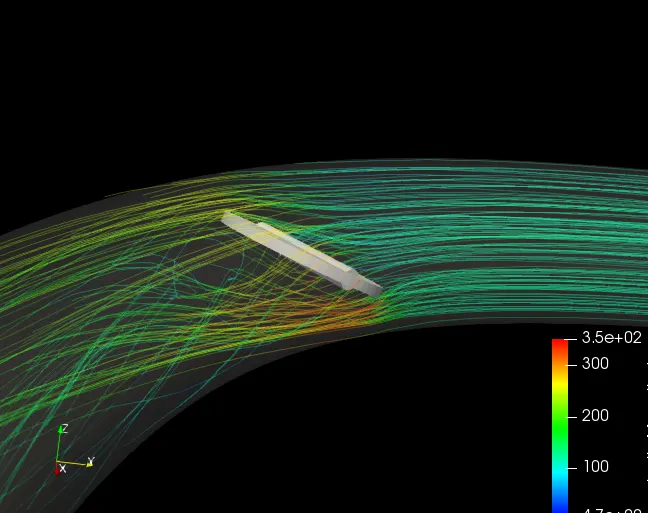
In paraview we can see how is the flow direction , so one thing to notice here is flow lines across throttle which seems to be disturbed due to open position of throttle
PLOTS
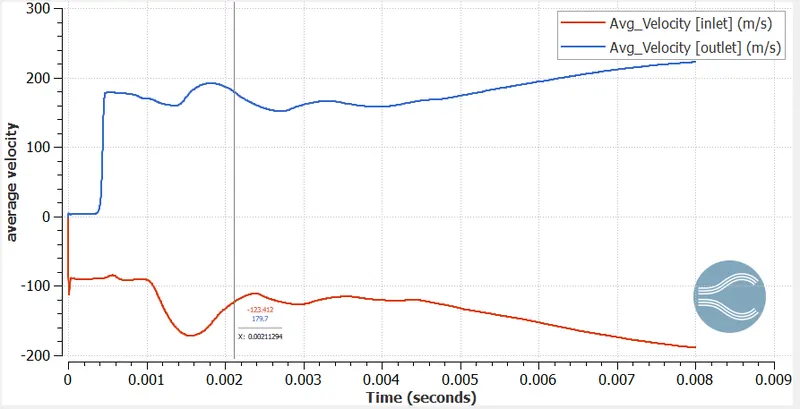
Average velocity
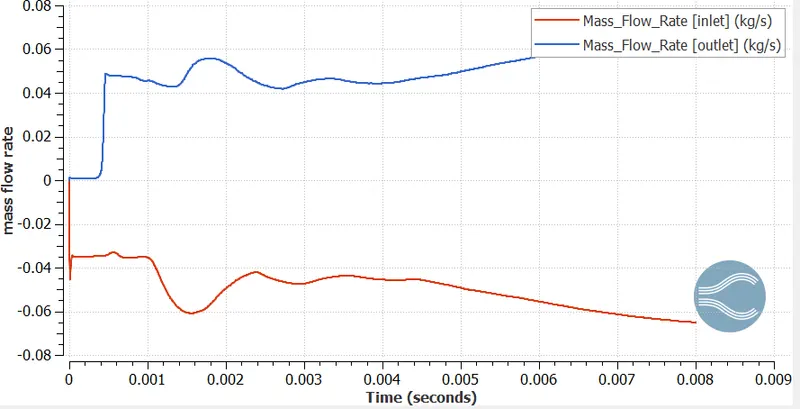
Mass flow rate
Total pressure
Static presssure
Total cell
velocity animation
https://drive.google.com/file/d/1U7CDeHgfMkReLJ5BaYIKn_o3VB13orXb/view?usp=sharing
Conclusion-
- grid size variation leads to more optimum results
- velocity and pressure both varies at position of throttle
- while velocity increases we see decrese in pressure from throttle to outlet
- velocity becomes zero at certain points around throttle
- pressure is not same on complete surface of throttle, where it is more at front of throttle we can see a drop in pressure at back of throttle