Week - 4
AIM:
1. Implement control logic of a “washing machine” using Stateflow as per given sequence.
2. Make a Simulink chart for the “Gear shift” logic as per given conditions.
THEORY:
STATE FLOW: Stateflow is a graphical environment that allows you to design and simulate decision logic for supervisor control, task scheduling, and fault management applications. Stateflow is a control logic tool used to model reactive systems via state machines and flow charts within a Simulink model.
CONTROL LOGIC: Control logic is a key part of a software program that controls the operations of the program. It is the part of a controller that defines how a reactive system responds to events or conditional changes.
1. Washing Machine Logic:
- If the power supply is available, the system gets activated
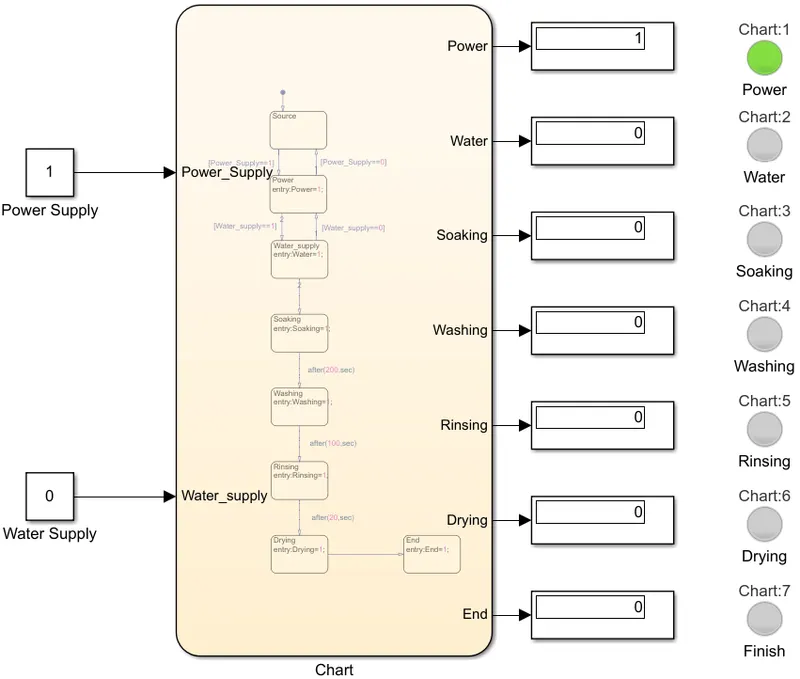
- If the Water supply is not available, stop the process & indicate through LED
- Soaking time should be 200s followed by Washing time of 100s.
- Then rinsing happens for next 20s & dryer runs for 50s
- After all the processes have completed turn on the finished LED
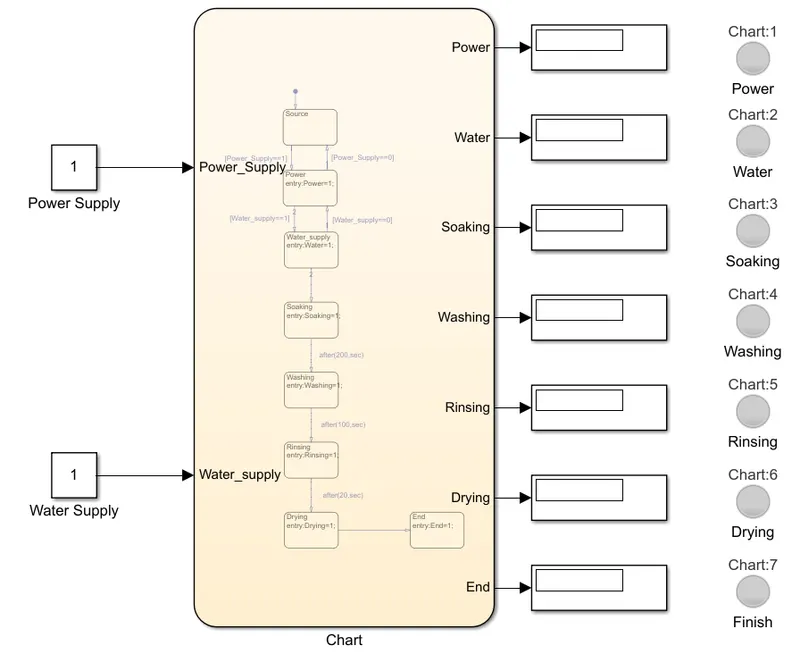
SIMULINK BLOCK DIAGRAM:
EXPLANATION OF THE BLOCKS:
- Initially a chart is created and different states are defined as per the given instructions in the problem.
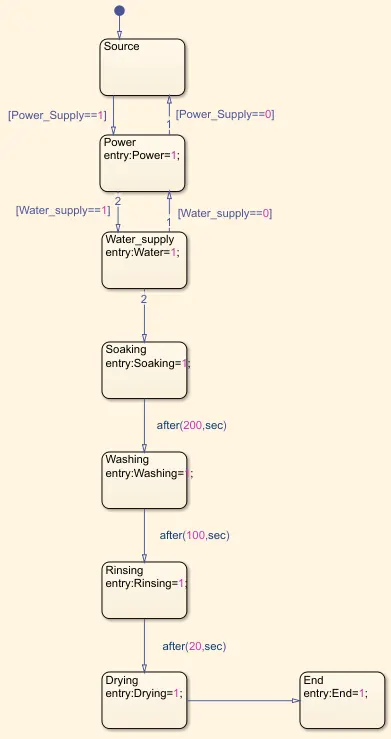
- Delay timings are given as per the values in the instructions.
- Respective variables are created and input & output ports are assigned.
- Power and Water Supply are connected to the input ports of the Chart. The output ports are connected to the display and the lamp for getting a visual output.
- The Simulation runs for 360 sec.
OUTPUT:
Case-1: When Power Supply is turned OFF (input = 0)
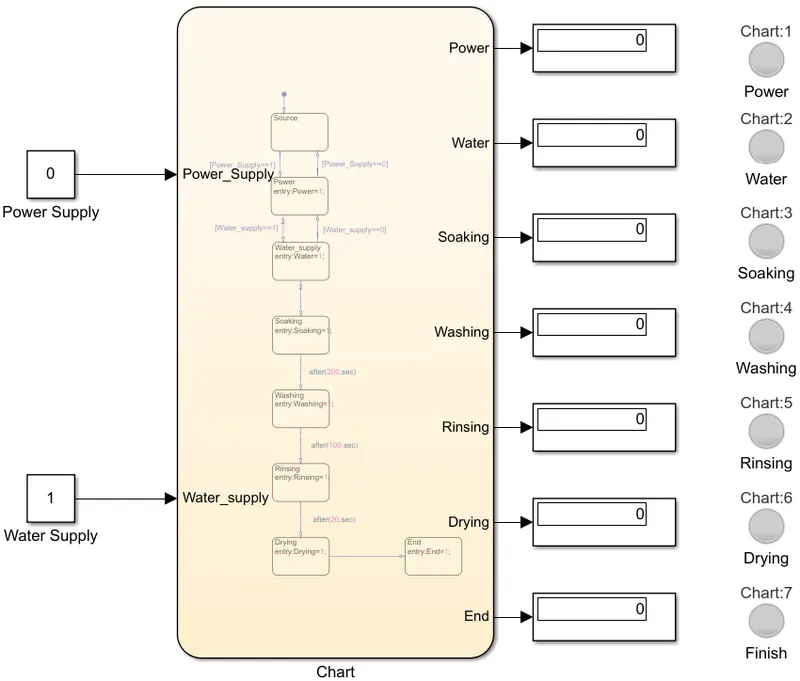
All the remaining processes are not performed as the Power Supply is 0.
Case-2: When Water Supply is OFF (input = 0)
Case-3: When both Power and Water Supply is turned ON (input = 1)
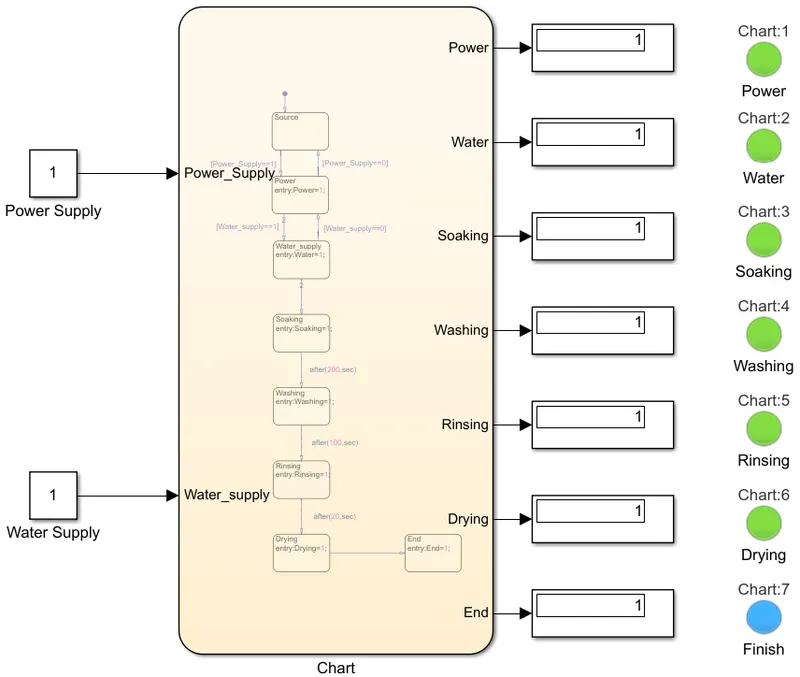
The processes complete in 360s and all the lamps get illuminated.
2. Gear Transmission Logic:
Speed Range(kmph) Gear
0 to 15 1
16 to 25 2
26 to 40 3
41 to 60 4
Above 61 5
Give speed input while the simulation is running & display the gear number.
SIMULINK BLOCK DIAGRAM:
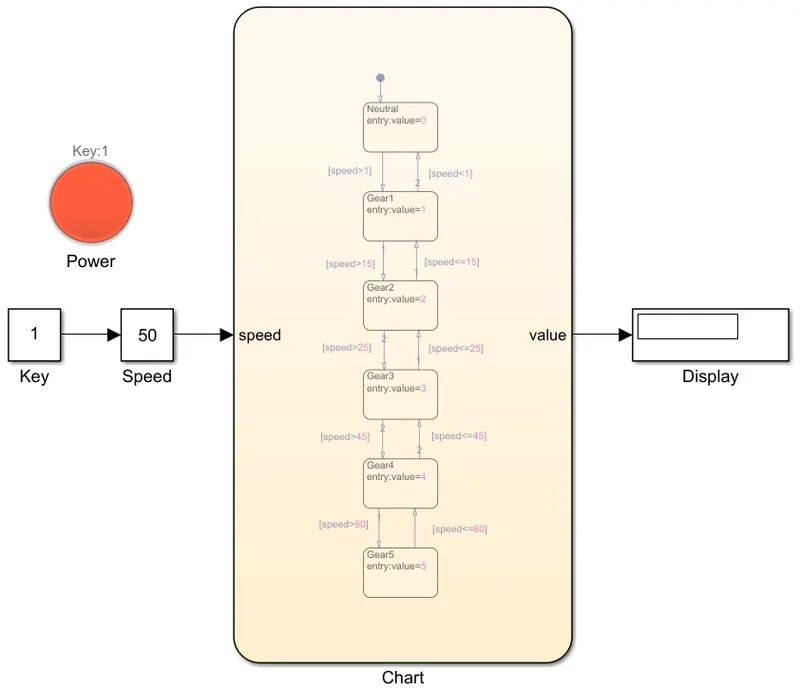
EXPLANATION OF THE BLOCKS:
- Initially a chart is created and various gear states are formed inside the chart.
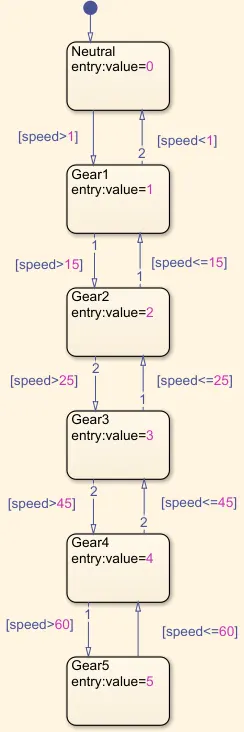
- The speed constraints are defined as per the given instructions.
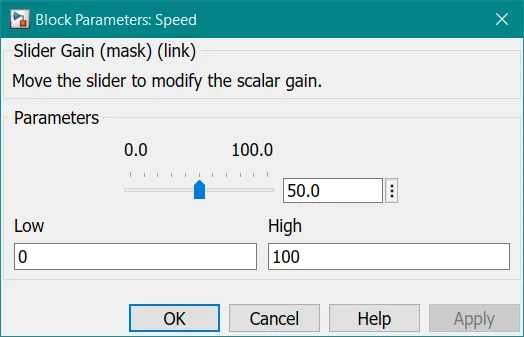
- then the Power Key and a Slider Gain Speed is connected to the input of the Chart.
- The Output is connected to a display which shows the Gear Output value.
- The Lamp is connected with the Key which is Red when Key = 0 (OFF) and turns Green when Kry = 1 (ON).
OUTPUT:
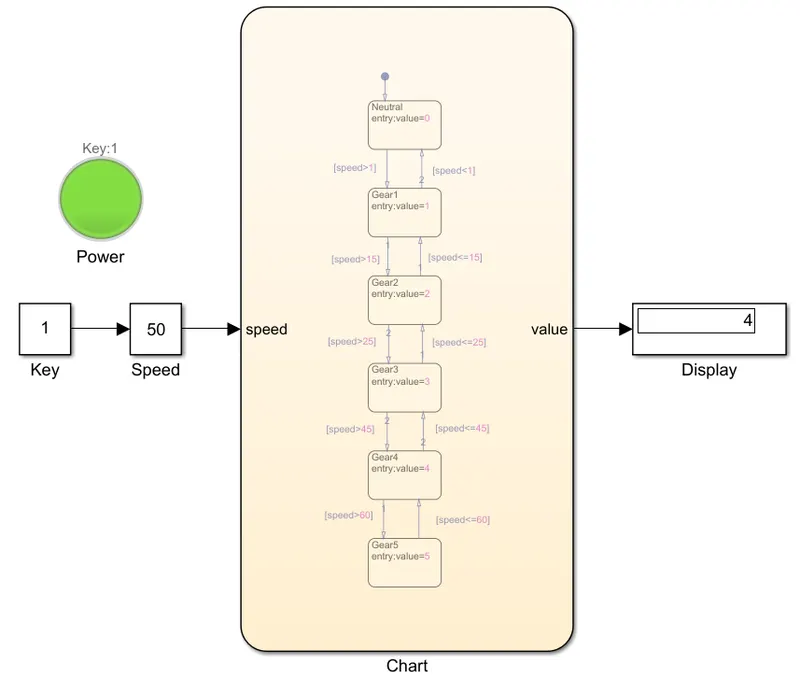
The Gear value changes in real time as per the given Speed values. The Speed can be varied by varying the Slider Gain as shown below:
CONCLUSION:
Hence both the Washing Machine as well as Gear transmission logics are implemented using charts and the output results are attached as above.