Week - 4
PROJECT 1 :
AIM : Implement control logic of a “washing machine” using Stateflow as per given sequence:
- If the power supply is available, the system gets activated.
- If the Water supply is not available, stop the process & indicate through LED.
- Soaking time should be 200s followed by Washing time of 100s.
- Then rinsing happens for next 20s & dryer runs for 50s.
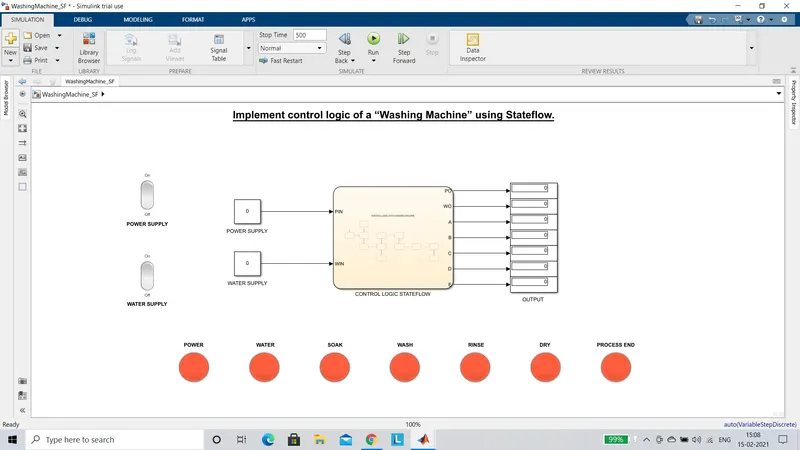
SIMULINK BLOCK :
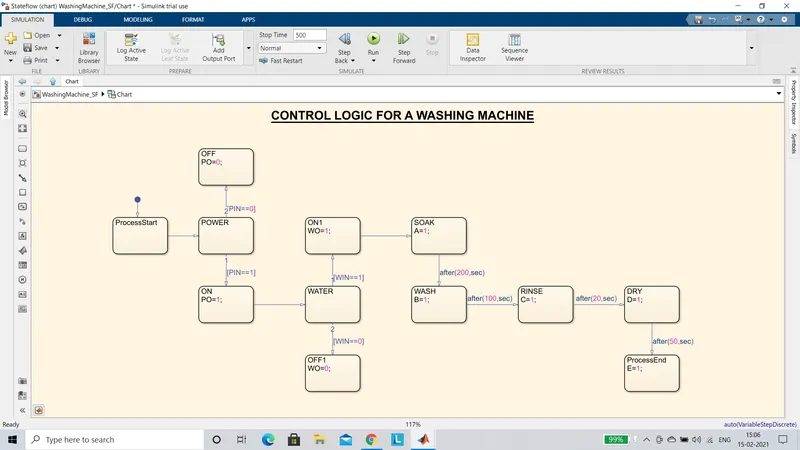
CONTROL LOGIC STATEFLOW :
CASE 1 : The Power Supply and the Water Supply are OFF.
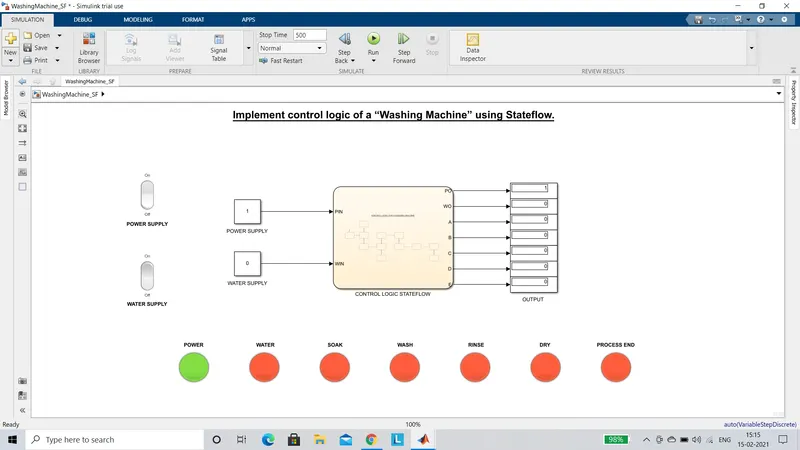
CASE 2 : The Power Supply is ON while the Water Supply is OFF.
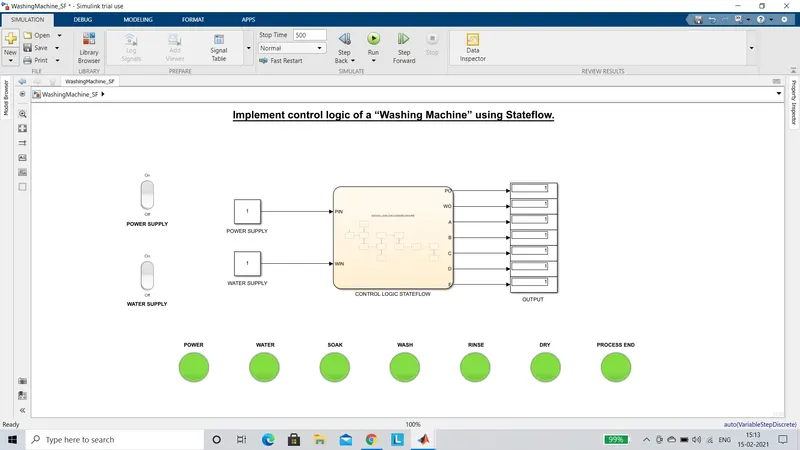
CASE 3 : Both Power Supply and Water Supply are ON.
CASE 4 : Process completed only until Soaking by setting the Stop Time to be 200 seconds.
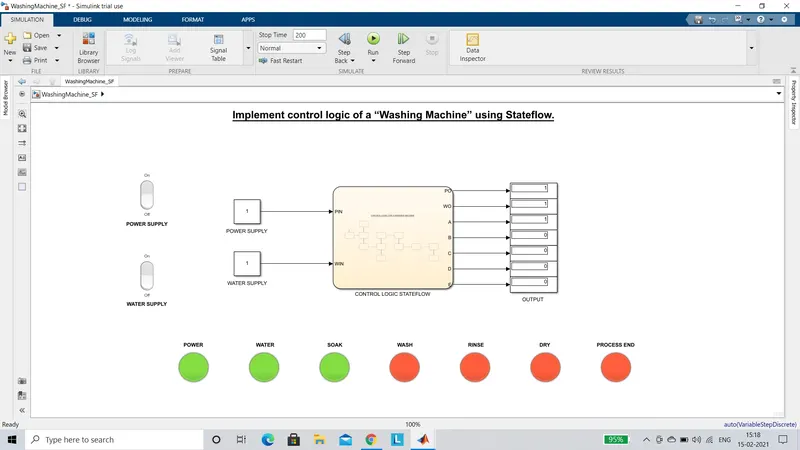
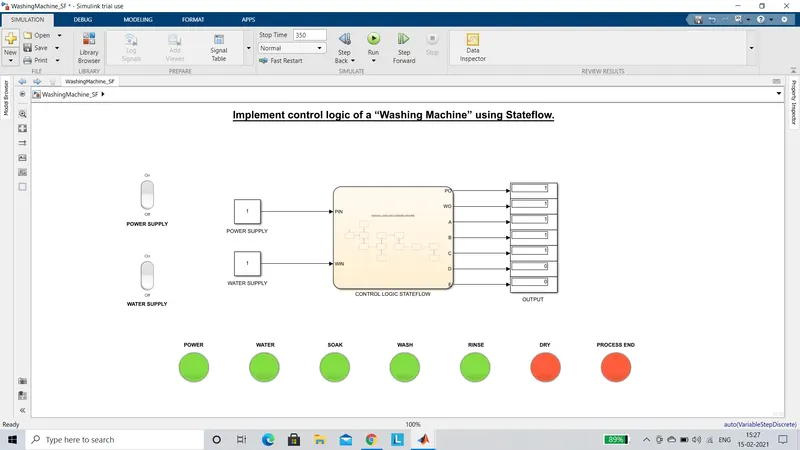
CASE 5 : Process completed only until Rinsing by setting the Stop Time to be 350 seconds.
EXPLANATION :
- We get into the StateFlow mode by inserting the Chart Block from the Library Browser in the Simulink model workspace.
- On double clicking the Chart Block a new chart workspace appears.The State Block is chosen and dragged on to the workspace.
- The control logic is created as shown in the figure named "CONTROL LOGIC STATEFLOW".
- We begin with the ProcessStart state.This is connected to the POWER state.The POWER state has two conditions for ON and OFF.The input logic [PIN==1] leads to the ON state while [PIN==0] leads to the OFF state.This goes to say that when the input for Power ie. PIN is equal 1 the Power Supply is ON and vice-versa.
- Only when the POWER is ON the logic further continues to the WATER state which also has two conditions for the ON and OFF state.Here the input logic [WIN==1] results to ON1 state whereas [WIN==0] results to OFF1 state.The logic follows the same principle as stated for POWER state.
- Only when the WATER is at ON1 state it leads to SOAK state.The SOAK state leads to WASH state after a time delay of 200 seconds which is provided through a input logic statement 'after(200,sec)'.
- Similarly WASH state leads to RINSE state after a time delay of 100 seconds and RINSE to DRY after 20 seconds.
- Finally the DRY state gets completed after 50 seconds by providing the input logic statement to be 'after(50,sec)'.
- The DRY state leads to the ProcessEnd state thus completing the StateFlow Chart.
- The various variables are provided either as input or output in the 'Symblols Panel' under the 'Prepare' tab in the taskbar.In this panel PIN and WIN are connected as input data whereas PO,WO,A,B,C,D,E are connected as output data.
- Now coming back to the model workspace the input to the Power and Water Supply are provided using the Constant Blocks.Also Rocker Switches are used to represent the ON or OFF state of the input variables.
- The output variables representing the various states are depicted in the Display Blocks.Inorder to graphically indicate the completion of each process in the control logic, Lamp blocks are used.These Lamp Blocks are connected to their respective output signals.The Lamp blocks are configured such that the 'GREEN SIGNAL' represents the 'ON STATE' while the 'RED Signal' represents the 'OFF STATE'.Also when a certain process is completed 'GREEN SIGNAL' appears, whereas if a process isn't completed 'RED SIGNAL' appears.
PROJECT 2 :
AIM : Make a Simulink chart for the “Gear shift” logic as per below conditions:
Speed Range(kmph) Gear
0 to 15 1
16 to 25 2
26 to 40 3
41 to 60 4
Above 61 5
Give speed input while the simulation is running & display the gear number.
SIMULINK BLOCK :
CONTROL LOGIC STATEFLOW :
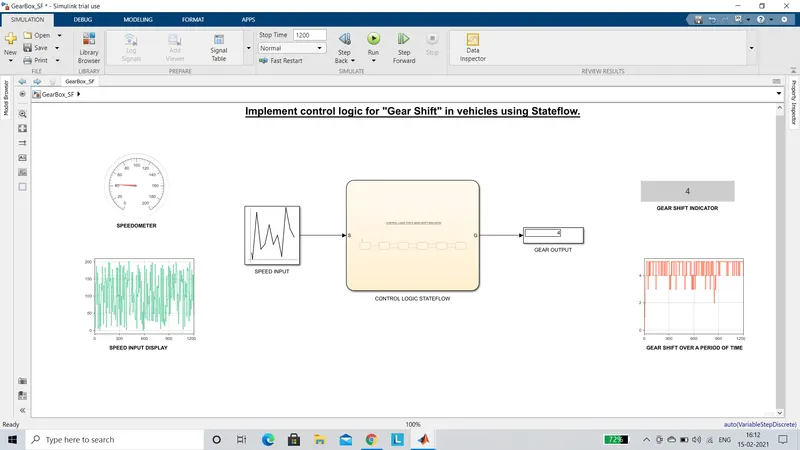
SIMULINK MODEL BLOCK :
CASE 1 : The simulation time is taken as 3600 seconds.
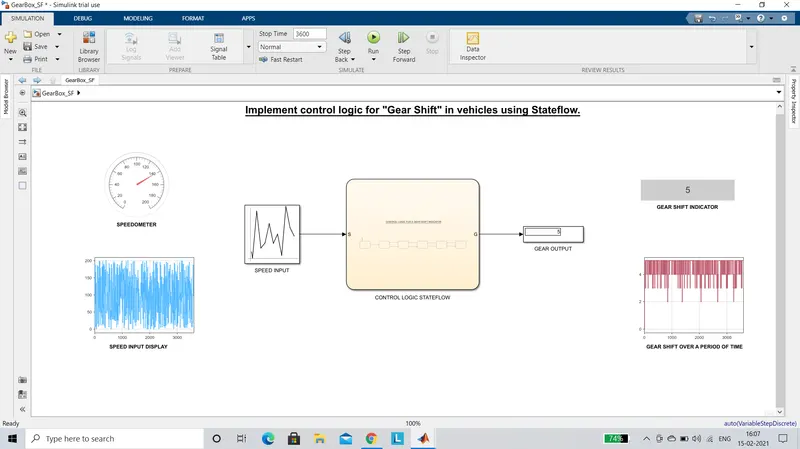
CASE 2 : The simulation time is taken as 1200 seconds.
EXPLANATION :
- We get into the StateFlow mode by inserting the Chart Block from the Library Browser in the Simulink model workspace.
- On double clicking the Chart Block a new chart workspace appears.The State Block is chosen and dragged on to the workspace.
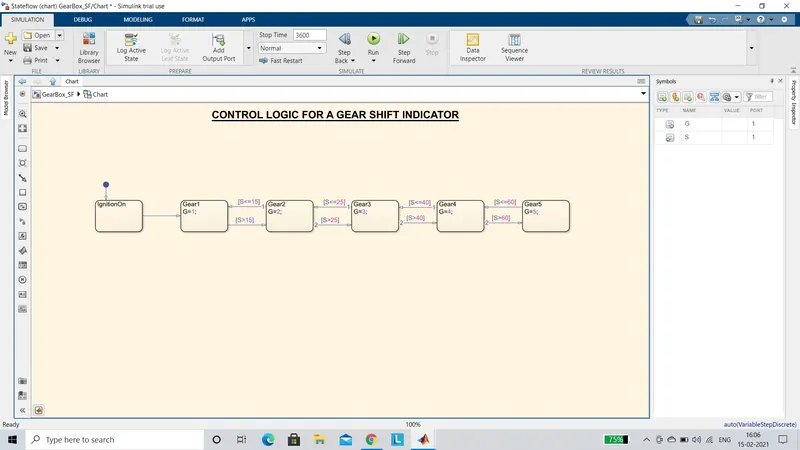
- The control logic is created as shown in the figure named "CONTROL LOGIC STATEFLOW".
- The logic begins with IgnitionOn state.This state leads to Gear1 state where the output related to this state is G=1.This state ouput of '1' is displayed when the speed input is ie S<=15, which is provided as the input logic statement.
- When the speed input S>15 and S<=25 the Gear2 state output ie. G=2 is displayed.
- When the speed input S>25 and S<=40 the Gear3 state output ie. G=3 is displayed.
- When the speed input S>40 and S<=60 the Gear4 state output ie. G=4 is displayed.
- When the speed input S>60 the Gear5 state output ie. G=5 is displayed.
- The various variables are provided either as input or output in the 'Symblols Panel' under the 'Prepare' tab in the taskbar.In this panel S is connected as input data whereas G is connected as output data.
- Now coming back to the model workspace SPEED is provided as input using the Uniform Randon Number Block.Also from the dashboard library Gauge and Dashboard Scope Blocks are used to graphically represent the input varying as a function of time.These two blocks are connected to the input signal.
- A Display block is used to depict the output ie the Gear number.From the dashboard library a Digital Display and Dashboard Scope Blocks are used to graphically represent the output varying as a function of time.These two blocks are connected to the output signal.