Project 1 - Parsing NASA thermodynamic data
AIM : Parsing NASA Thermodynamic data.
OBJECTIVES :
- To write a function that extracts 14 coefficients from the given file.
- To determine the Specific Heat,Enthalpy and Entropy by writing a function consisting the extracted coefficients.
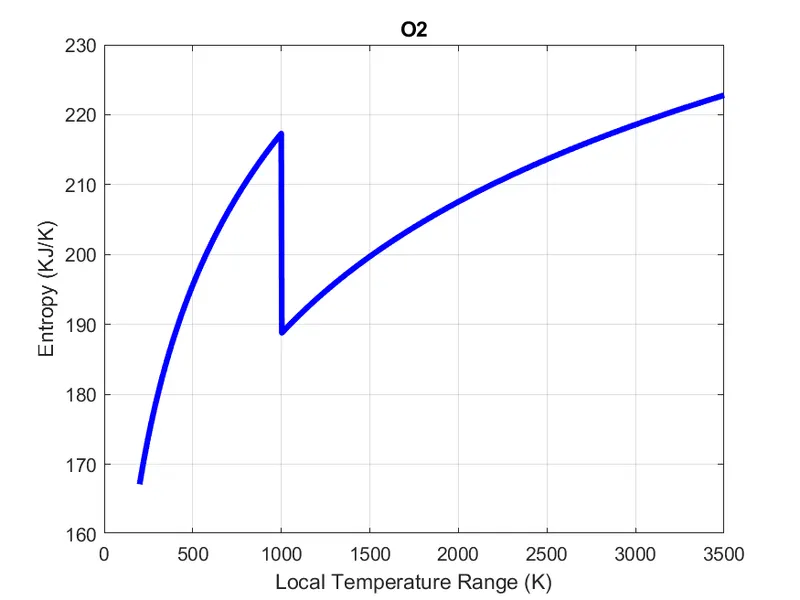
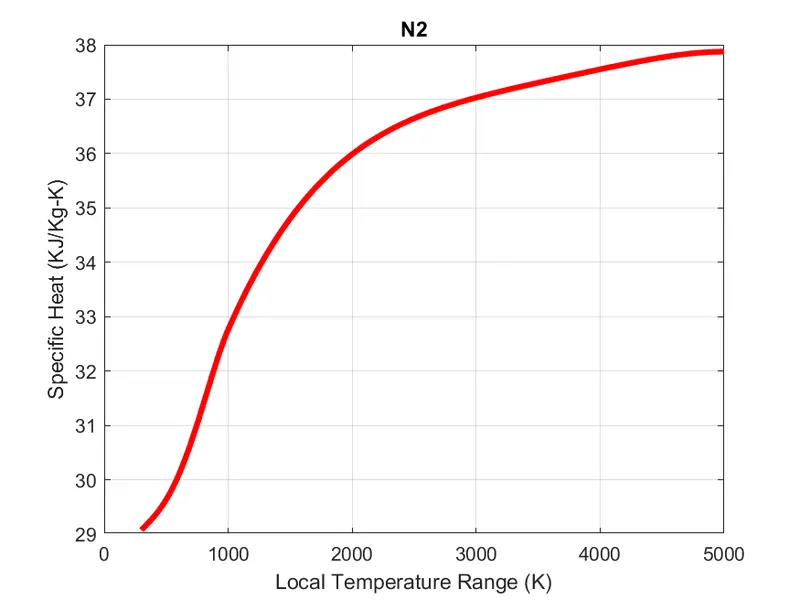
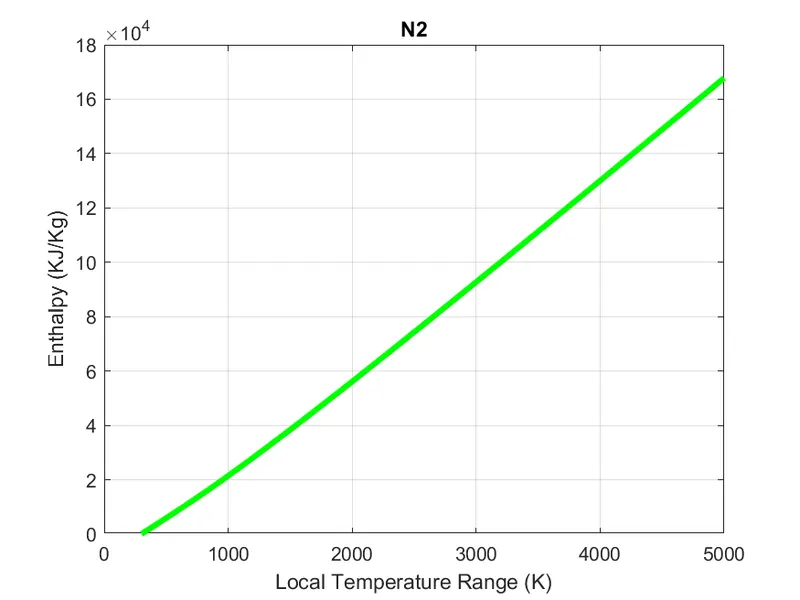
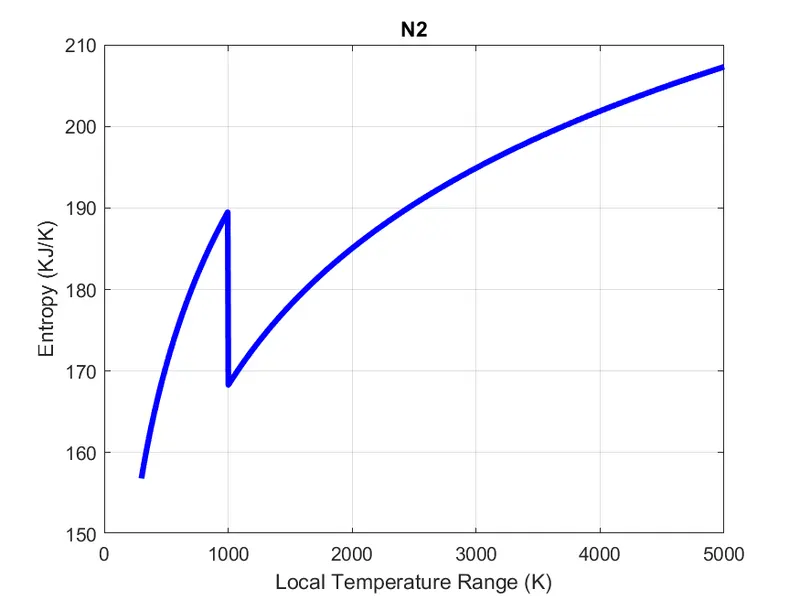
- To plot the Specific Heat,Enthalpy and Entropy for each species and store them in seperate folders.
- To write a function to calculate the molecular weight and display the same.
THEORY :
Specific Heat : It is the amount of heat required per unit mass to change the temperature of a substance by 1 degree.The SI unit is KJ/Kg-K.
Specific Heat in terms of coefficients determined by NASA
`(Cp)/R = a1 + a2.T + a3.T^2 + a4.T^3 + a5.T^4`
Enthalpy : It is the sum of internal energy and the product of pressure and volume of a thermodynamic system.
Enthalpy in terms of coefficients determined by NASA
`(H)/(RT) = a1 + a2.(T/2) + a3.(T^2/3) + a4.(T^3/4) + a5.(T^4/5) + (a6)/T`
Entropy : It is the property of a thermodynamic system which measures the degree of disorder or randomness in the system.
Entropy in terms of coefficients determined by NASA
`(S)/R = a1.ln(T) + a2.T + a3.(T^2/2) + a4.(T^3/3) + a5.(T^4/4) + a7`
PROGRAM : The code is written using MATLAB.
MAIN PROGRAM :
% Parsing NASA Thermodynamic data

clear all
close all
clc

% Input

% Universal Gas Constant (J/mol.K)
R = 8.3145;

% Reading the file
f1 = fopen('THERMO.dat','r');

% Seperating the Headers
for h = 1:5
    tline = fgetl(f1);
end

% Reading the Species
 for i = 1:53
     tline = fgetl(f1);

     % Extracting the Species Name
     species_name = tline(1:9);
     species_name = deblank(species_name)

     % Local Temperature Range
     T = strsplit(tline,' ');
     T_min = str2num(T{end-3});
     T_max = str2num(T{end-2});
     T_mid = str2num(T{end-1});
     Temp = [ T_min T_max T_mid ];
     T_range = linspace(T_min,T_max,1000);

     % High Temperature Co-efficients
     tline = fgetl(f1);
     a = findstr(tline,'E');
     a1 = tline(1:a(1)+3);
     a1 = str2num(a1);
     a2 = tline(a(1)+4:a(2)+3);
     a2 = str2num(a2);
     a3 = tline(a(2)+4:a(3)+3);
     a3 = str2num(a3);
     a4 = tline(a(3)+4:a(4)+3);
     a4 = str2num(a4);
     a5 = tline(a(4)+4:a(5)+3);
     a5 = str2num(a5);
     tline = fgetl(f1);
     a = findstr(tline,'E');
     a6 = tline(1:a(1)+3);
     a6 = str2num(a6);
     a7 = tline(a(1)+4:a(2)+3);
     a7 = str2num(a7);

     % Low Temperature Co-efficients
     a8 = tline(a(2)+4:a(3)+3);
     a8 = str2num(a8);
     a9 = tline(a(3)+4:a(4)+3);
     a9 = str2num(a9);
     a10 = tline(a(4)+4:a(5)+3);
     a10 = str2num(a10);
     tline = fgetl(f1);
     a = findstr(tline,'E');
     a11 = tline(1:a(1)+3);
     a11 = str2num(a11);
     a12 = tline(a(1)+4:a(2)+3);
     a12 = str2num(a12);
     a13 = tline(a(2)+4:a(3)+3);
     a13 = str2num(a13);
     a14 = tline(a(3)+4:a(4)+3);
     a14 = str2num(a14);

     % Calculating the Specific Heat
     Cp = specific_heat_func(a1,a2,a3,a4,a5,a8,a9,a10,a11,a12,Temp,T_range,R);

     % Calculating the Enthalpy
     H = enthalpy_func(a1,a2,a3,a4,a5,a6,a8,a9,a10,a11,a12,a13,Temp,T_range,R);

     % Calculating the Entropy
     S = entropy_func(a1,a2,a3,a4,a5,a7,a8,a9,a10,a11,a12,a14,Temp,T_range,R);

     % Calculating the Molecular Weight
     m_weight = molecular_weight_func(species_name);
     % Saving Molecular Weight data
     species_wt = fopen('molecular_weight.txt','w');
     fprintf(species_wt,'Molecular Weight of %s is %f',species_name,m_weight);
     fclose(species_wt);

     % Plotting Specific Heat,Enthalpy and Entropy v/s Temperature

     % Making new folder for each species
     current_directory = pwd;
     mkdir(species_name)
     cd(species_name)

     % Plotting Specific Heat (KJ/Kg-K)
     figure(1)
     plot(T_range,Cp,'linewidth',3,'color','r')
     title(species_name)
     xlabel('Local Temperature Range (K)')
     ylabel('Specific Heat (KJ/Kg-K)')
     grid on

     % Plotting Enthalpy (KJ/Kg)
     figure(2)
     plot(T_range,H,'linewidth',3,'color','g')
     title(species_name)
     xlabel('Local Temperature Range (K)')
     ylabel('Enthalpy (KJ/Kg)')
     grid on

     % Plotting Entropy (KJ/K)
     figure(3)
     plot(T_range,S,'linewidth',3,'color','b')
     title(species_name)
     xlabel('Local Temperature Range (K)')
     ylabel('Entropy (KJ/K)')
     grid on

     % Saving the files in seperate folders for each species
     saveas(1,'Specific Heat.png')
     saveas(2,'Enthalpy.png')
     saveas(3,'Entropy.png')

     cd(current_directory)

     % Printing Molecular Weight
     sprintf('Molecular Weight of %s is %f',species_name,m_weight)

 end

 % Closing the file
 fclose(f1);
SPECIFIC HEAT CALLING FUNCTION :
% Calling function for Specific Heat

function [Cp] = specific_heat_func(a1,a2,a3,a4,a5,a8,a9,a10,a11,a12,Temp,T_range,R)
 for i = 1:length(T_range)
    if T_range(i) >= Temp(3)
        Cp(i) = R*(a1+a2*T_range(i)+a3*T_range(i)^2+a4*T_range(i)^3+a5*T_range(i)^4);
    else
        Cp(i) = R*(a8+a9*T_range(i)+a10*T_range(i)^2+a11*T_range(i)^3+a12*T_range(i)^4);
    end
end
ENTHALPY CALLING FUNCTION :
% Calling function for Enthalpy

function [H] = enthalpy_func(a1,a2,a3,a4,a5,a6,a8,a9,a10,a11,a12,a13,Temp,T_range,R)
for i = 1:length(T_range)
    if T_range(i) >= Temp(3)
        H(i) = R*T_range(i)*(a1+a2*((T_range(i))/2)+a3*((T_range(i)^2)/3)+a4*((T_range(i)^3)/4)+a5*((T_range(i)^4)/5)+(a6/(T_range(i))));
    else
        H(i) = R*T_range(i)*(a8+a9*((T_range(i))/2)+a10*((T_range(i)^2)/3)+a11*((T_range(i)^3)/4)+a12*((T_range(i)^4)/5)+(a13/(T_range(i))));
    end
end
ENTROPY CALLING FUNCTION :
% Calling function for Entropy

function [S] = entropy_func(a1,a2,a3,a4,a5,a7,a8,a9,a10,a11,a12,a14,Temp,T_range,R)
for i = 1:length(T_range)
    if T_range(i) >= Temp(3)
        S(i) = R*(a1*log((T_range(i))+a2*T_range(i)+a3*((T_range(i)^2)/2)+a4*((T_range(i)^3)/3)+a5*((T_range(i)^4)/4)+a7));
    else
        S(i) = R*(a8*log((T_range(i))+a9*T_range(i)+a10*((T_range(i)^2)/2)+a11*((T_range(i)^3)/3)+a12*((T_range(i)^4)/4)+a14));
    end
end
MOLECULAR WEIGHT CALLING FUNCTION :
function [m_weight] = molecular_weight_func(species_name)
element = {'O','H','C','N','S','AR'};
atomic_wt = [15.999, 1.008, 12.011, 14.007, 32.06, 39.948];
m_weight = 0;
for i = 1:length(species_name)
    for j = 1:length(element)
        if strcmp(species_name(i),element(j))
            m_weight = m_weight + atomic_wt(j);
            a = j;
        end
    end
    b = str2num(species_name(i));
    if b>1
        m_weight = m_weight + atomic_wt(a)*(b-1);
    end
end
OUTPUT :
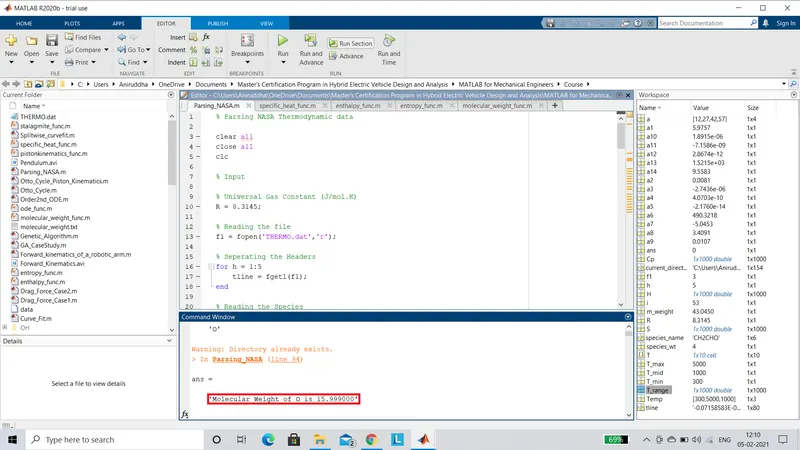
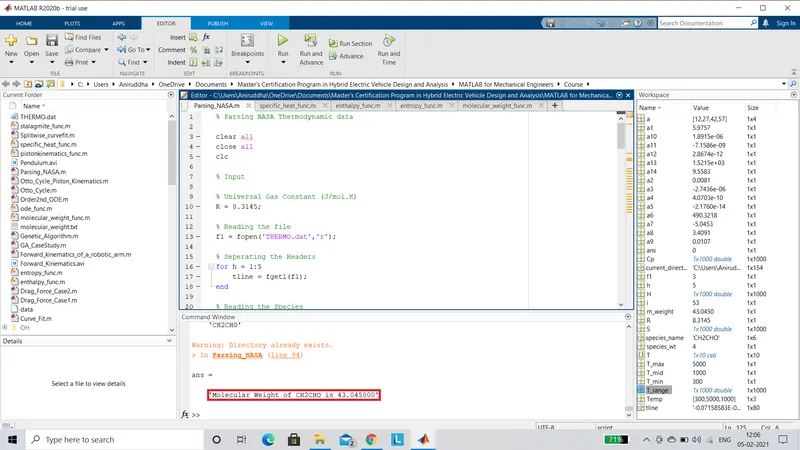
MOLECULAR WEIGHT VALUES :
SCREENSHOTS OF THE WINDOW WHERE ALL THE FOLDERS ARE SAVED :


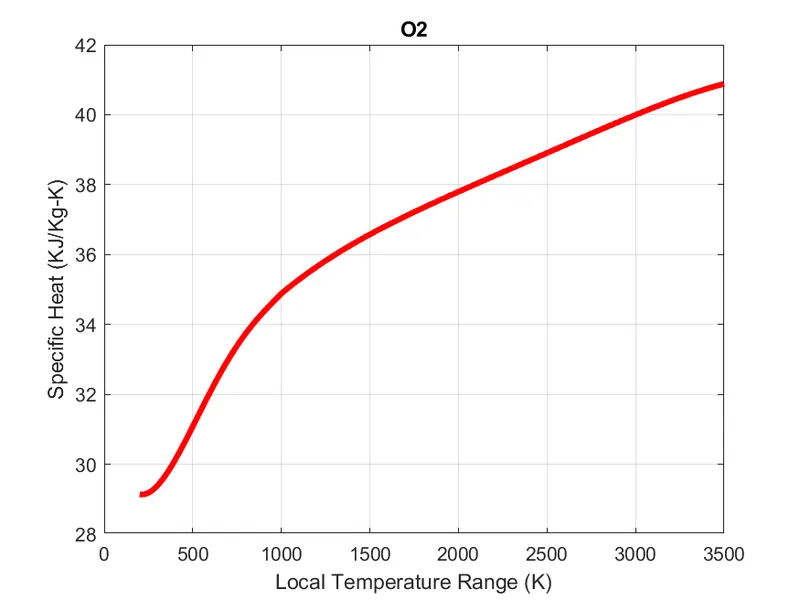
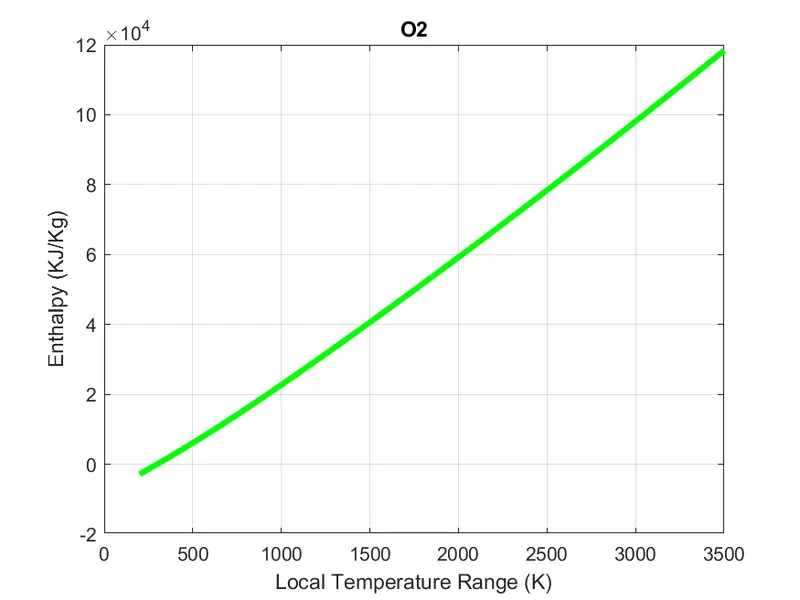
PLOTS :
O2 SPECIES :
N2 SPECIES :
CO2 SPECIES :
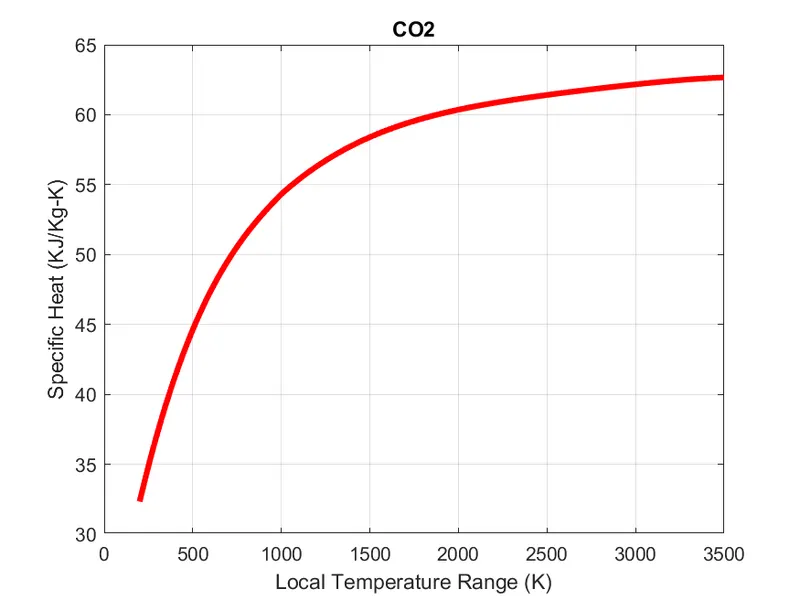
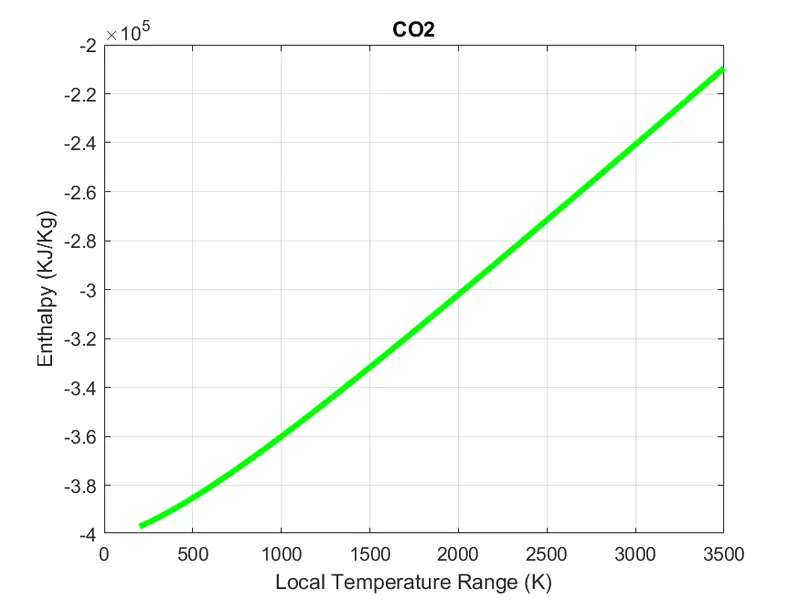
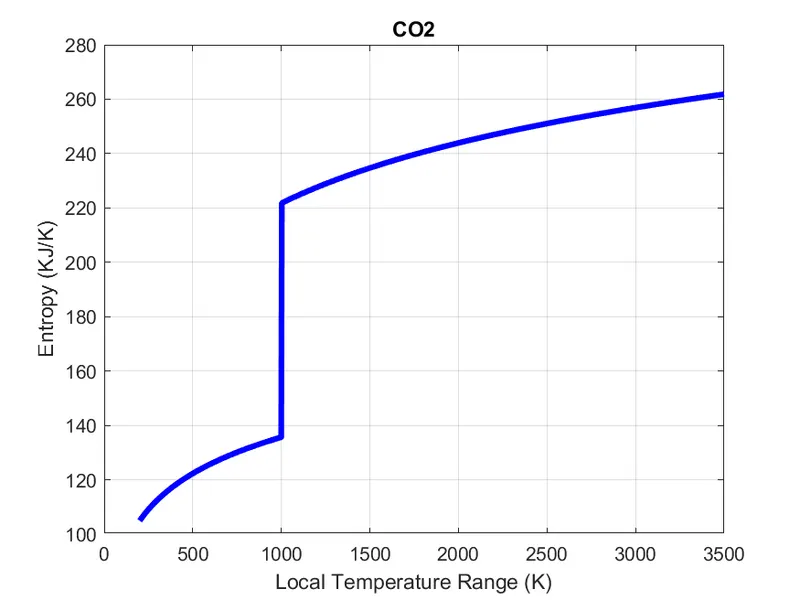
EXPLANATION :
- We begin by reading the file using 'fopen' command.
- Inorder to seperate headers we use the 'fgetl' command inside a 'for loop' for 5 iterations.
- Now to read each of the species from the file we create a 'for loop' for 53 iterations as the total number of species is 53.
- We use the 'fgetl' command to get to the species name line where we extract the name of the species by providing the array index and store it in a column vector called 'species_name'.We eliminate the unwanted blank spaces using the 'deblank' command.
- Now from the same line we extract the local temperatures ranges using the 'strsplit' command assign them to 3 vectors.They are converted to integers using the 'str2num' command.
- Further in order to extract the various coefficients we get to the next line using the 'fgetl' command.We seperate the coefficients with respect to the string 'E' using the the 'findstr' command.Similar procedure is followed for the next two lines.Thus 14 coefficients are extracted.
- The Specific Heat, Enthalpy and Entropy are calculated in seperate calling functions.
- Considering the Specific Heat calling function, here we represent the calling function interms of the various coefficients extracted earlier.We use a 'for loop' where the number of iterations is equal to the 'length' of the temperature range.Using the 'if' function for 'Temperature Range'>='Mid Temperature' we use the high temperature coefficients.Else we use the low temperature coefficients.
- Similarly calling functions for Enthalpy and Entropy are created.
- Now to calculate the molecular weight of each species we create another function.In this function we assign the various elements present in the 53 species and their atomic weights to two different arrays.Now we created a 'Nested Loop' interms of the number of species and elements.Now under the 'if' command we compare the elements present in the species with the above assigned 'element' vector using the 'strcmp' command.If the elements match then the atomic weights of the respective species is substituted in the formula to find molecular weight.For cases where the element is appearing more than once we use the 'if' command again.We convert the species name in the previous 'Nested loop' to integer using 'str2num' command and store it in a vector 'b'.Now if b>1 we multiply (b-1) with atomis weight to calculate the molecular weight.
- The molecular weight calculated above is written in a file using the 'fopen' command.We use the 'fprintf command to create a statement and then close the file using 'fclose' command.
- Further we have to create a new directory to store the various plots for each species.Using the 'pwd' we confirm the curent directory and assign it to a variable 'current_directory'.Then we make a dirctory using 'mkdir' command and use the 'cd' command to make this the current directory.The name of the directory being 'species_name'.
- Now we create plots for Specific Heat, Enthalpy and Entropy v/s Temperature.All three plots for each species are stored in different folders using the 'saveas' command.
- Now we type in 'cd(current_directory)' to return to the directory where all the previously calculated variables are stored.
- We use the 'sprintf' command to display the molecular weight in the form of a statement in the command window.
- Hence the loop keeps continuing for all 53 species.
- Finally the file is closed using 'fclose' command.