Week - 4
AIM 1:
- Implement control logic of a “washing machine” using Stateflow as per given sequence:
- If the power supply is available, the system gets activated
- If the Water supply is not available, stop the process & indicate through LED
- Soaking time should be 200s followed by Washing time of 100s.
- Then rinsing happens for the next 20s & dryer runs for 50s
OBJECTIVE:
- to familiarise charts
- to design and implement state flow models
THEORY:
A chart is used to Implement control logic with a finite state machine.A finite state machine is a representation of an event-driven (reactive) system. In an event-driven system, the system responds to an event by making a transition from one state (mode) to another. This transition occurs if the condition defining the change is true.
For example, you can use Stateflow charts to control a physical plant in response to events such as temperature and pressure sensors, clocks, and user-driven events.
MODEL DETAILS
1. The given diagram shows the washing machine model build through a s
tate flow chart. The main operations are soaking, washing, rinsing, and drying.
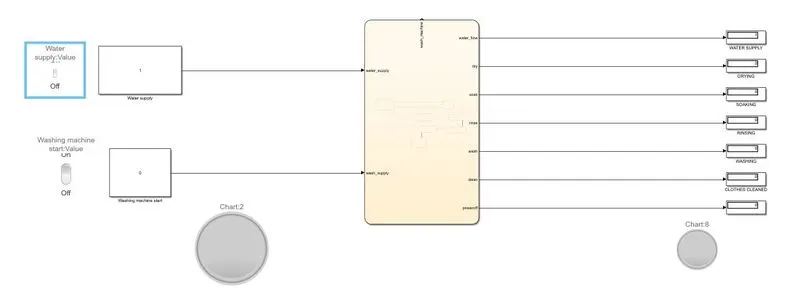
Displaying and explaining the parts individually:
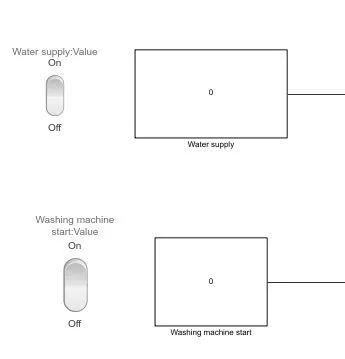
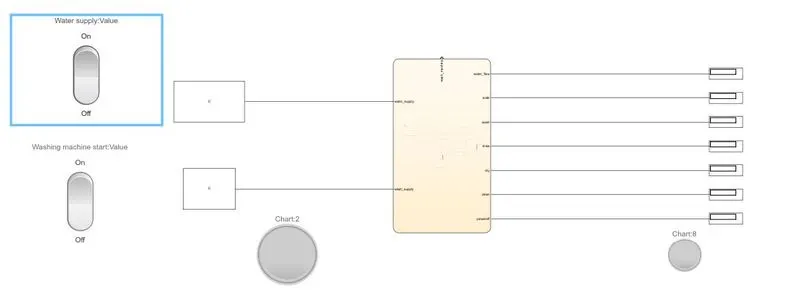
The diagram below has 2 switches that control the water supply and the working of the washing machine. Initially both are in the off position
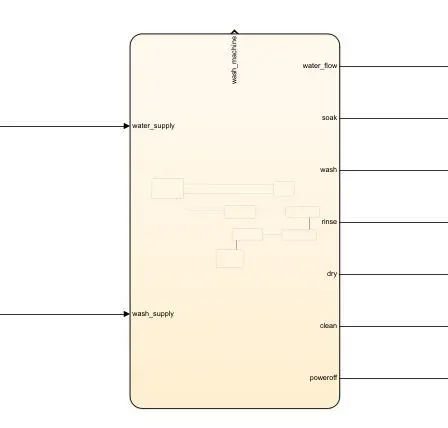
The second diagram shows the state flow chart. It has 2 inputs and 7 outputs. The inputs are the water supply and washing machine On-Off state and outputs are -water_flow, drying, soaking, washing, cleaning, and power-off.
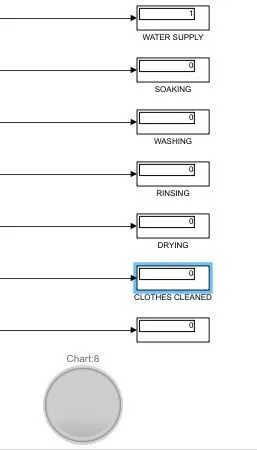
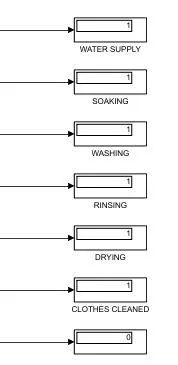
The output is connected to a display screen: When the task is, the display signal shows 1. The light below is to indicate that the system has switched off when there is no water supply.
The figure below shows the state flow chart. In this, 1 indicates its ON, and 0 indicates its OFF.
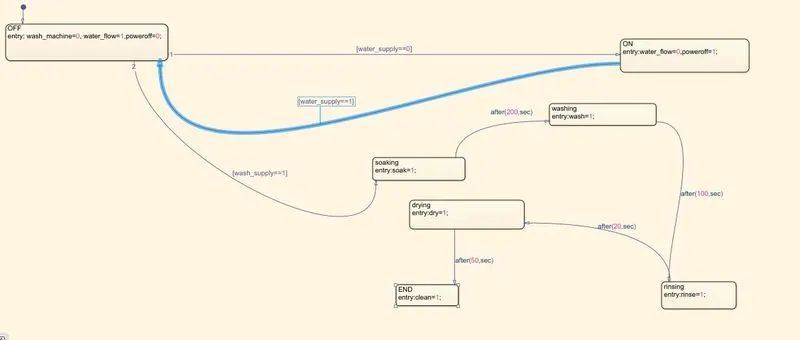
EXPLANATION OF EACH STATE
The first diagram shows the initial state, both switches are in OFF position
Here Washing machine is turned on but the green light is blinking, this shows that even though the washing machine is ON, the water supply has not started yet, this leads to the system getting automatically powered off shown by the red light when the last display shows 1.
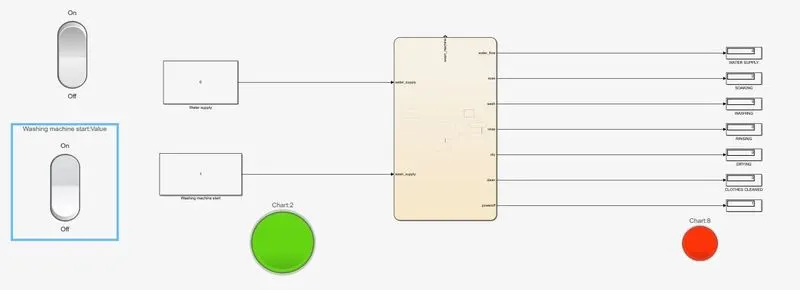
Now when both systems are turned on, both lights stops blinking.
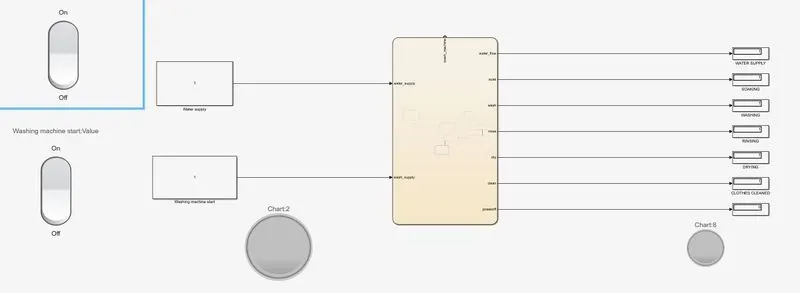
Initially, when the water supply shows 1, soaking starts. This is shown below.
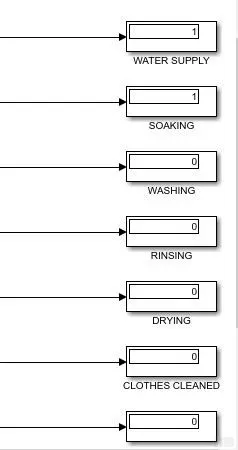
Now once soaking is complete, washing starts this happens for 100 seconds.
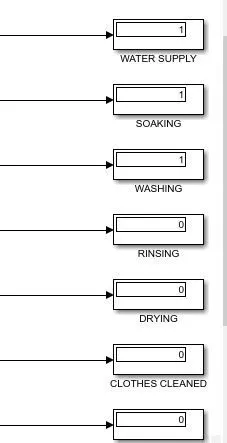
Washing is followed by rinsing
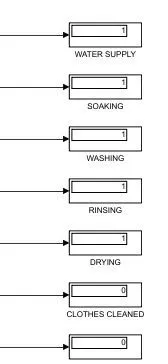
And finally, the drying takes place and the whole process is complete.
CONCLUSION:
The state flow diagram was made and implemented in the washing machine
____________________________________________________________________________________________________________________
AIM 2:
Make a Simulink chart for the “Gear shift” logic as per below conditions:
Speed Range(kmph) Gear
0 to 15 1
16 to 25 2
26 to 40 3
41 to 60 4
Above 61 5
MODEL DETAILS
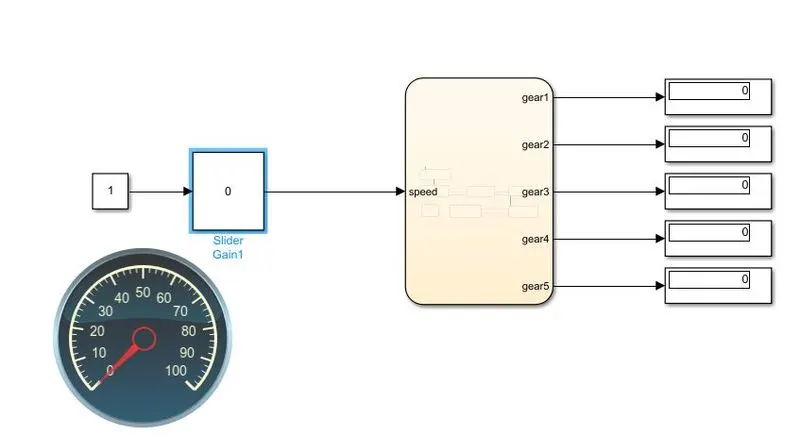
The first figure shows the overall model of the speedometer. In the model we have a :
1. Slidergain- which acts as a throttle to accelerate or decelerate
2.The chart - which shows the states, gear-speed
3. Display- that shows the present gear
4. A speedometer- which is connected with the slider gain. The value in slider gain will be shown in the speedometer.
5. lamps-this shows
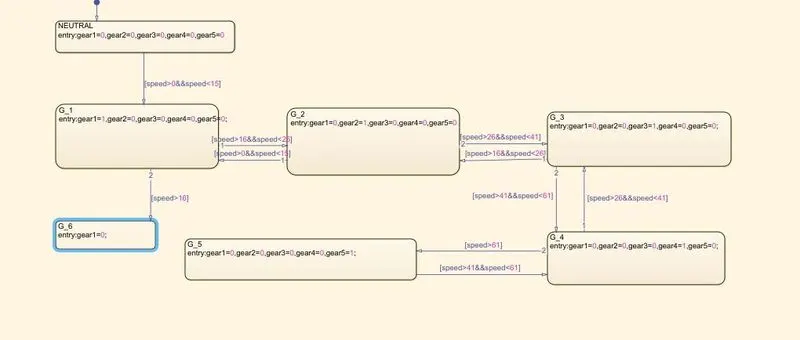
This shows the state flow chart of the system. Initially, all the gears are put to 0, when the speed falls in the range of speed, that corresponds to a particular gear, the display shows 1 for that particular gear. Say if the input gear is 40, it will check G_1, G_2, and finally G_3 and the display at G_3 shows 1.
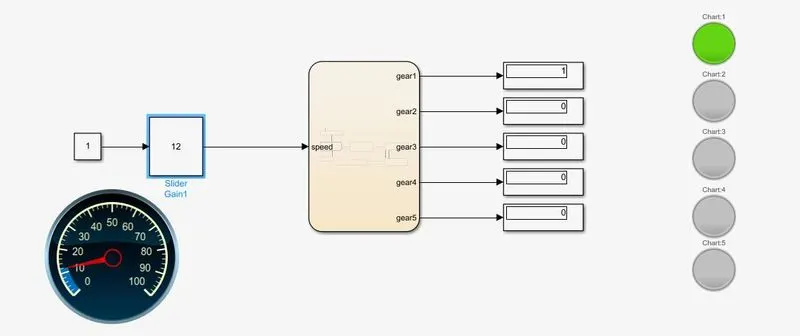
The following figure shows the speed and corresponding gear. The slider shows speed as 12,so the first gear displays 1 and the light goes green for that particular gear
When speed is increased to 20, the display at gear 2 shows 1 followed by green light.
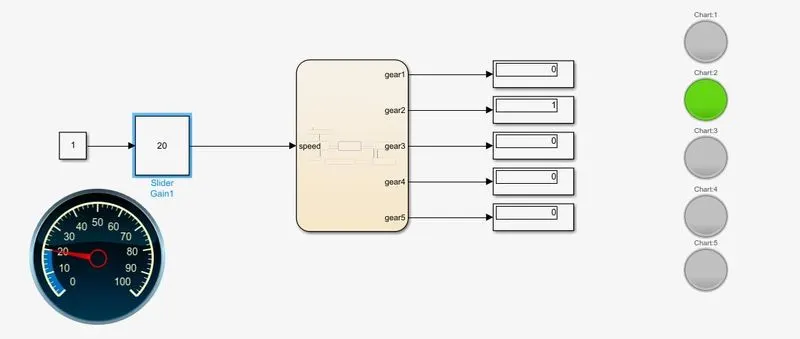
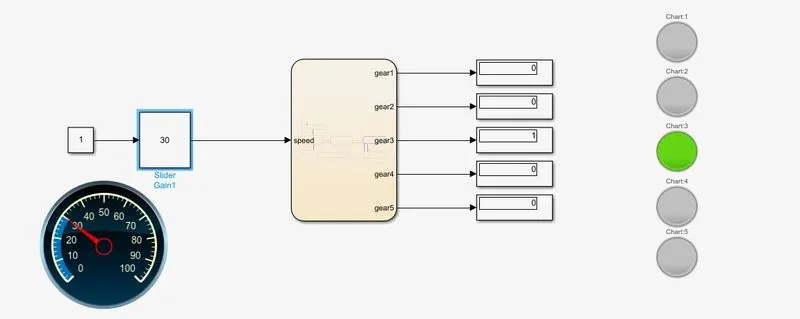
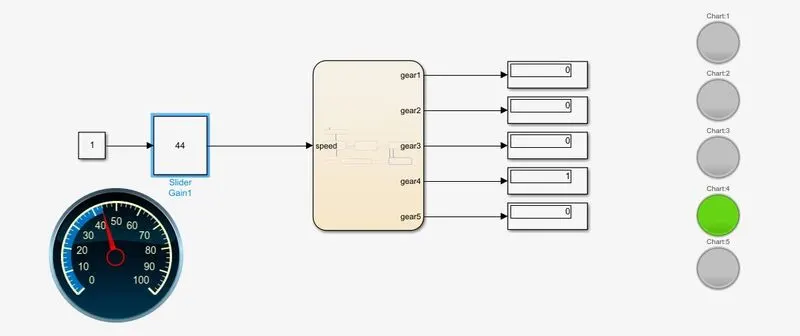
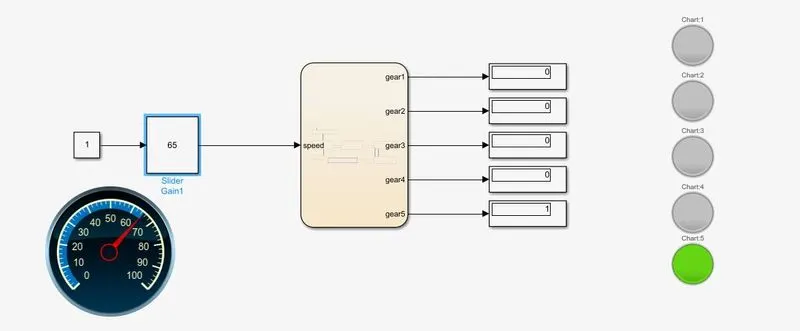
The following three figures show 3 different speed and the corresponding displays and light(30, 44,65). All the 3 speeds fall in different gear values.
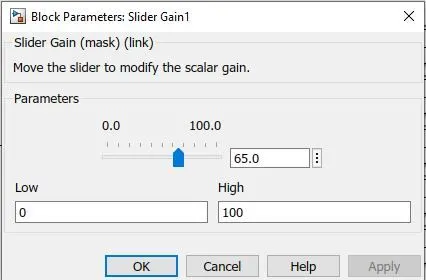
This is the slider gain, which acts as a throttle to accelerate or decelerate. The speed value is from 0-100.
CONCLUSION:
State flow has been implemented in a gear model and the output has been studied