Washing Machine Simulator and Gear Shift Mechanism
Task 1: Washing Machine Model
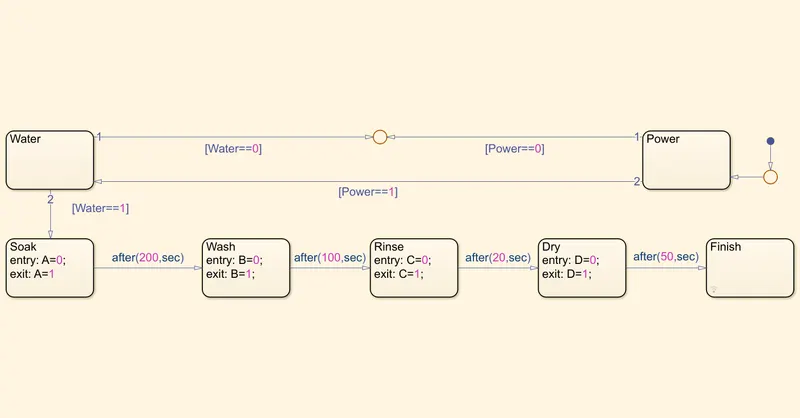
Aim: Implement control logic of a “washing machine” using Stateflow as per given sequence:
- If the power supply is available, the system gets activated
- If the Water supply is not available, stop the process & indicate through LED
- Soaking time should be 200s followed by Washing time of 100s.
- Then rinsing happens for next 20s & dryer runs for 50s
After all the processes have completed turn on the finished LED
StateFlow Chart:
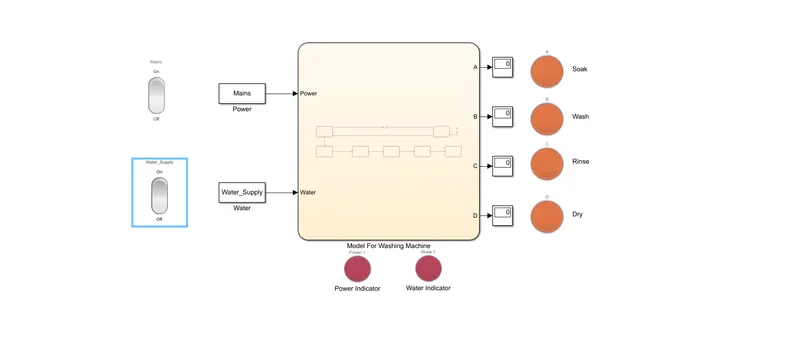
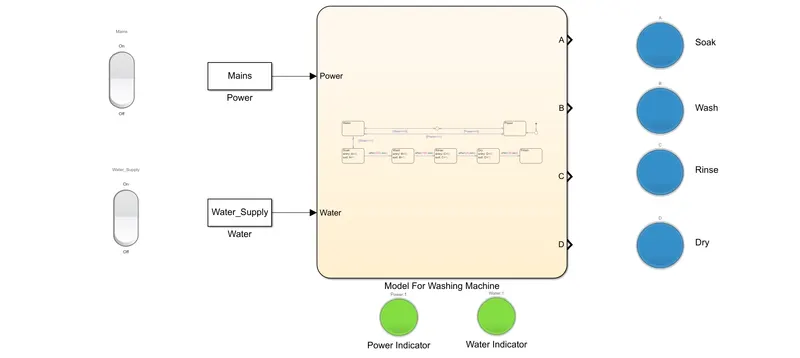
Simulink Model:
NOTE:
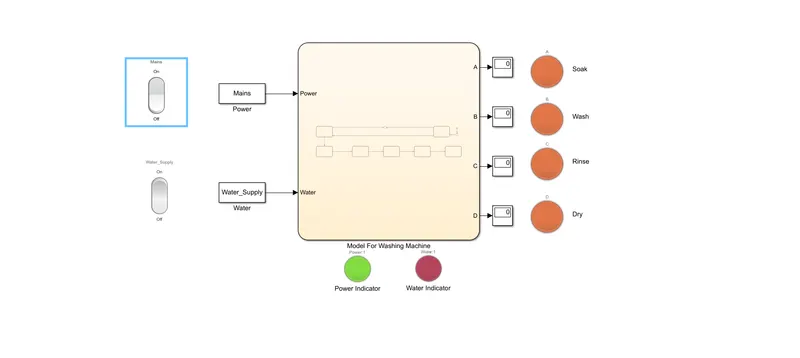
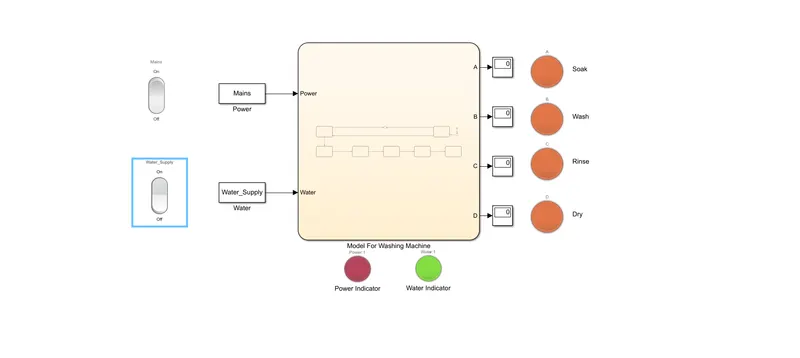
Power Indicator: Green is ON and Red is OFF
Water Indicator: Green is ON and Red is OFF
Soak/Wash/Rinse/Dry: Blue is State achieved and Orange is state unachieved
When Mains and Water Supply is turned OFF:
When mains is ON and Water Supply is turned OFF:
When Mains is OFF and Water Supply is ON:
When both Mains and Water Supply is ON:
Conclusion:
The model has been successfully simulated using Simulink tool in MATLAB.
--------------------------------------------------------------------------------------------------------------------------------------------------------------------------------------------------------------------------------------------------------------------------------------------------------
Task 2: Gear Shift Mechanism
Aim: Make a Simulink chart for the “Gear shift” logic as per below conditions:
Speed Range(kmph) Gear
0 to 15 1
16 to 25 2
26 to 40 3
41 to 60 4
Above 61 5
Give speed input while the simulation is running & display the gear number.
Simulink Model: Following stateflow chart has been used to simulate the mechanism of Gear Shifting.
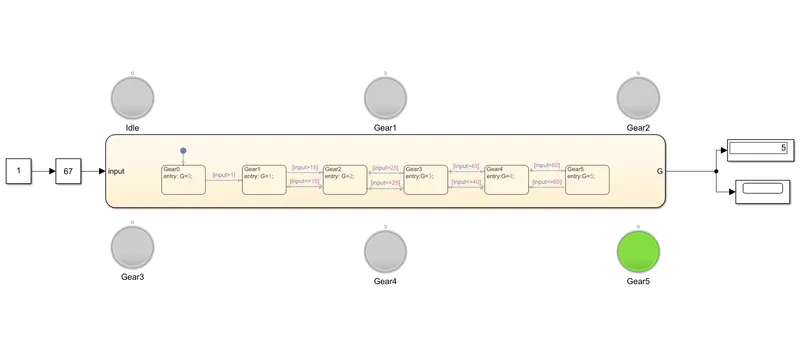
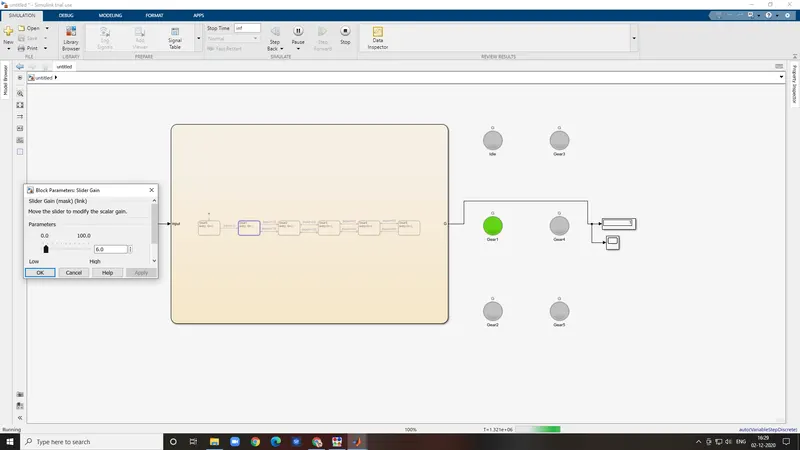
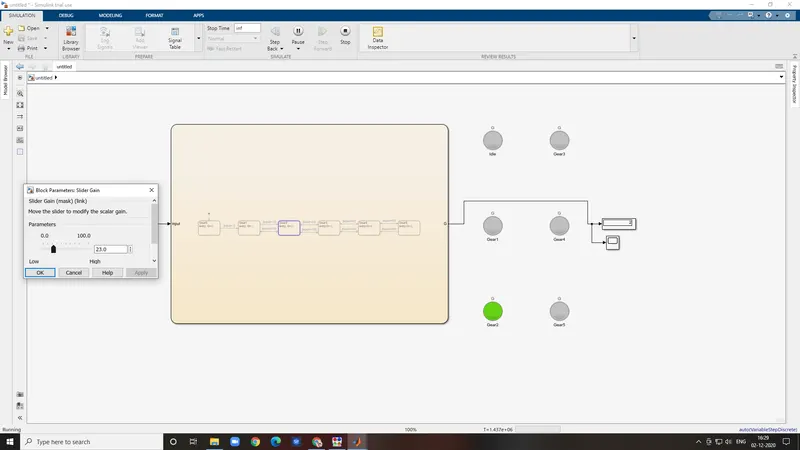
A slider gain block has been used to input the varying speed data to the stateflow chart. The data is input to the chart from the input port. Conditions for the gear shift has been clearly defined into the chart as given in the study. Lamp block has been used to depict the different gears and the slider is moved accordingly to achieve gear shift. The lamps very clearly show the different gears at different speed for a particular instance of time. The simulation has been done in real time to achieve more clear and understandable results. Gear shifts for different speed ranges can been seen in the below attached figures.
For speed range: 0-15kmph
For speed range: 16-25kmph
For speed range: 26-40kmph
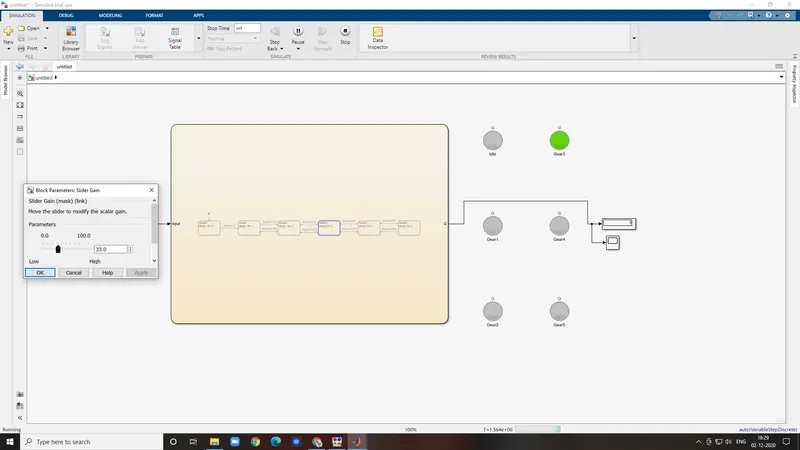
For speed range: 41-60kmph
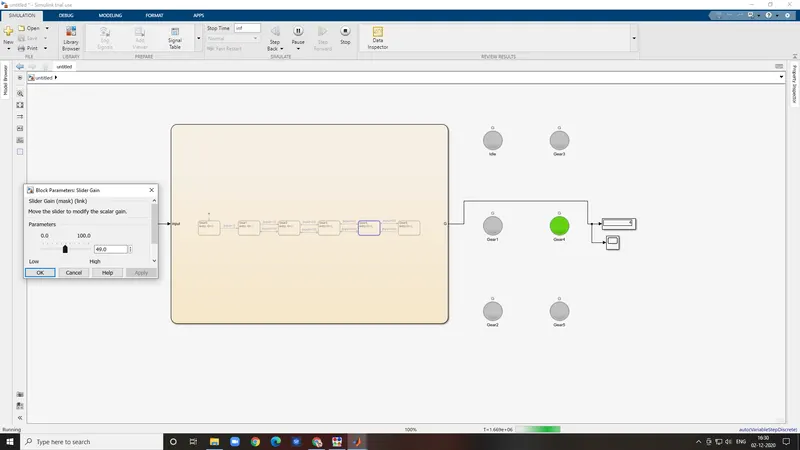
For speed: Above 60kmph
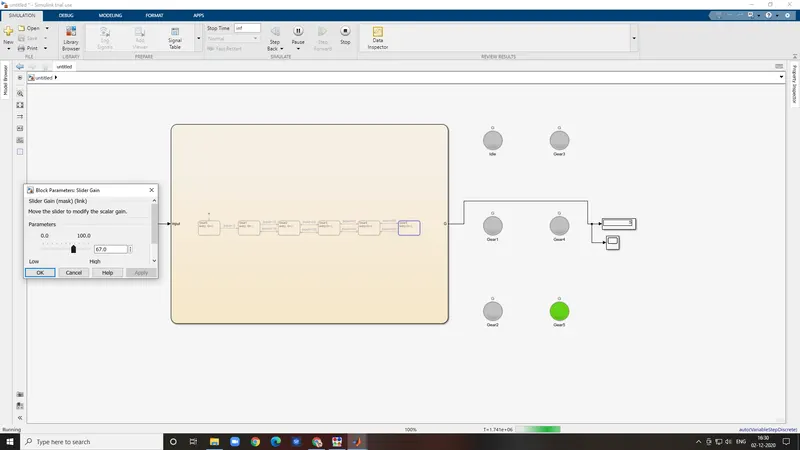
Result:
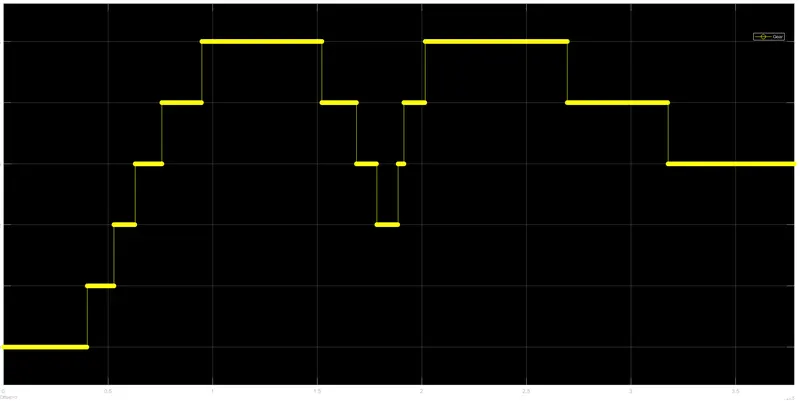
Below is the curve for Gear shift with respect to time.
Conclusion:
From the above graph the variation in the gear shift can be seen clearly.