Week 4.1 - Solving second order ODEs
AIM :-Solving second order ODEs
Theory:- This ODE represents the equation of motion of a simple pendulum with damping
`(d^2(theta))/dt^2+(b/m)*(d(theta))/dt+g/lsin(theta)=0`
`theta1=(d(theta))/dt`
`(d(theta1))/dt=theta2`
`theta2=-(b/m*theta1+g/l*sin(theta))`
In the above equation,
g = gravity in m/s2,
L = length of the pendulum in m,
m = mass of the ball in kg,
b=damping coefficient.
CODE IN METLAB:
Here
L=1 metre,
m=1 kg,
b=0.05.
g=9.81 m/s2.
clear all
close all
clc
b=0.05;
g=9.81;
l=1;
m=1;
%inicial condition
theta_0=[0;3];
%time point
t_span=linspace(0,20,500);
%solve ODE
[t,results]=ode45(@(t,theta) ode_function(t,theta,b,g,l,m),t_span,theta_0);
figure(1)
plot(t,results(:,1))
hold on
plot(t,results(:,2))
ylabel('plot')
xlabel('time')
%inputs2
theta=results(:,1)
x0=0;
y0=0;
ct=1
for i=1:length(theta)
            x1=l*sin(theta(i))
            y1=-l*cos(theta(i))
    figure(2)
    plot([-1 1],[0 0])
    hold on
    plot([x0 x1],[y0 y1],'marker','o','MarkerIndices',2,'MarkerFaceColor','red','MarkerSize',15)
    hold off
    axis([-1 1 -1 1])
    pause(0.003)
    M(ct)=getframe(gcf);
    ct=ct+1;
end
movie(M)
videofile=VideoWriter('challenge4_1.avi','Uncompressed AVI');
open(videofile)
writeVideo(videofile,M)
close(videofile)function [dtheta_dt]=ode_function(t,theta,b,g,l,m)
theta1=theta(1);
theta2=theta(2);
dtheta1_dt=theta2;
dtheta2_dt=-(b/m)*theta2-(g/l)*sin(theta1);
dtheta_dt=[dtheta1_dt;dtheta2_dt];
endOUT PUT OF METLAB CODE:
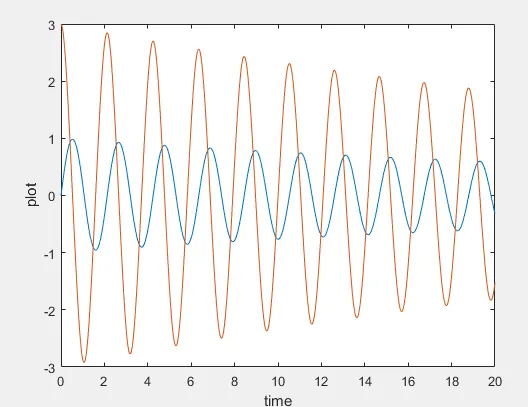
Plot of in between time anglar displacement and angler velocity .
Stimulated vedio :
CODE EXPLANATIONS:
clear all:It remove all the variables stored in the current workspace.
close all:It close all the fig window opened if any from previous execution .
clc: This clear all the text from the commond windows.