Project 1 - Parsing NASA thermodynamic data
AIM-: Parsing NASA thermodynamic data .
What is file parsing:
Parsing is nessery because diffrent application need tha data to be in deffrent form .parsing allows transform of data in a way that can be understand by secific softwear .
Step followed to read the data in 'NASA thermodynamic data':
1.file reader .
2.extraction of local tempreture .
3.extraction of co-efficent value .
4.calculate cp,H,s .
5.plotting and saveing the fig .
6.calculate molecular weight .
code to plot cp H S the
clear all
close all
clc
f1=fopen('THERMO.dat','r');
%External date from speciesblock
for i=1:5
    fgetl(f1);
end
for i=1:53
%extract the specise name
line=fgetl(f1);
line=strsplit(line,' ');
n=length(line)
specise=line{1}
local_low_tempreture=str2num(line{(n-3)})
local_high_tempreture=str2num(line{(n-2)})
local_mid_tempreture=str2num(line{(n-1)})
%extract the co_efficent line1
line1=fgetl(f1);
posE=strfind(line1,'E');
a1=line1(1:posE(1)+3);
a1=str2num(a1)
a2=line1(posE(1)+4:posE(2)+3);
a2=str2num(a2)
a3=line1(posE(2)+4:posE(3)+3);
a3=str2num(a3)
a4=line1(posE(3)+4:posE(4)+3);
a4=str2num(a4)
a5=line1(posE(4)+4:posE(5)+3);
a5=str2num(a5)
%extract the co_efficent line2
line2=fgetl(f1);
posE=strfind(line2,'E');
a6=line2(1:posE(1)+3);
a6=str2num(a6)
a7=line2(posE(1)+4:posE(2)+3);
a7=str2num(a7)
a8=line2(posE(2)+4:posE(3)+3);
a8=str2num(a8)
a9=line2(posE(3)+4:posE(4)+3);
a9=str2num(a9)
a10=line2(posE(4)+4:posE(5)+3);
a10=str2num(a10)
%extract the co_efficent line3
line3=fgetl(f1);
posE=strfind(line3,'E');
a11=line3(1:posE(1)+3);
a11=str2num(a11)
a12=line3(posE(1)+4:posE(2)+3);
a12=str2num(a12)
a13=line3(posE(2)+4:posE(3)+3);
a13=str2num(a13)
a14=line3(posE(3)+4:posE(4)+3);
a14=str2num(a14)
%find the value of cp,h,s .
T_array=linspace(local_low_tempreture,local_high_tempreture,10);
for j= 1:length(T_array)
    T=T_array(j)
    if T<=local_mid_tempreture
        cp(j)=(a8+a9*T+a10*(T^2)+a11*(T^3)+a12*(T^4))*287.05
        H(j)=(a8+a9*(T/2)+a10*((T^2)/3)+a11*((T^3)/4)+a12*((T^4)/5)+(a13/T))*8.13
        s(j)=(a8*log(T)+a9*T+a10*(T^2)/2+a11*(T^3)/3+a12*(T^4)/4+a14)*287.05
    else
        cp(j)=(a1+a2*T+a7*(T^2)+a4*(T^3)+a5*(T^4))*287.05
        H(j)=(a1+a2*(T/2)+a3*((T^2)/3)+a4*((T^3)/4)+a5*((T^4)/5)+(a6/T))*8.13
        s(j)=(a1*log(T)+a2*T+a3*(T^2)/2+a4*(T^3)/3+a5*(T^4)/4+a7)*287.05
    end
end
%ploting and searing of the result
cd('C:\Users\Dell\Desktop\Nasa')
mkdir(specise)
cd(specise)
figure(1)
plot(T_array,cp)
saveas(figure(1),'variation of cp wrt temp.jpg')
figure(2)
plot(T_array,H)
saveas(figure(1),'variation of H wrt temp.jpg')
figure(3)
plot(T_array,s)
saveas(figure(1),'variation of S wrt temp.jpg')
cd ..\
end
EXPLANATION OF CODE
'f1=fopen('THERMO.dat','r');' Is use to open nd read the data .
'fgetl(f1);' is use run the data line by line .
for i=1:5
    fgetl(f1);
end
Is use read all the first five line one by one ,because we have to read 6th line for extract the date .
line=fgetl(f1);
line=strsplit(line,' ');
n=length(line)
specise=line{1}
local_low_tempreture=str2num(line{(n-3)})
local_high_tempreture=str2num(line{(n-2)})
local_mid_tempreture=str2num(line{(n-1)})
'line=strsplit(line,' ');' Is use to split the string (the 6th line which is a single string ) ,where the 'space' found .The extract the data spacise name and local temperature.
'str2num(line{(n-3)})' Is use to convert string to numaric .
%extract the co_efficent line1
line1=fgetl(f1);
posE=strfind(line1,'E');
a1=line1(1:posE(1)+3);
a1=str2num(a1)
a2=line1(posE(1)+4:posE(2)+3);
a2=str2num(a2)
a3=line1(posE(2)+4:posE(3)+3);
a3=str2num(a3)
a4=line1(posE(3)+4:posE(4)+3);
a4=str2num(a4)
a5=line1(posE(4)+4:posE(5)+3);
a5=str2num(a5)
Read the next line and the extract the co_efficent then this way we read the next two line and and get the othe co-efficent .
'posE=strfind(line1,'E');' is use find a string.
for j= 1:length(T_array)
    T=T_array(j)
    if T<=local_mid_tempreture
        cp(j)=(a8+a9*T+a10*(T^2)+a11*(T^3)+a12*(T^4))*287.05
        H(j)=(a8+a9*(T/2)+a10*((T^2)/3)+a11*((T^3)/4)+a12*((T^4)/5)+(a13/T))*8.13
        s(j)=(a8*log(T)+a9*T+a10*(T^2)/2+a11*(T^3)/3+a12*(T^4)/4+a14)*287.05
    else
        cp(j)=(a1+a2*T+a7*(T^2)+a4*(T^3)+a5*(T^4))*287.05
        H(j)=(a1+a2*(T/2)+a3*((T^2)/3)+a4*((T^3)/4)+a5*((T^4)/5)+(a6/T))*8.13
        s(j)=(a1*log(T)+a2*T+a3*(T^2)/2+a4*(T^3)/3+a5*(T^4)/4+a7)*287.05
    end
end
Create a array of temperature (local low to high temperature) Then calculate the value of cp.H,S .
%ploting and searing of the result
cd('C:\Users\Dell\Desktop\Nasa')
mkdir(specise)
cd(specise)
figure(1)
plot(T_array,cp)
saveas(figure(1),'variation of cp wrt temp.jpg')
figure(2)
plot(T_array,H)
saveas(figure(1),'variation of H wrt temp.jpg')
figure(3)
plot(T_array,s)
saveas(figure(1),'variation of S wrt temp.jpg')
cd ..\
'cd' function change the folder .
'cd ..\' Return bake to the folder .
'mkdir(specise)' Create folder in the specise name .
'saveas(figure(1),'variation of cp wrt temp.jpg')' is use to save the figure in as 'jpg' format .
Metlab code for find molecular weight:
clear all
close all
clc
f1=fopen('THERMO.dat','r');
%External date from speciesblock
for i=1:5
    fgetl(f1);
end
for i=1:53
%extract the specise name
line=fgetl(f1);
line=strsplit(line,' ');
n=length(line)
specise=line{1}
element=["C","H","O","N","A"]
A=[12,1,16,32,38]
M_weight=0;

for k=1:length(specise)
    for j=1:length(element)
        if strcmpi(specise(k),element(j))
            M_weight=M_weight+A(j)
            pos = j;
        end
    end
        s= str2num(specise(k));
        if(s>0)
        M_weight=M_weight+(A(pos)*(s-1))
        s=0
        end
        Mw(i)=M_weight
end
for m=1:3
    fgetl(f1);
end
end
'strcmpi(specise(k),element(j))' Is use to compare the string
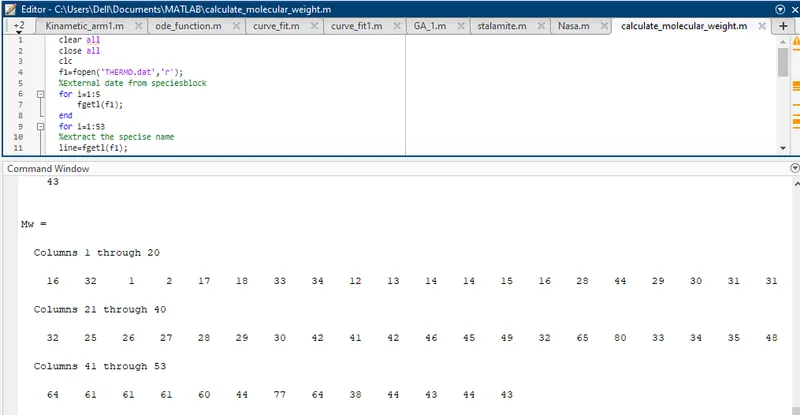
Molecular weight of the 53 molecules:
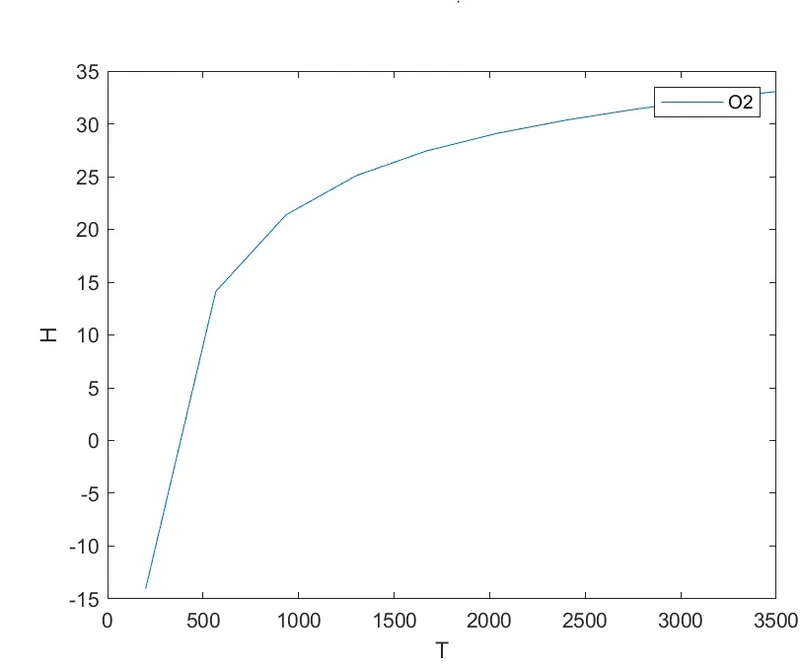
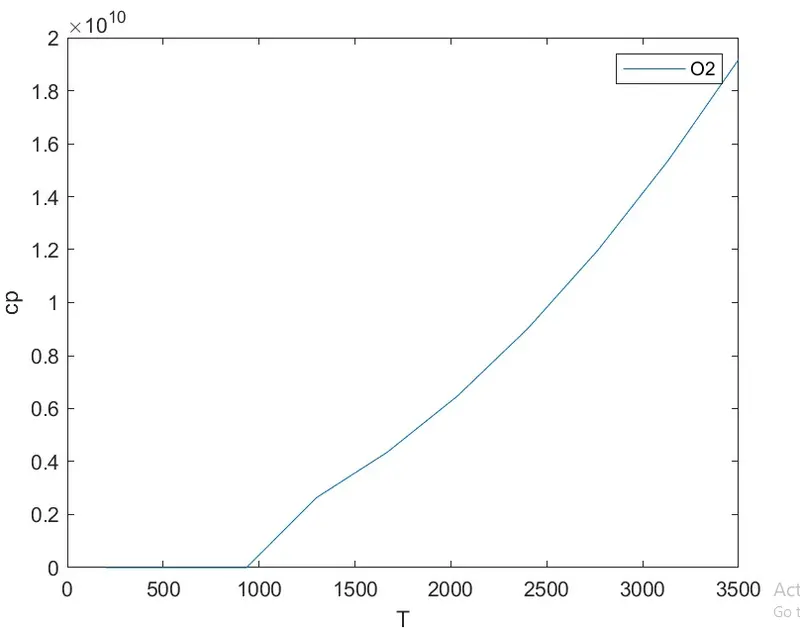
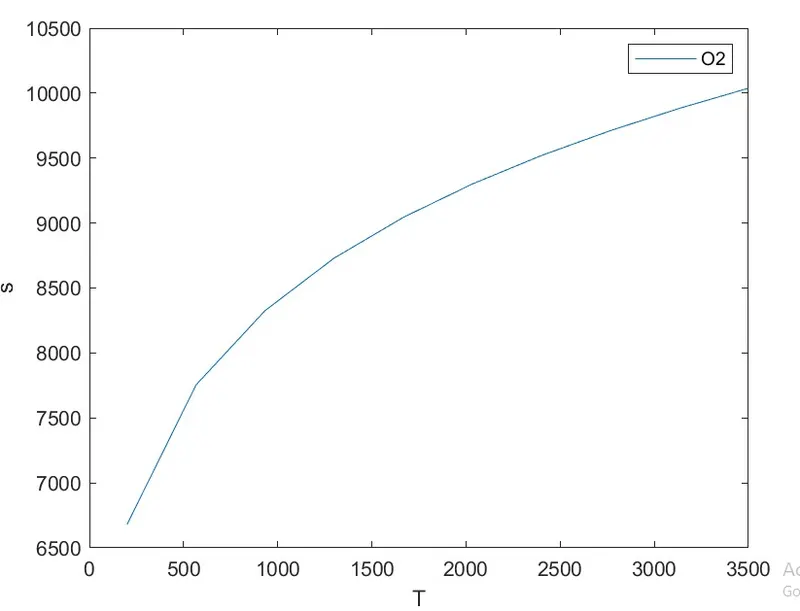
Plot of O2
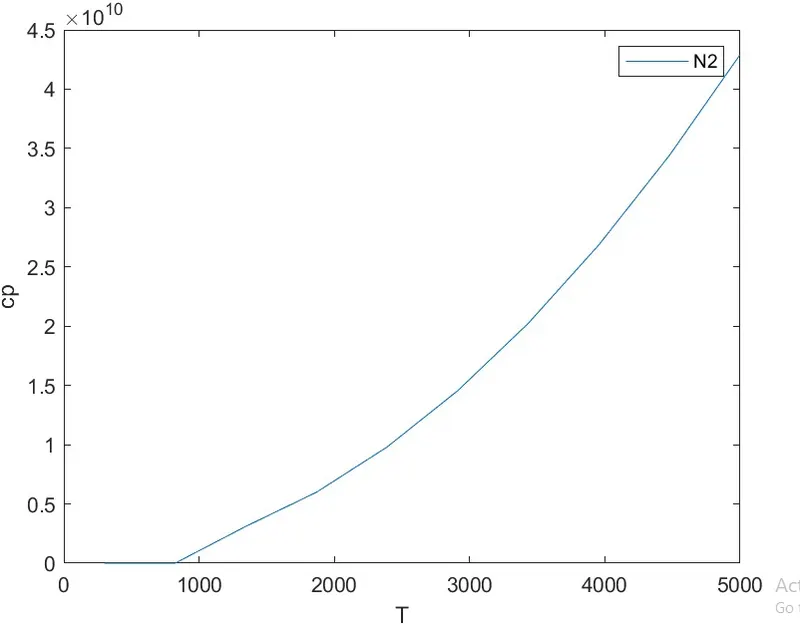
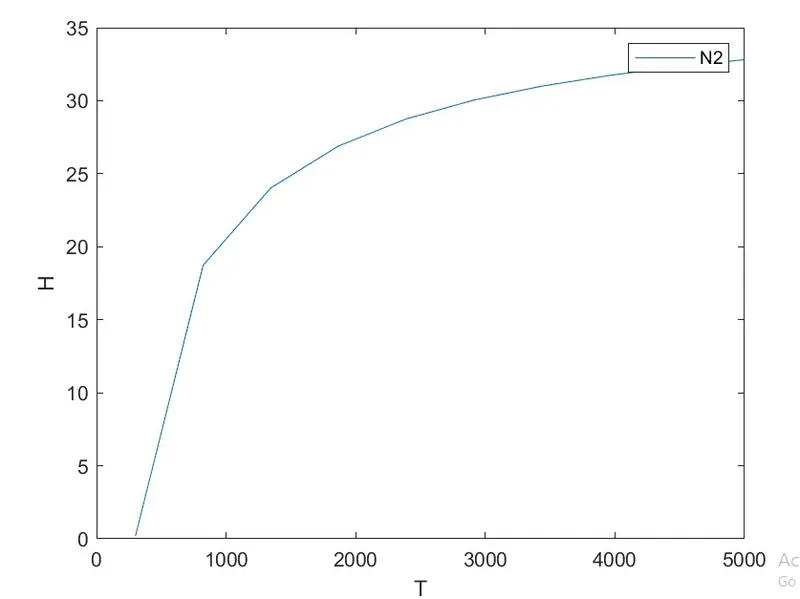
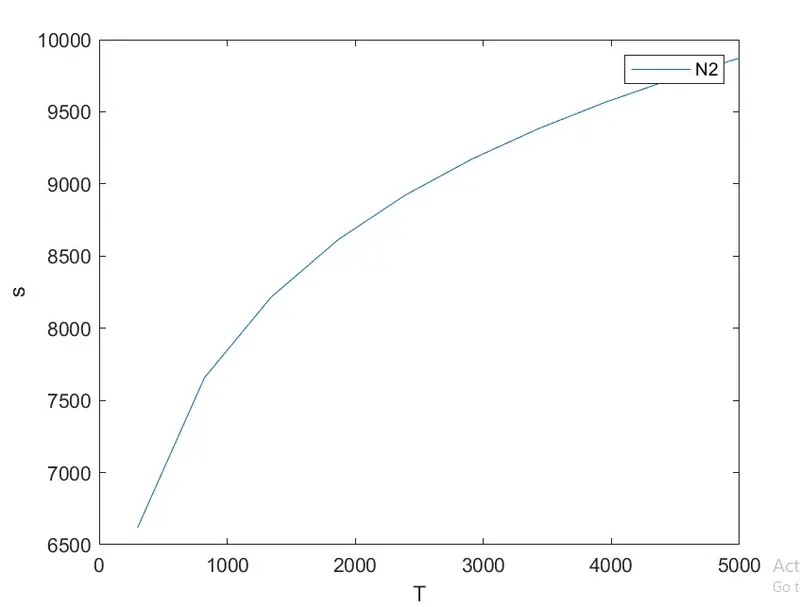
Plot N2
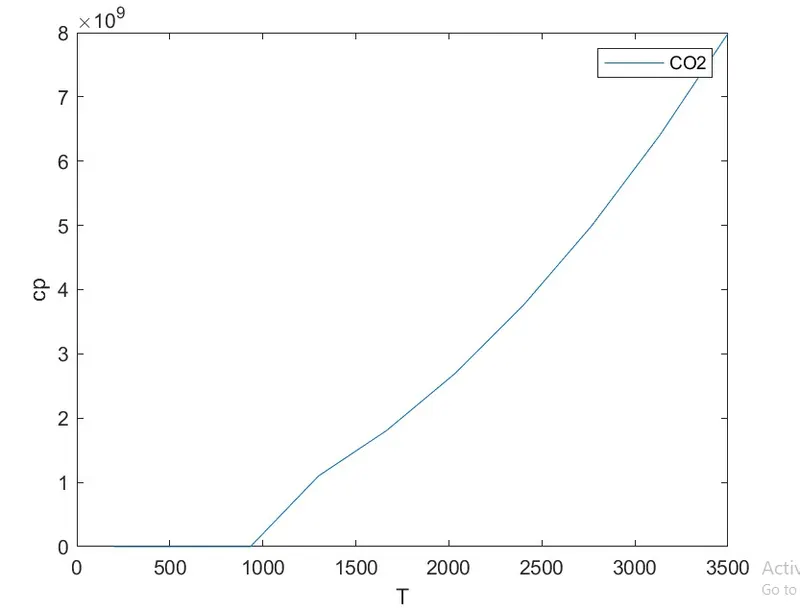
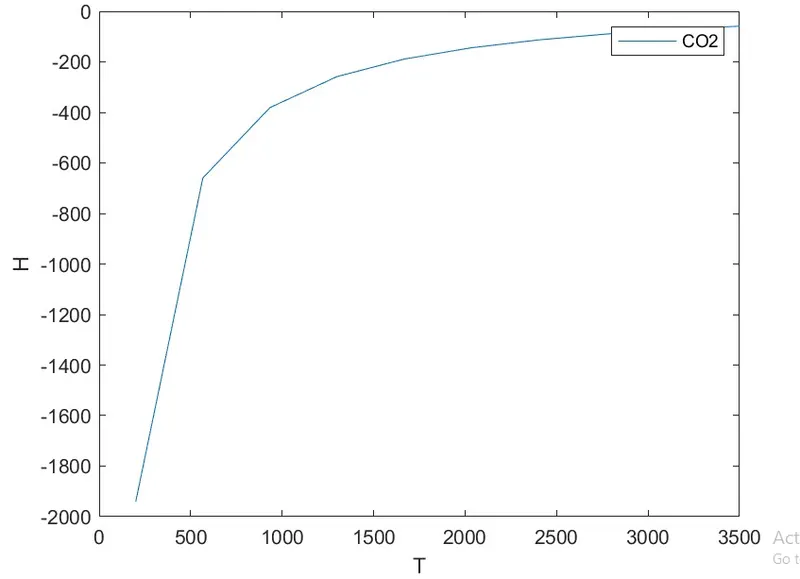
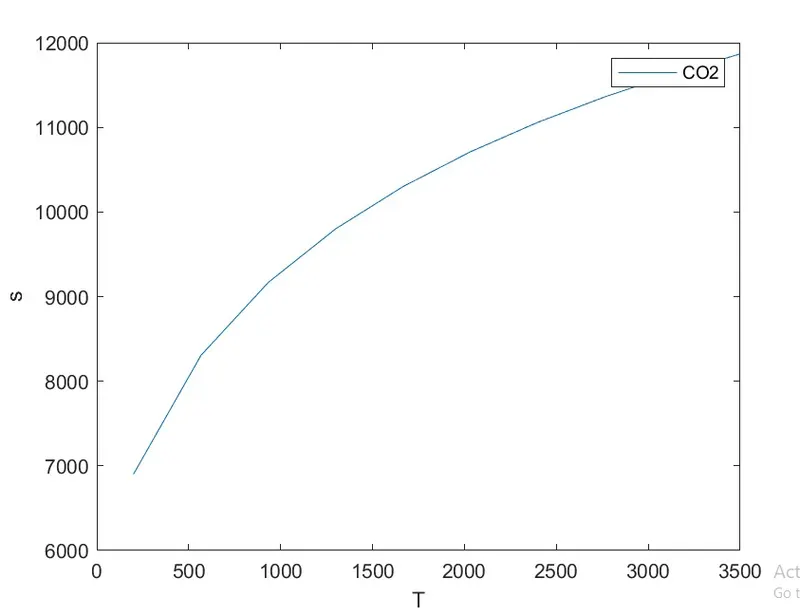
Plot C02
Output of Metlab code:
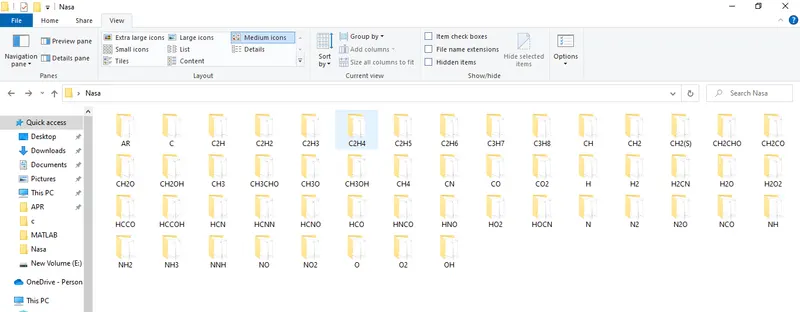
Plot of 53 molecules