Week 4.1: Project Steady state simulation of flow over a throttle body
Project: Steady-state simulation of flow over a throttle body
Answer
The Geometry. This is a simple 3D geometry of a throttle body, which is mainly used to control the air flow passing through it.
Here is a basic simulation depicting velocity and pressure of the fluid passing through it.
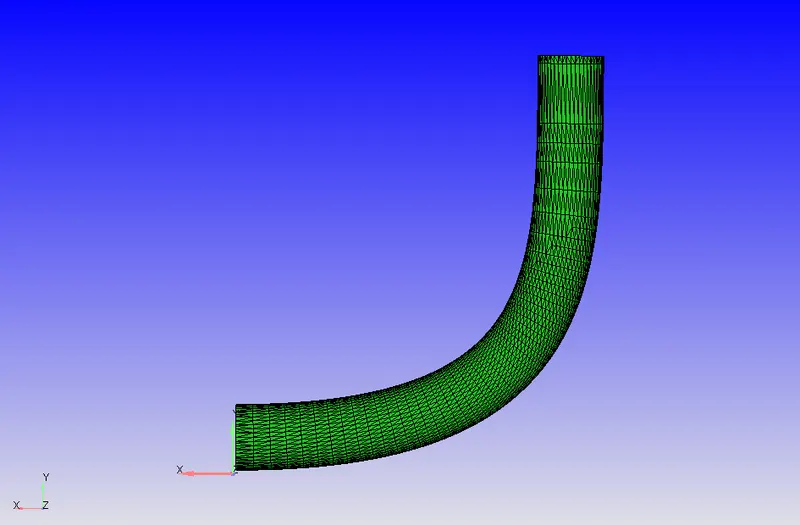
For the first, we need to scale down the geometry to a scale factor of 0.001.
The Geometry which we have has got some thickness, for this kind of fluid flow simulation, the thickness is not considered. So we are going to delete the thick layer of the geometry.
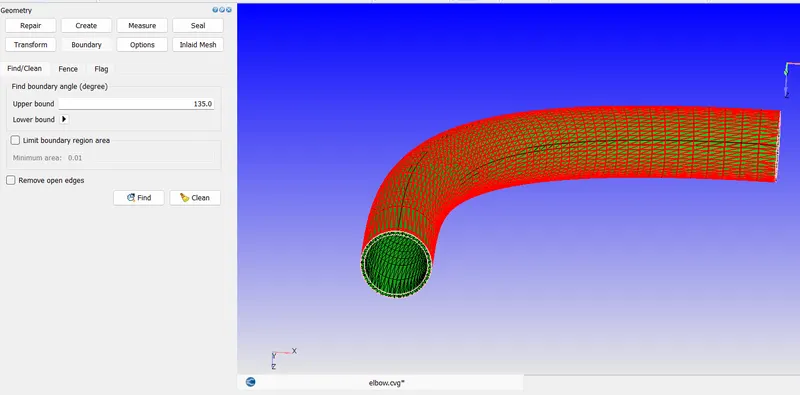
Finally we get a thin layer material with zero thickness.
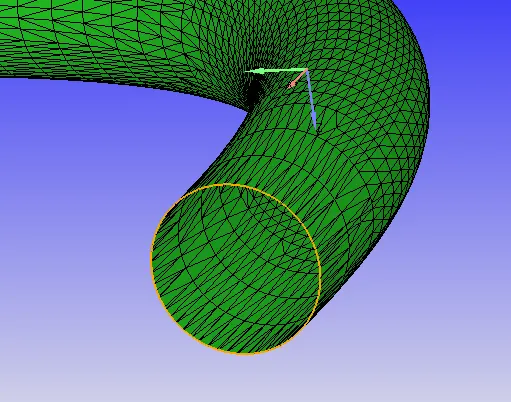
Now, we need to close each open side of the geometry.
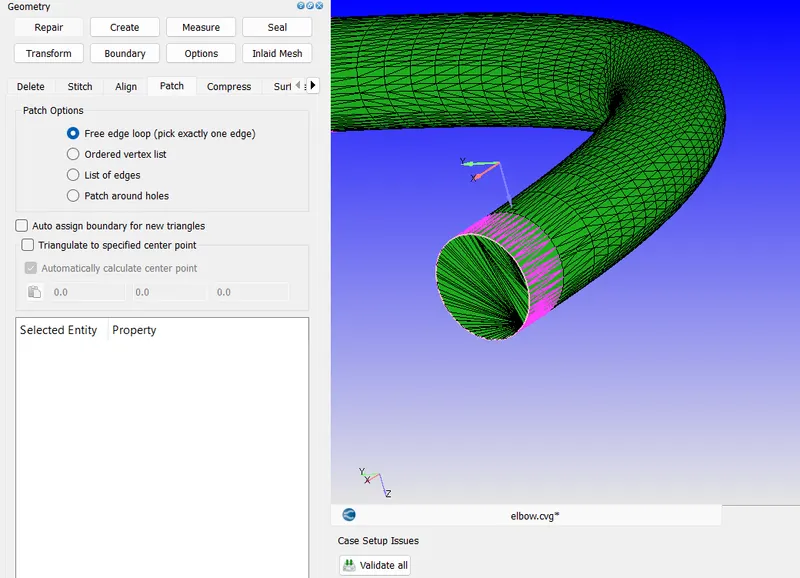
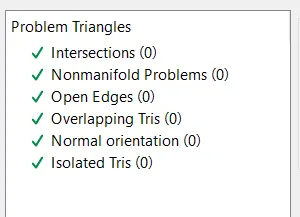
Now we have done a Diagnosis check and zero error is obtained.
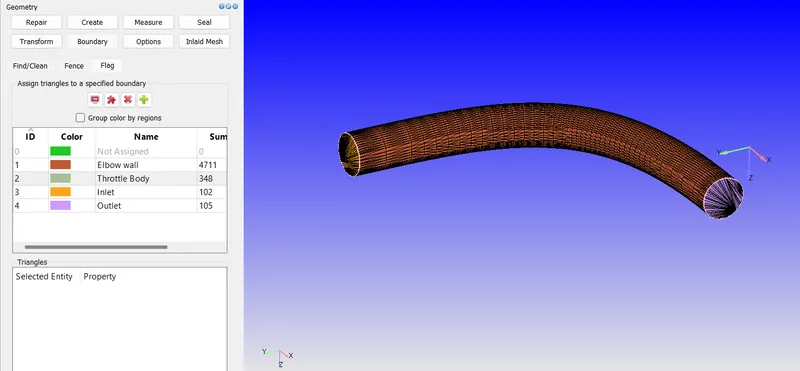
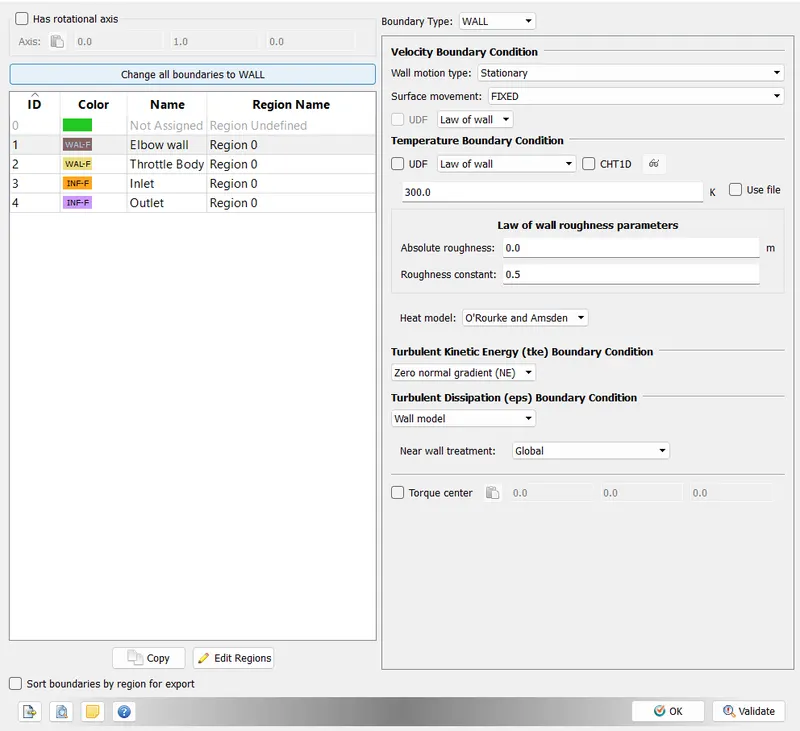
The next part is boundary assigning, here we assign 5 boundaries to this geometry as follows including the throttle body located inside.
Here we began to set up the case tree.
We started off with setting up the Transient option
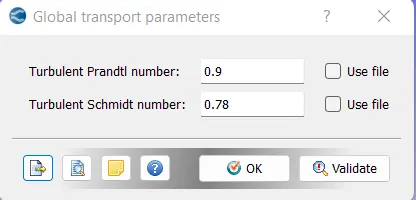
The global transport parameter is set to default.
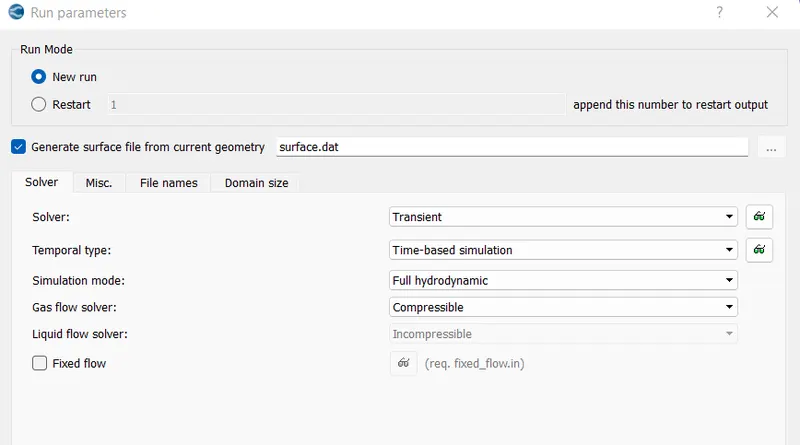
In run parameter, solver is assigned as Transient type since we have to consider the motion of the throttle body.
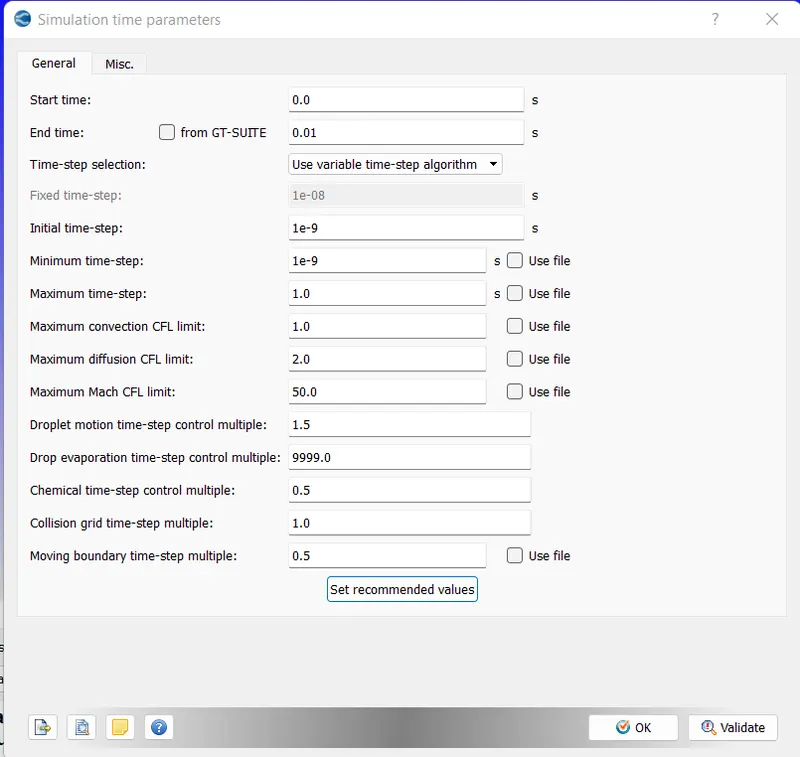
The simulation time parameters is set as follows.
The Boundary Condition
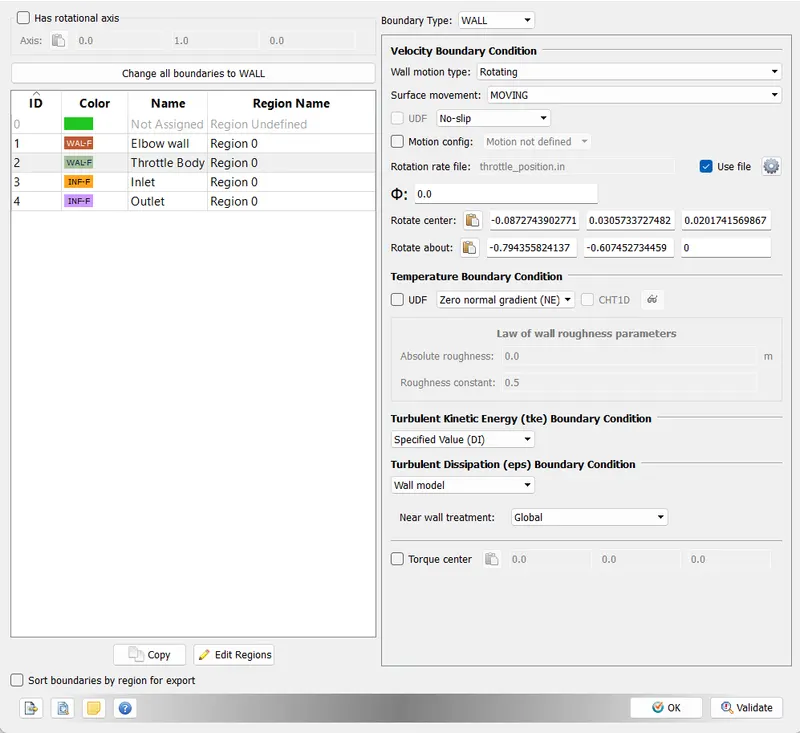
to find the center of rotation of the throttle body we take the center part of the throttle body, that is the one shown in the below image
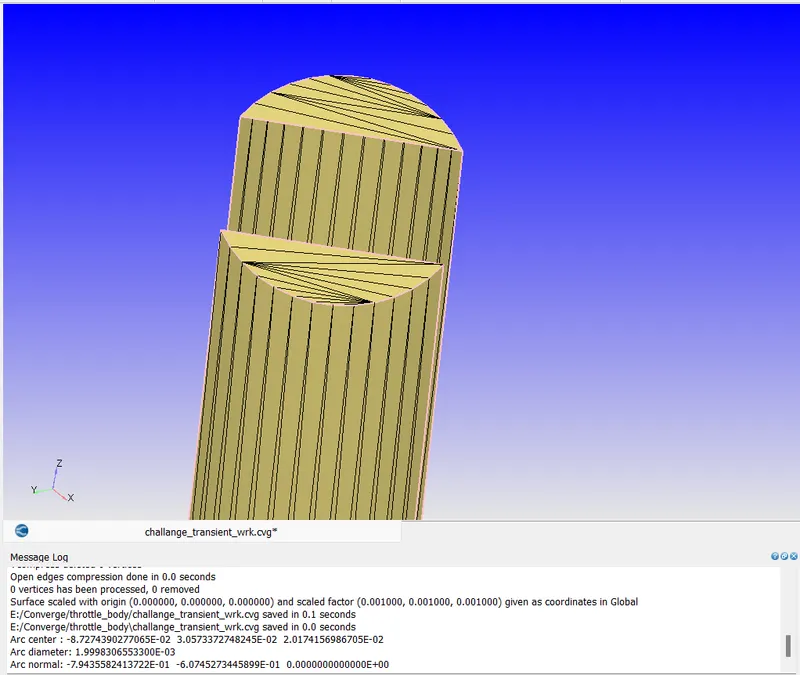
From here the Arc centre and Arc Normal is taken and is pasted on the Boundary condition of the Throttle body.
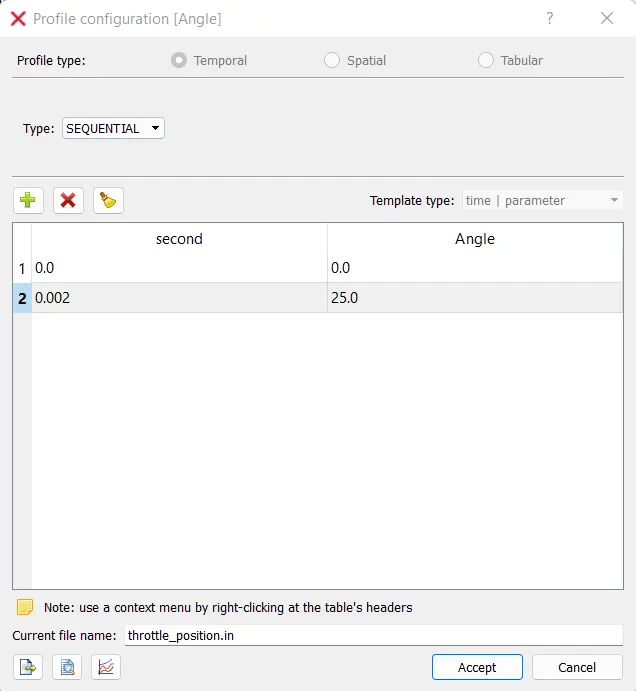
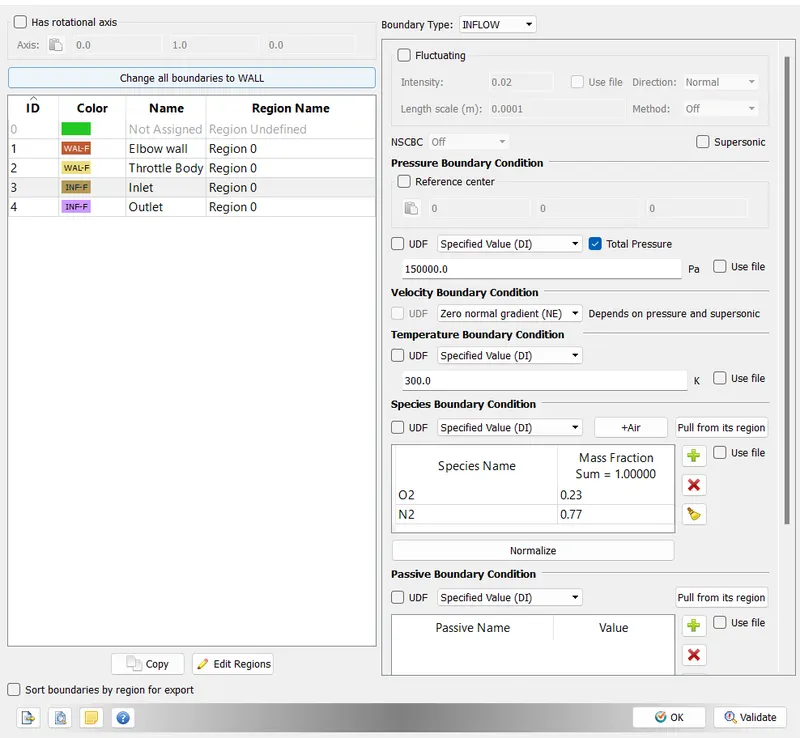
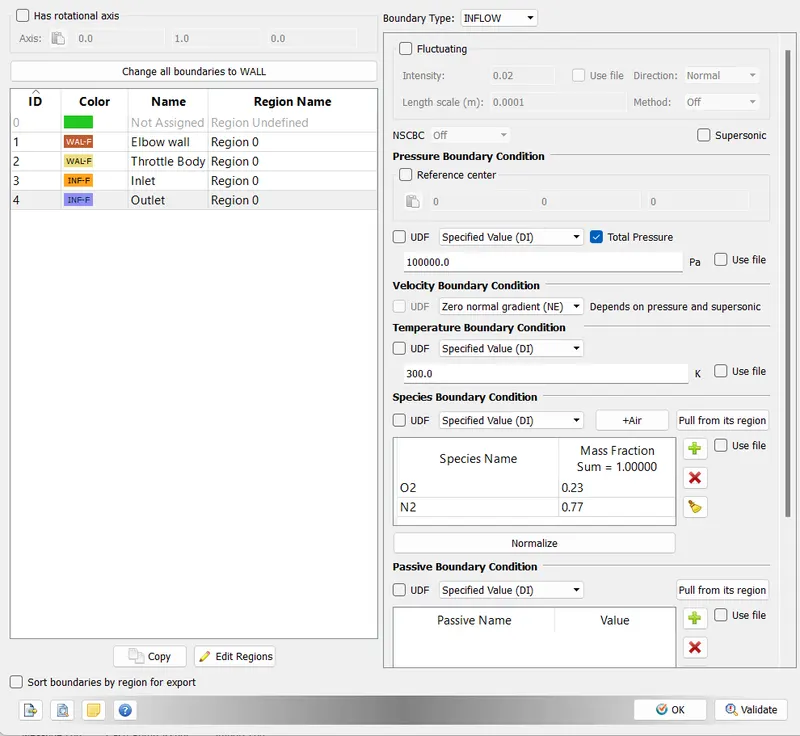
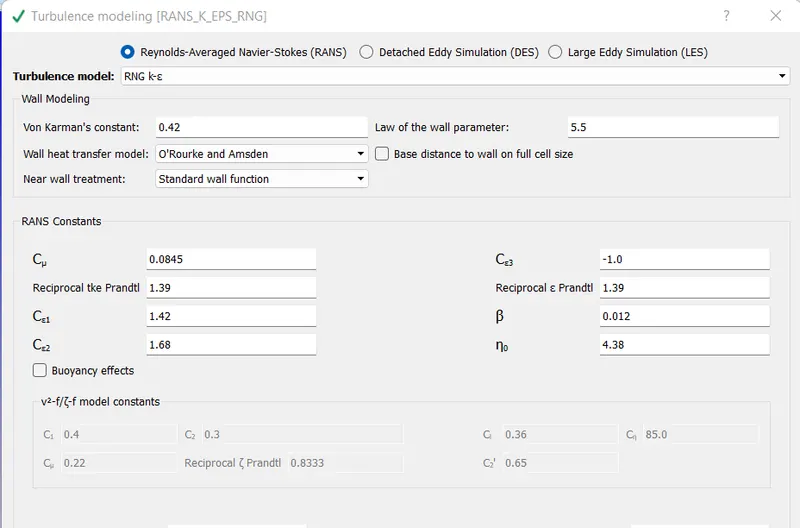
The turbulence modeling is set as default.
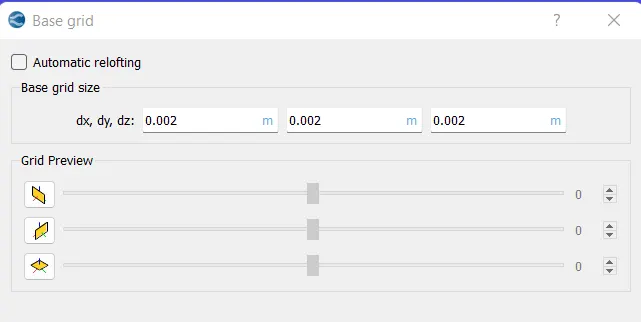
The Grid size
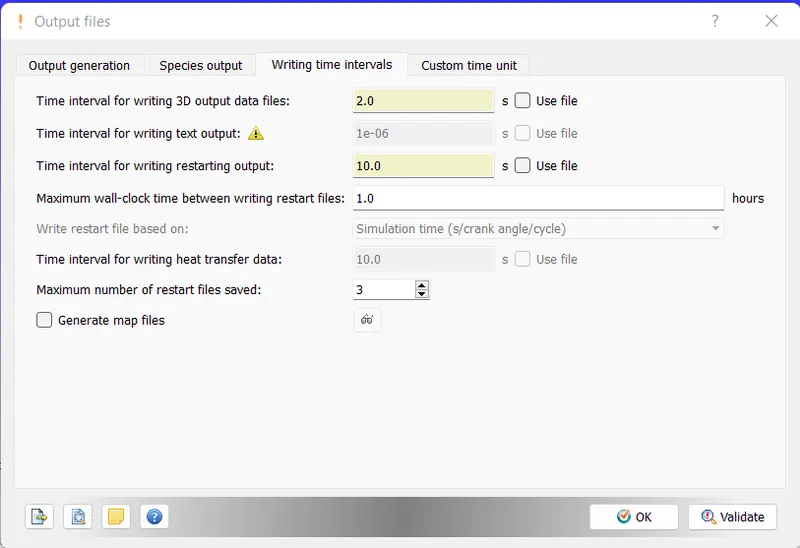
The Output files.
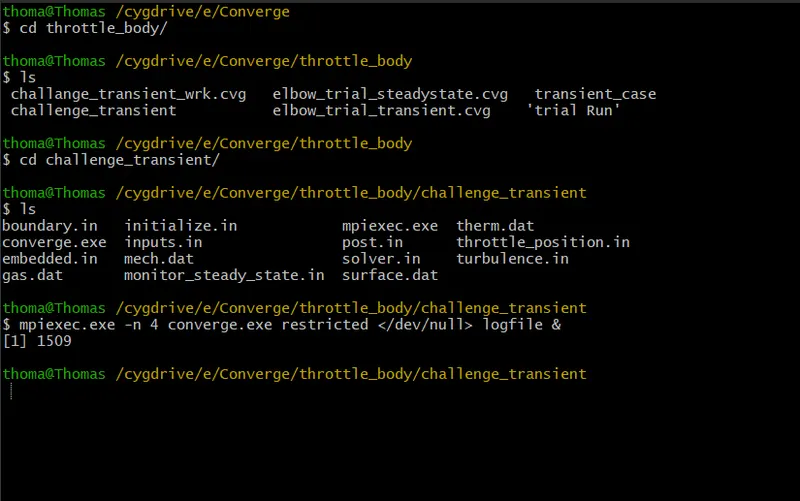
Now, inorder to run the simulation we run the exported files using cygwin
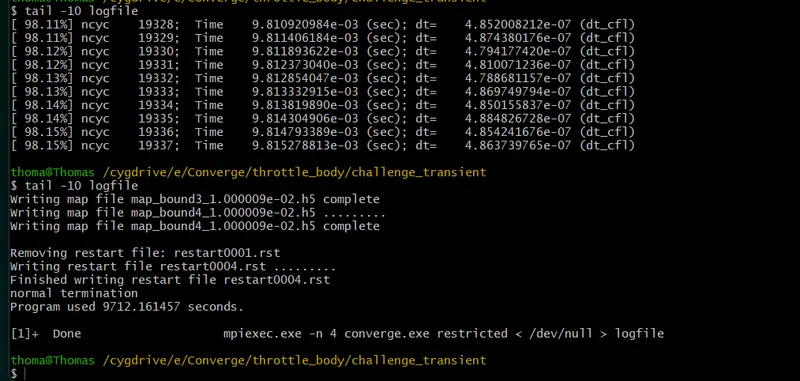
and the simulation was successfull
To post process the results, first we need to convert the vkt binary format files to paraview readeble format.
In paraview..
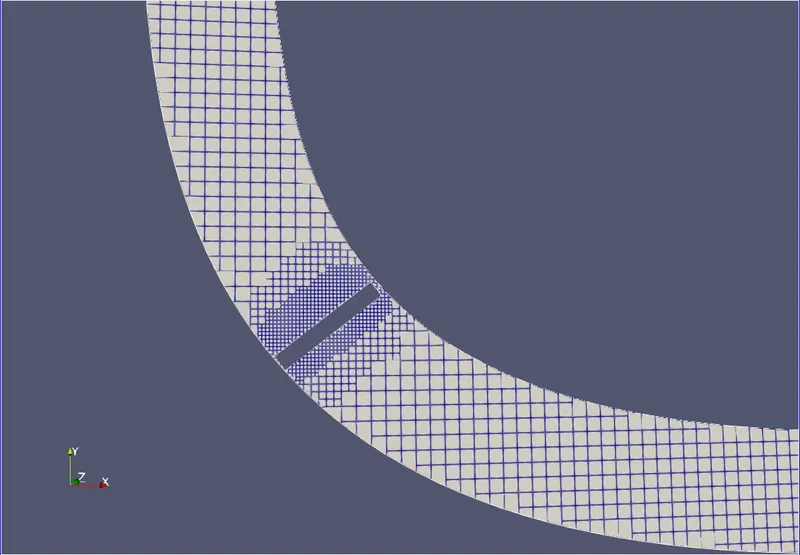
The mesh diagram of the geometry with the fixed embedding is clearly visible around the throttle body. Fixed Embedding is used to get a refined analysis results around the throttle body.
RESULTS
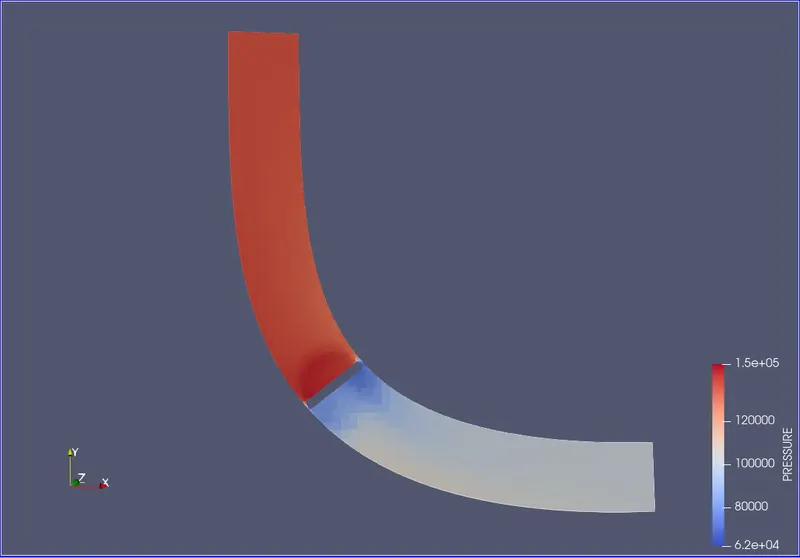
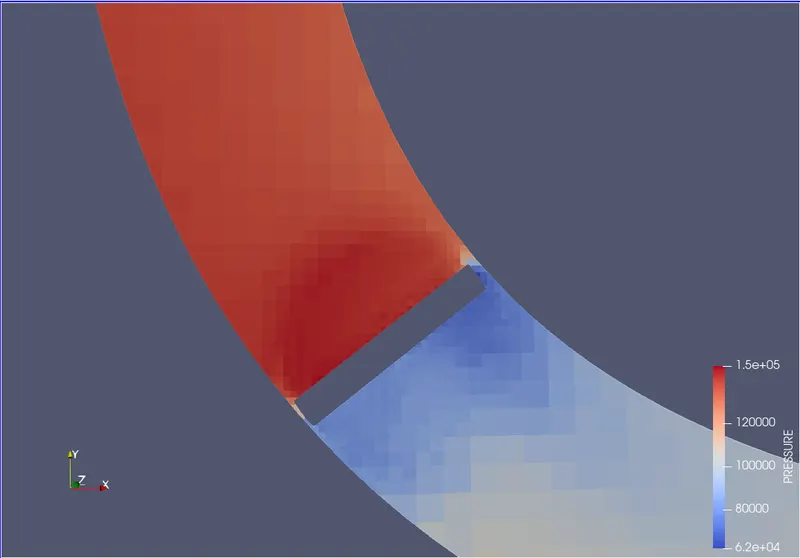
The Pressure Contour
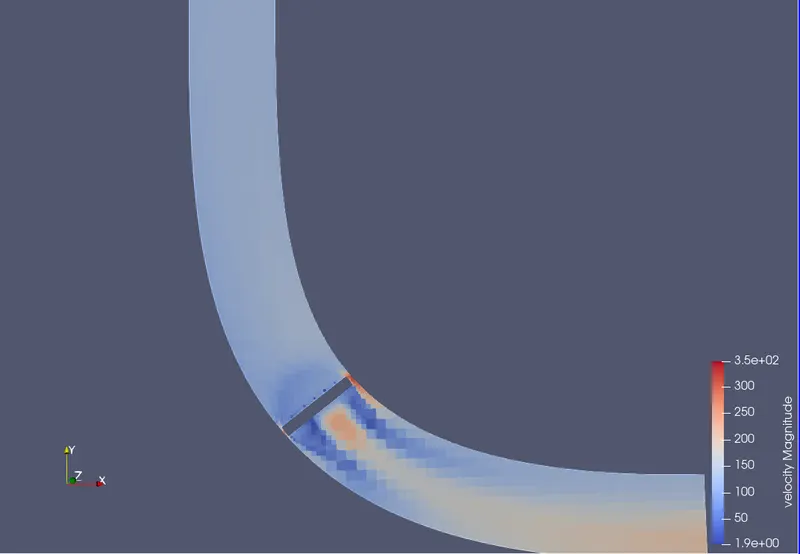
Velocity Contour
LINE PLOT
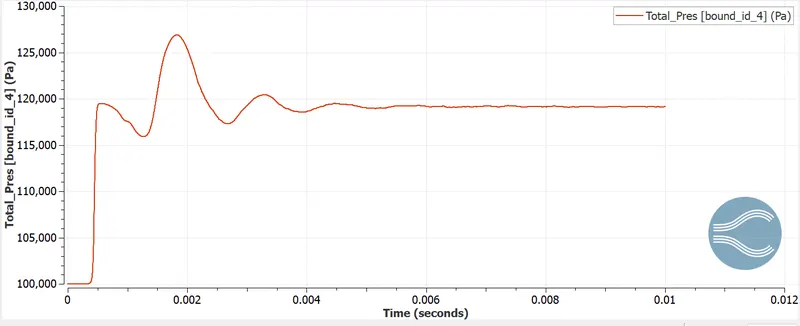
Total Pressure Line plot at the Outlet
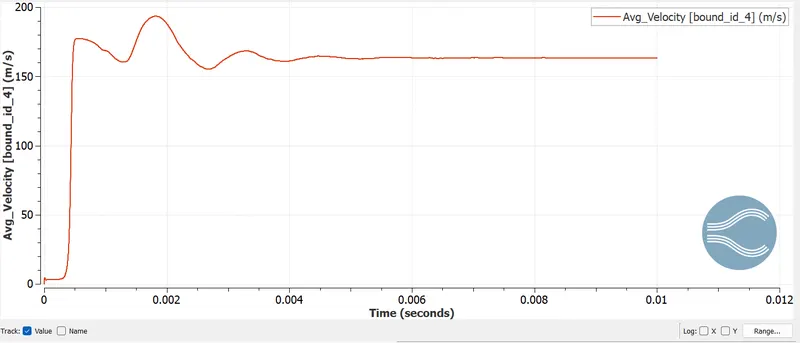
Average velocity at the outlet
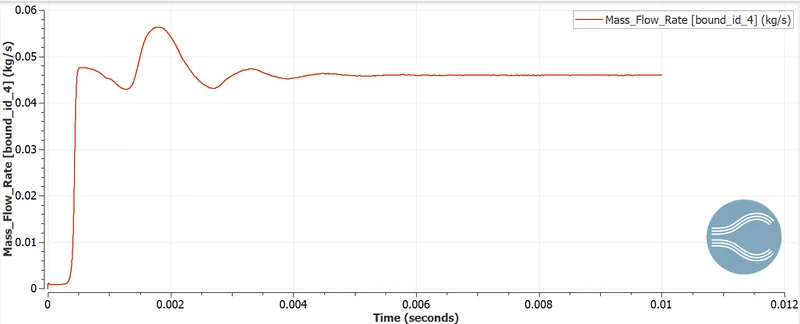
Mass Flow rate at Outlet
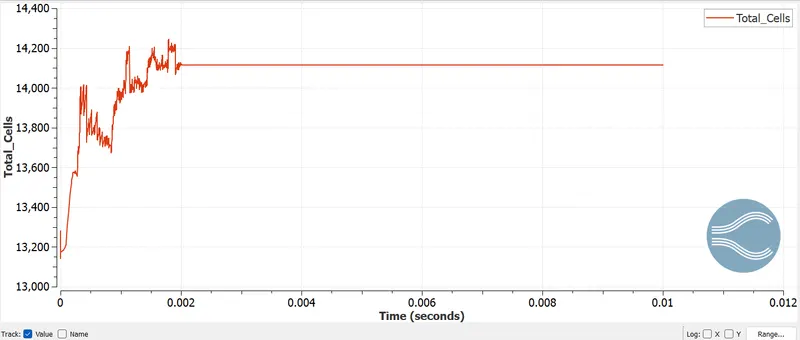
Total cell Plot
Thank You!