Week 4.1: Project Steady state simulation of flow over a throttle body
Steady-state simulation over a throttle body-
objective
- run simulation over a throttle body
- show velocity and pressure contour and see how velocity and pressure is varying along the geometry
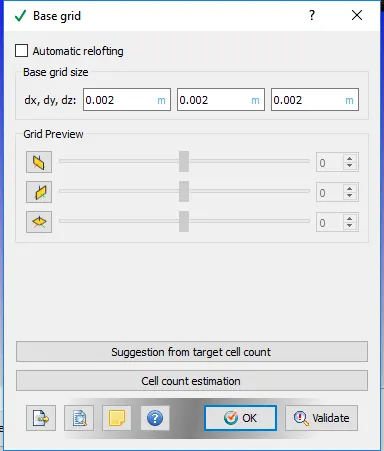
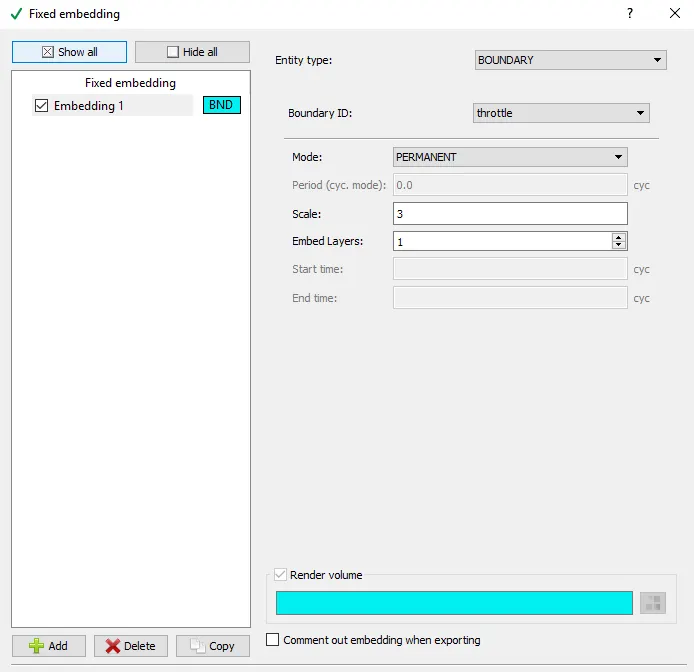
- use grid size of 0.002 along with fixed embedding around throttle boundary
figure
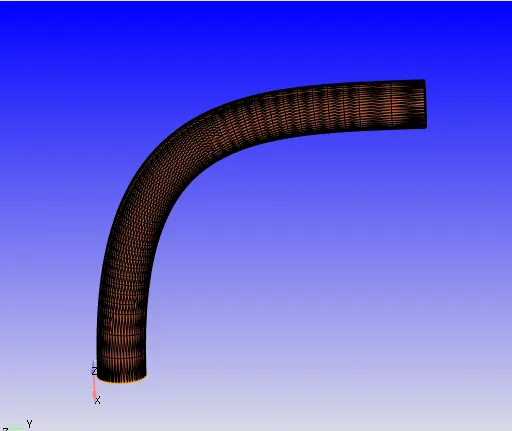
setup-
application type - Time based
material - air
simulation parameters
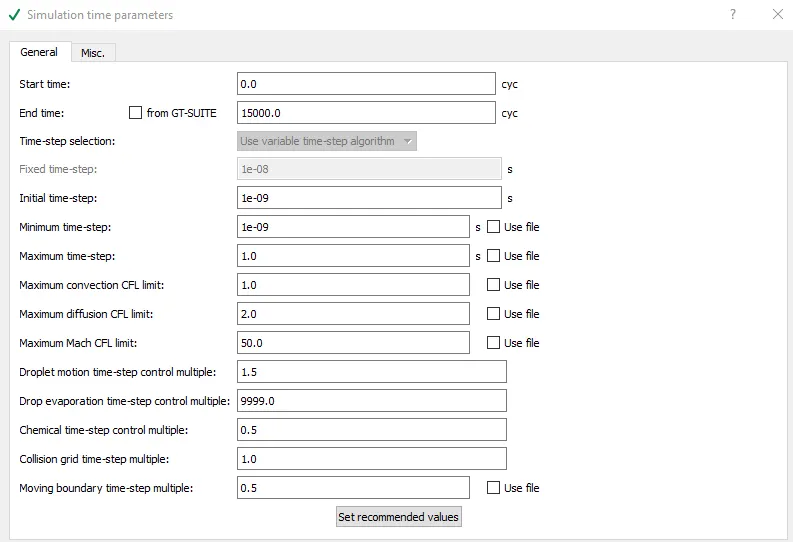
- run parameters - steady state, full hydrodynamic
- steady state monitor
- start time - 0
- end time - 15000 cycles
- min time step - 1e-9
- max time step - 1
- cfl number - 1
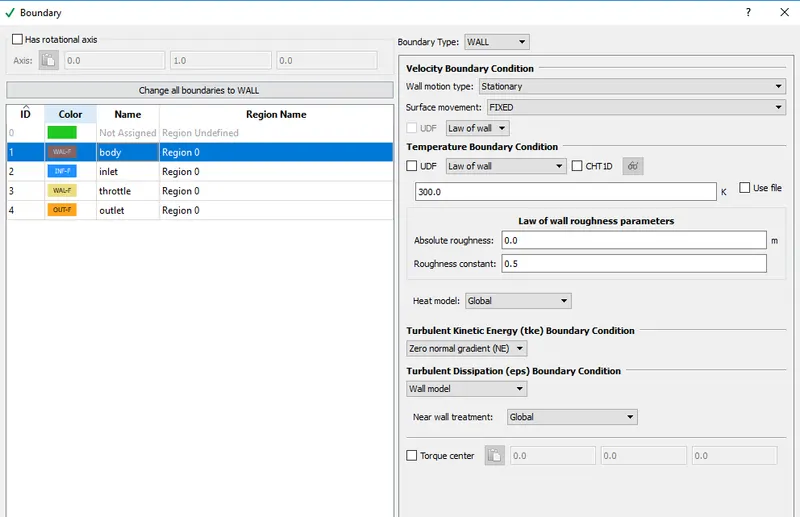
Boundary condition
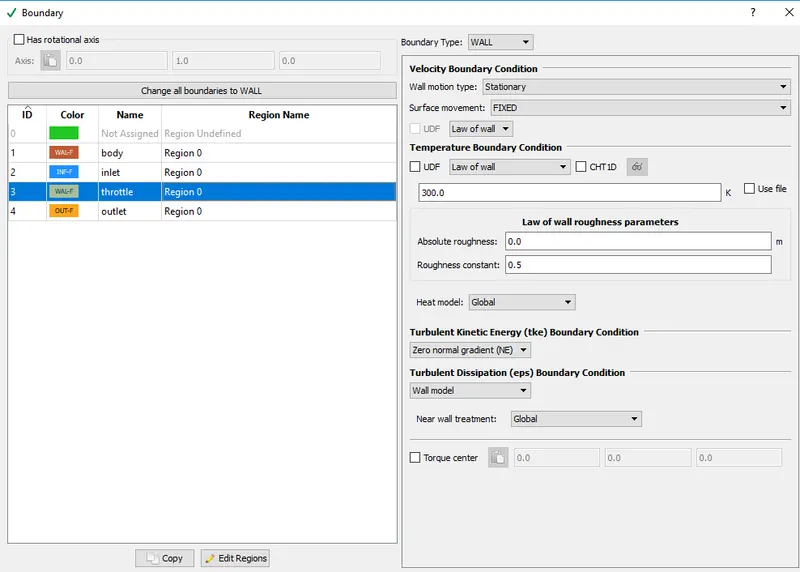
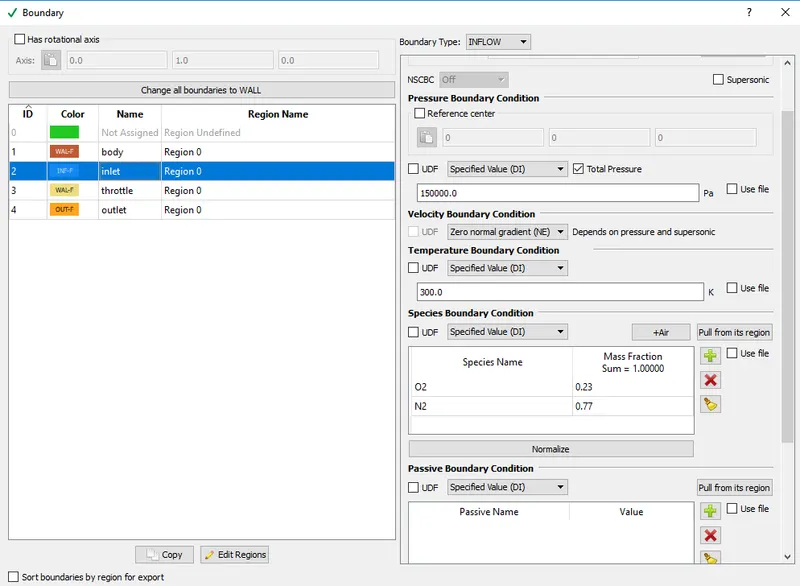
- Inlet - inflow
- outlet - outflow
- body - law of wall
- throttle - law of wall
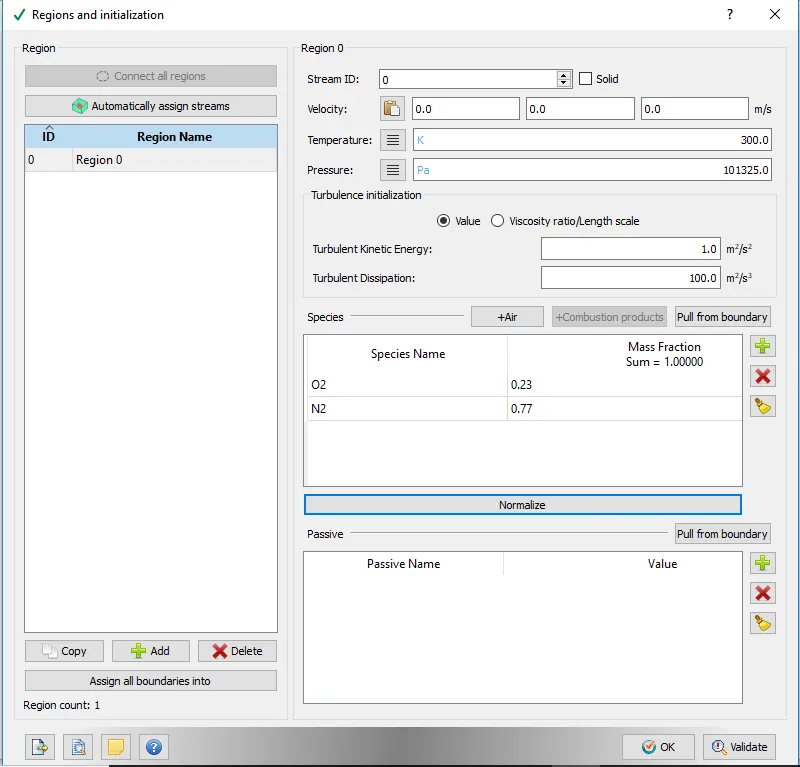
Regions and initialization
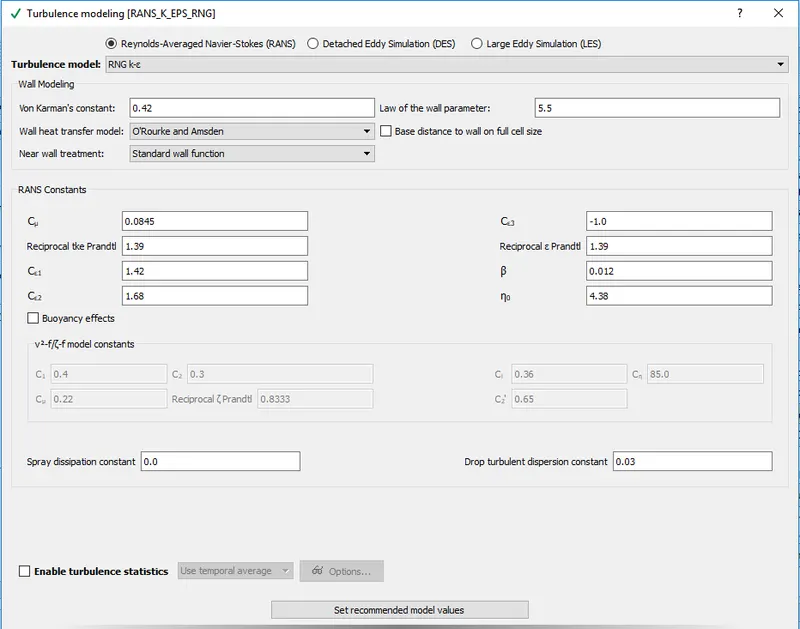
Physical models - Turbulence modeling
Grid control
- base grid
- fixed embedding
GRID
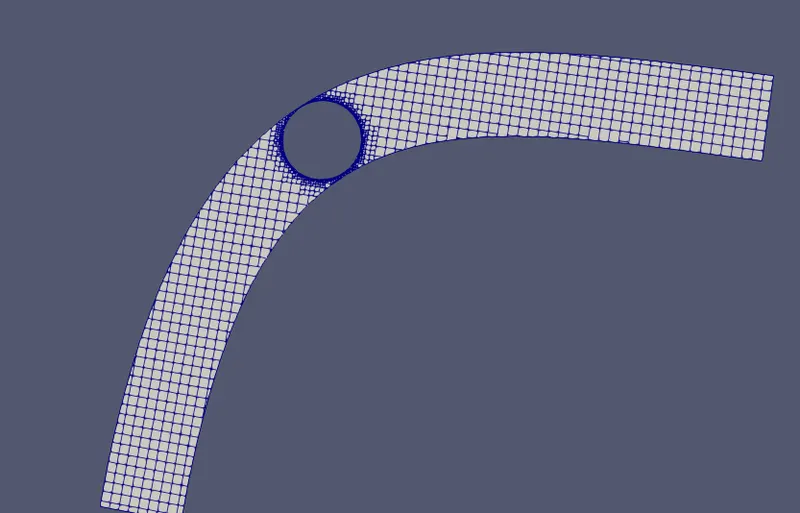
Grid around throttle
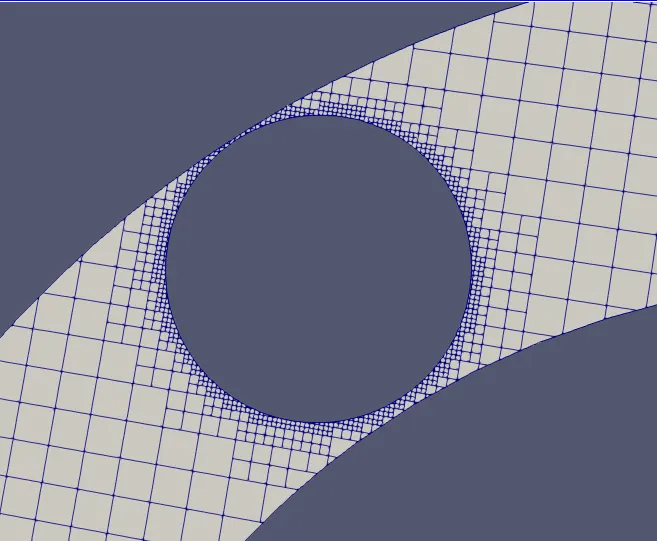
Fixed embedding is used around throtlle to make grid more dense
VELOCITY CONTOUR
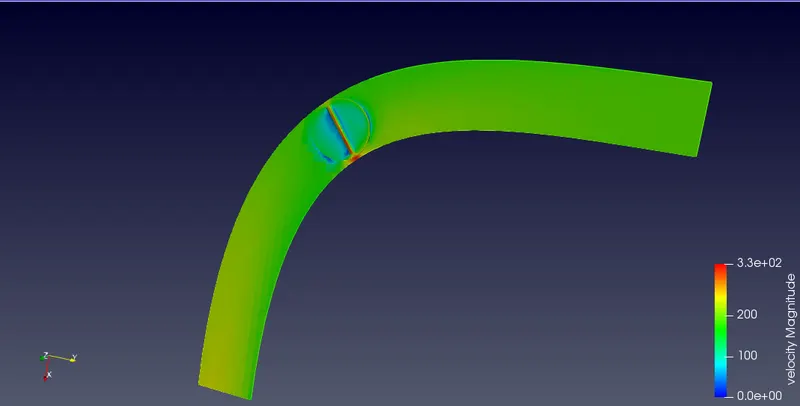
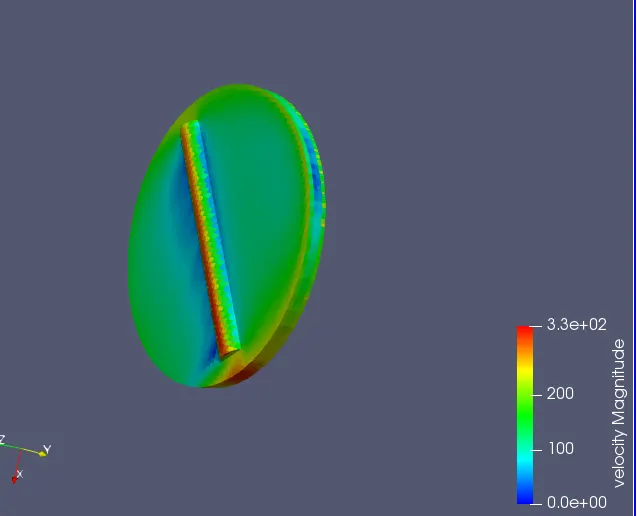
we can conclude that velocity is highest at top and bottom of throttle, this is because of low pressure area created at those points.
At some point on outlet side velocity is zero
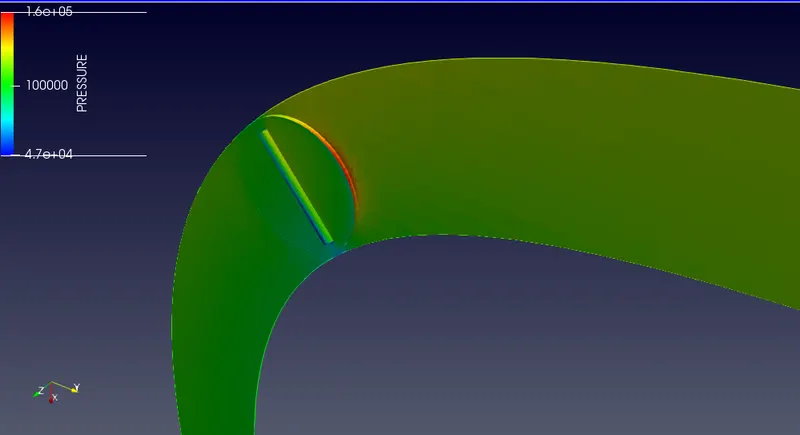
PRESSURE CONTOUR
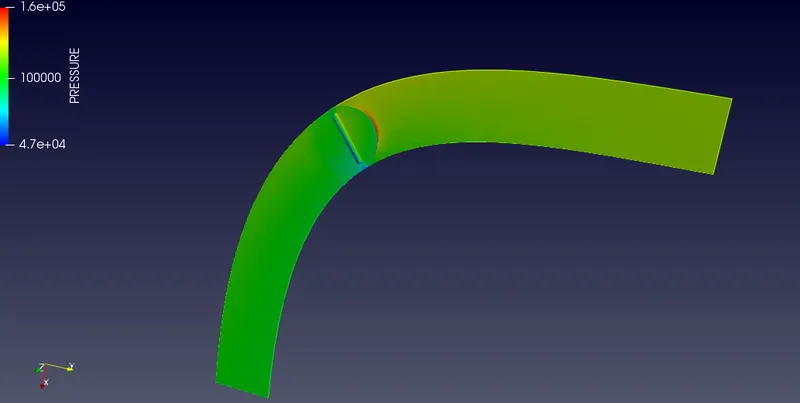
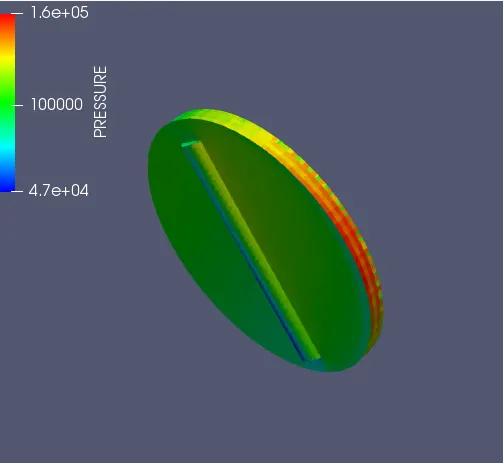
pressure at inlet side of throttle is highest because it is hit by air
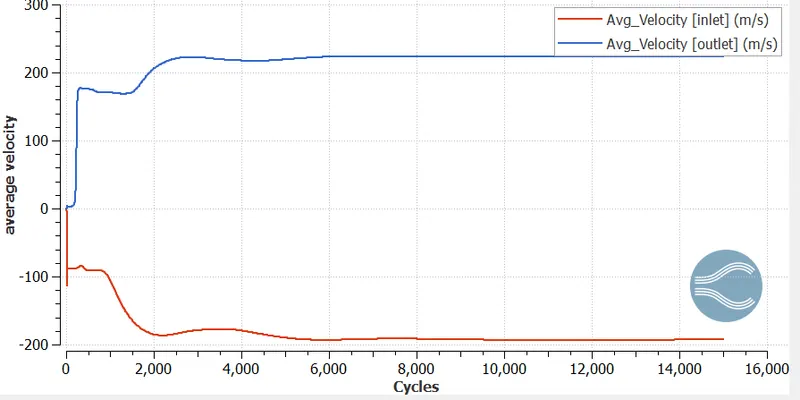
PLOTS
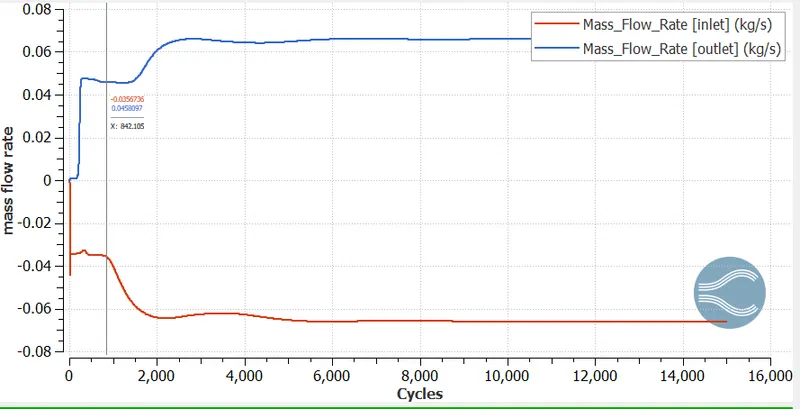
Mass flow rate
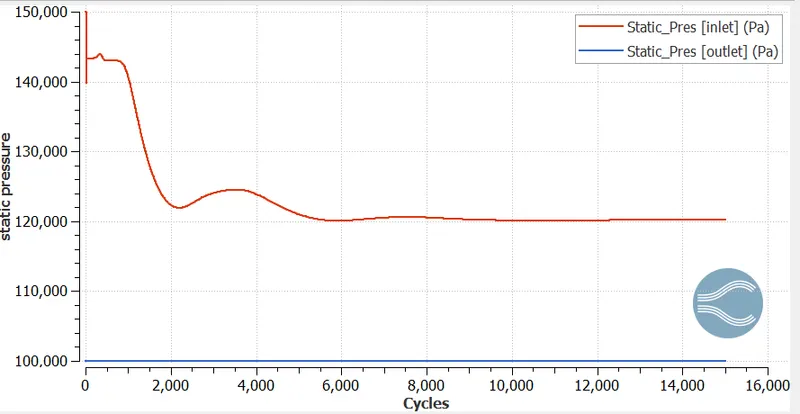
Static pressure
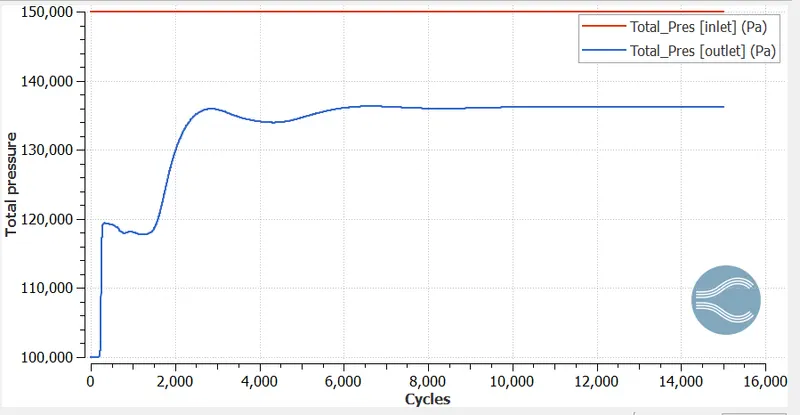
Total pressure
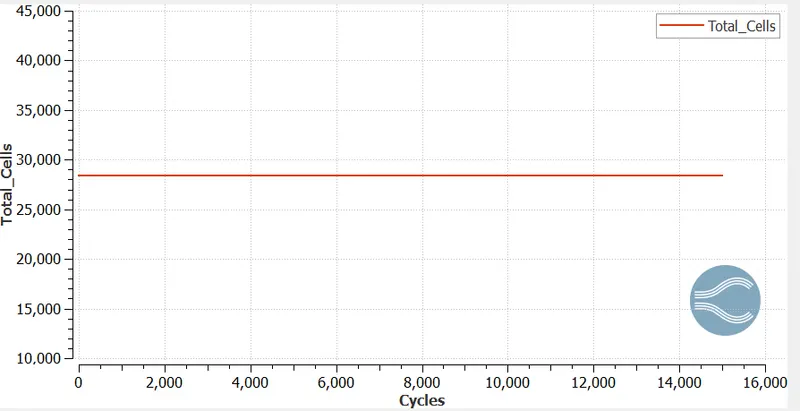
Total cell
Velocity