Week 4.1 - Genetic Algorithm
GENETIC ALGORITHM
AIM: To find the global maxima of the stalagmite function and optimize using MATLAB.
OBJECTIVES:
- To find the global maxima of given stalagmite function
- Plot the graphs for 3 studies and for F maximum vs iterations.
- Explain the ga syntax
INTRODUCTION:
Genetic Algorithm:
Genetic Algorithm (GA) is a search-based optimization technique based on the principles of Genetics and Natural Selection. It is frequently used to find optimal or near-optimal solutions to difficult problems which otherwise would take a lifetime to solve. It is frequently used to solve optimization problems, in research, and in machine learning.
The genetic algorithm uses three main types of rules at each step to create the generation from the current population:
- Selection rules select the individuals, called parents that contribute to the population at the next generation.
- Crossover rules combine two parents to form children for next generation.
- Mutation rules apply random changes to individual parents to from children.
Optimization:
Optimization is the process of making something better. In any process, we have a set of inputs and a set of outputs as shown in the following figure.
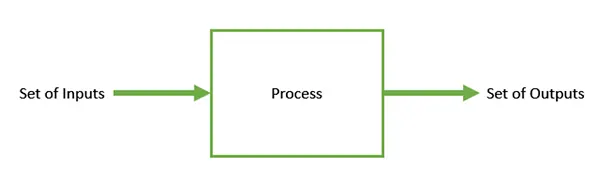
Optimization refers to finding the values of inputs in such a way that we get the “best” output values. The definition of “best” varies from problem to problem, but in mathematical terms, it refers to maximizing or minimizing one or more objective functions, by varying the input parameters.
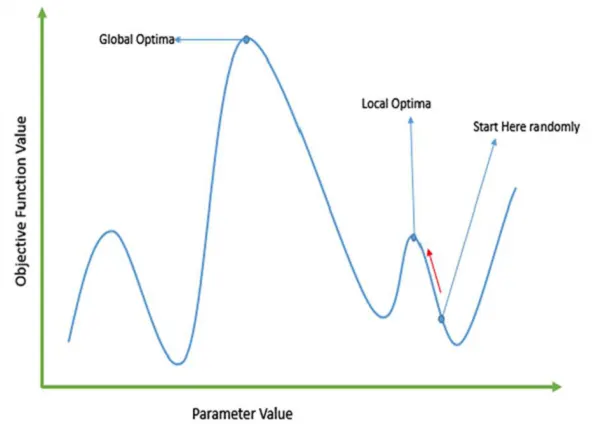
The set of all possible solutions or values which the inputs can take make up the search space. In this search space, lies a point or a set of points which gives the optimal solution. The aim of optimization is to find that point or set of points in the search space.
Advantages of GAs
GAs has various advantages which have made them immensely popular. These include −
- Does not require any derivative information (which may not be available for many real-world problems).
- Is faster and more efficient as compared to the traditional methods.
- Have very good parallel capabilities.
- Optimizes both continuous and discrete functions and also multi-objective problems.
- Provides a list of “good” solutions and not just a single solution.
- Always gets an answer to the problem, which gets better over the time.
- Useful when the search space is very large and there are a large number of parameters involved.
Limitations of GAs
Like any technique, GAs also suffers from a few limitations. These include −
- GAs is not suited for all problems, especially problems which are simple and for which derivative information is available.
- Fitness value is calculated repeatedly which might be computationally expensive for some problems.
- Being stochastic, there are no guarantees on the optimality or the quality of the solution.
- If not implemented properly, the GA may not converge to the optimal solution.
Stopping Conditions for the Algorithm:
The genetic algorithm uses the following options to determine when to stop. See the default values for each option by running opts = optimoptions('ga').
- MaxGenerations— The algorithm stops when the number of generations reaches MaxGenerations.
- MaxTime— The algorithm stops after running for an amount of time in seconds equal to MaxTime.
- FitnessLimit— The algorithm stops when the value of the fitness function for the best point in the current population is less than or equal to FitnessLimit.
- MaxStallGenerations— The algorithm stops when the average relative change in the fitness function value over MaxStallGenerations is less than Function tolerance.
- MaxStallTime— The algorithm stops if there is no improvement in the objective function during an interval of time in seconds equal to MaxStallTime.
- FunctionTolerance— The algorithm runs until the average relative change in the fitness function value over MaxStallGenerations is less than Function tolerance.
- ConstraintTolerance— The ConstraintTolerance is not used as stopping criterion. It is used to determine the feasibility with respect to nonlinear constraints. Also, max(sqrt(eps),ConstraintTolerance) determines feasibility with respect to linear constraints.
The algorithm stops as soon as any one of these conditions is met.
Syntax for GA:
x = ga(fun,nvars) finds a local unconstrained minimum, x, to the objective function, fun. nvars is the dimension (number of design variables) of fun.
x = ga(fun,nvars,A,b) finds a local minimum x to fun, subject to the linear inequalities A*x ≤ b. ga evaluates the matrix product A*x as if x is transposed (A*x').
x = ga(fun,nvars,A,b,Aeq,beq) finds a local minimum x to fun, subject to the linear equalities Aeq*x = beq and A*x ≤ b. (Set A=[] and b=[] if no linear inequalities exist.) ga evaluates the matrix product Aeq*x as if x is transposed (Aeq*x').
x = ga(fun,nvars,A,b,Aeq,beq,lb,ub) defines a set of lower and upper bounds on the design variables, x, so that a solution is found in the range lb ≤ x ≤ ub. (Set Aeq=[] and beq=[] if no linear equalities exist.)
x = ga(fun,nvars,A,b,Aeq,beq,lb,ub,nonlcon) subjects the minimization to the constraints defined in nonlcon. The function nonlcon accepts x and returns vectors C and Ceq, representing the nonlinear inequalities and equalities respectively. ga minimizes the fun such that C(x) ≤ 0 and Ceq(x) = 0. (Set lb=[] and ub=[] if no bounds exist.)
x = ga(fun,nvars,A,b,Aeq,beq,lb,ub,nonlcon,options) minimizes with the default optimization parameters replaced by values in options. (Set nonlcon=[] if no nonlinear constraints exist.)
x = ga(fun,nvars,A,b,[],[],lb,ub,nonlcon,IntCon) or
x = ga(fun,nvars,A,b,[],[],lb,ub,nonlcon,IntCon,options) requires that the variables listed in IntCon take integer values.
STALAGMITE FUNCTION:
`f_(1,x)=[sin(5.1pix+0.5)]^6`
`f_(1,y)=[(sin(5.1piy+0.5)]^6`
`f_(2,x)=exp[-4ln(2)*((x-0.0667)^2/0.64)]`
`f_(2,y)=exp[-4ln(2)*((y-0.0667)^2/0.64)]`
`f(x,y)=f_(1,x)*f_(2,x)*f_(1,y)*f_(2,y)`
PROGRAM:
The above given stalagmite function is changed slightly by multiplying the function with negative sign inorder to find the global max .
% stalagmite function

function[f]=stalagmite(input_vector)

% individual functions are given below

f_1x = (sin(5.1*pi*input_vector(1)+0.5)).^6;
f_1y = (sin(5.1*pi*input_vector(2)+0.5)).^6;
f_2x= exp((-4*log(2)*(input_vector(1)-0.0667).^2/0.64));
f_2y= exp((-4*log(2)*(input_vector(2)-0.0667).^2/0.64));

% The original function doesnot contain negative symbol
% ga function is generally used to find the global min value of the function
% where as we have to find the global maxima so negative sign is used in the function.

f= -f_1x.*f_1y.*f_2x.*f_2y;


end
Main program:
clear all
close all
clc

%defining the parent values
x=linspace(0,0.7,150);
y=linspace(0,0.7,150);

% number of iterations is given
num_cases=50;

%creating a two dimensional mesh
[xx, yy]= meshgrid(x,y);

for i= 1:length(y)

    for j=1:length(x)

    input_vector(1)=xx(i,j);      % input vector values can be known at every iteration
    input_vector(2)=yy(i,j);      % input vector values can be known at every iteration
    f(i,j)=stalagmite(input_vector);  % stalagmite function is called to the function values

    end

end


% Now the plotting is done for three studies
% 1.without boundaries
% 2. with boundary limits
% 3. with bounderaty and increasing the number of cases

% study_1-statistical behaviour _ unbounded limits

tic
for i=1:num_cases
    [inputs,fopt(i)]=ga(@stalagmite,2);
    xopt(i)=inputs(1);
    yopt(i)=inputs(2);
end

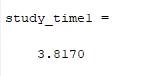
study_time1=toc      % time is noted

figure(1)            % figure number is given
subplot(2,1,1)       % subplot command is used to represent two different graphs in one figure in this program.
surfc(xx,yy,-f);      % used to plot the 3D surface of the function
shading interp;
hold on;
plot3(xopt,yopt,-fopt,'marker','o','markersize',5,'markerfacecolor','r'); % used for 3D plotting
title('Unbounded');
subplot(2,1,2)
plot(-fopt);          % plotting the function alone in 2D for better understanding
xlabel('iterations'); % x axis is represnted by iterations
ylabel('f_maximum');  % yaxis is represented by f_maximum
title('Unbounded');

%study_2 - statistical behaviour _ bounded limits

tic
for i=1:num_cases
    [inputs,fopt(i)]=ga(@stalagmite,2,[],[],[],[],[0;0],[0.4;0.4]); % upper and lower limits are included
    xopt(i)=inputs(1);
    yopt(i)=inputs(2);
end

study_time2=toc      % time is noted

figure(2)                  % figure number is given
subplot(2,1,1)             % subplot command is used to represent two different graphs in one figure in this program.
surfc(xx,yy,-f);            % used to plot the 3D surface of the function
shading interp;
hold on;
plot3(xopt,yopt,-fopt,'marker','o','markersize',5,'markerfacecolor','r'); % used for 3D plotting
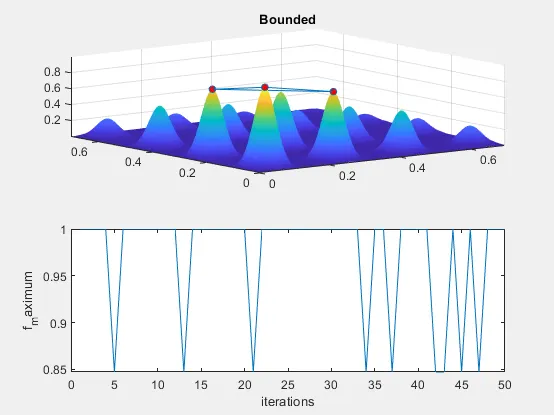
title('Bounded');
subplot(2,1,2)
plot(-fopt);               % plotting the function alone in 2D for better understanding
xlabel('iterations');      % x axis is represnted by iterations
ylabel('f_maximum');            % yaxis is represented by f_maximum


% study_3 -statistical behaviour -Increase the population

options=optimoptions('ga');
options=optimoptions(options,'populationsize',200);  %population size is increased from 50 to 200 for better results

tic
for i=1:num_cases
    [inputs,fopt(i)]=ga(@stalagmite,2,[],[],[],[],[0;0],[0.4;0.4],[],[],options);
    xopt(i)=inputs(1);
    yopt(i)=inputs(2);
end
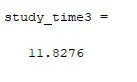
study_time3=toc     % time is noted . this plot study time will be higher than other two because the population size is increased

figure(3)
subplot(2,1,1)
surfc(xx,yy,-f);
shading interp;
hold on;
plot3(xopt,yopt,-fopt,'marker','o','markersize',5,'markerfacecolor','r'); % 3D plot is done using plot3 command
title ('Increase in population');
subplot(2,1,2)
plot(-fopt);
xlabel('iterations');
ylabel('f_maximum');
EXPLANATION OF CODE:
1. clear all command is used to clear the workspace window
2. close all command is used to close all the graphs or plots or figures
3. clc is used to clear the command window.
4. Intial inputs and the population size is given.
5. meshgrid command is used to generate 2D array an
6. ga command is used and stalagmite function is called to generate a 3D plot and to find the global max value.
7. Now study has been done to obtain at exact globla maxima and optimized inputs for that given function.
8. In study 1 no limits were given so the inputs were taken randomly
9. The process time is calculated using tic and toc command and time is stored in variable at the end of the loop
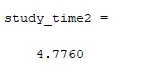
10. In study 2 upper and lower limits were given which reduces the search space and this takes a lit bittle more time than the first study.
11. In third study the final output is obtained by increasing the population and in mean while the f _maximum is plotted for the better understanding in studies.
12. hold on command is used to visuvalize all the figures at once
13. marker is used to represent the points clearly and is given red color.
OUTPUTS:
Study_1PLOT :
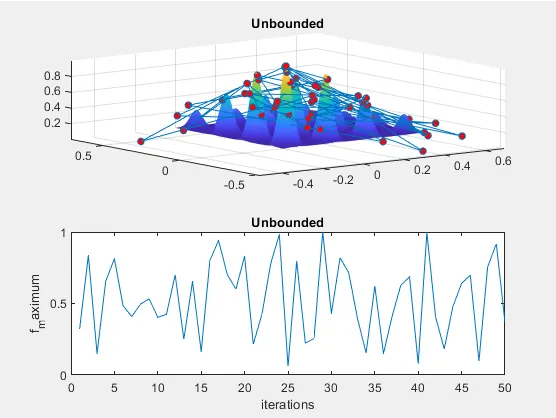
Here the ga function has run 50 times and the values are all of the plot because the search space is not limited.
study_time_1 :
Study_2 PLOT:
From the graph 1 we have seen the values are all over the plot so now the boundary limits are fixed between 0 and 0.4 . As we can observe after giving the limits are values are redcued to 3 peaks. The final global maxima will be one of them.
study_time_2 :
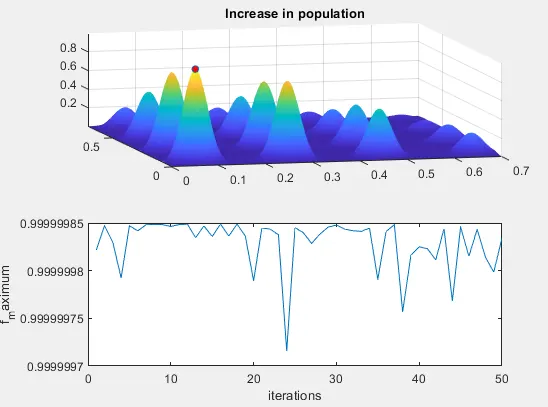
Study_3 PLOT: In this plot apart from fixing the limits the population of stalagmite function is increased from 50 to 200 . This increment helps to find out the optimum solution as shown below .
study_time_3:
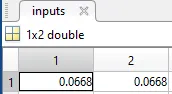
Results : From the final graph we obtained that the fopt value is '-1' and that value is obtained at x and y = [0.0668 0.0668]
ERRORS:
Error in plot command
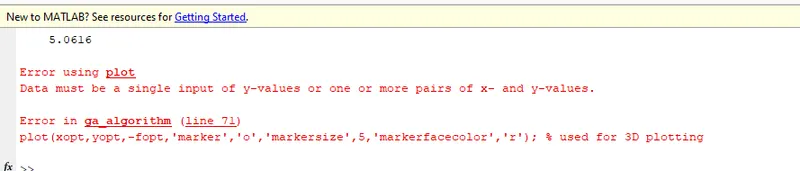
Solution : In order plot a 3D graph i have to use plot3 command but i have used plot command after rectifying that error program worked.
REFERENCES:
1. https://www.tutorialspoint.com/genetic_algorithms/genetic_algorithms_introduction.htm
2. https://in.mathworks.com/discovery/genetic-algorithm.html