Project 1 - Parsing NASA thermodynamic data
PARSING THERMODYNAMIC DATA OF NASA
AIM: To parse the thermodynamic data of NASA and calculate the values of the specific heat, entropy and enthalpy of all the species mentioned.
OBJECTIVES:
- To parse the data from given THERMO.dat file and calculate the coefficients.
- Plot entropy, enthalpy and specific heat for local temperature range for individual species.
- Calculate the molecular mass of species.
INTRODUCTION:
PARSING:
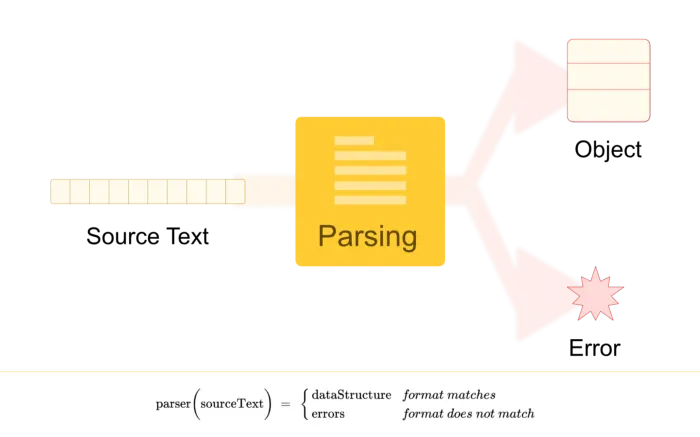
Parsing is a process of converting formatted text into a data structure. A data structure type can be any suitable representation of the information engraved in the source text.
- Treetype is a common and standard choice for XML parsing, HTML parsing, JSON parsing, and any programming language parsing. The output tree is called Parse tree or Abstract Syntax Tree. In HTML context, it is called Document Object Model (DOM).
- A CSV file parsing can result in a List of List of values oraList of Record objects.
- GraphType is a choice for natural language parsing.
A piece of program that does parsing is called Parser.
How it works
Parser analyses source text against the format prescribed. If source text does not match against format error is thrown or returned.
- If source text does not match against format error is thrown or returned.
- If matches then “data structure” is returned.
Function:
`Cp=(a_1+a_2*T+a_3*T^2+a_4*T^3+a_5*T^4)*R`
`H=(a_1+a_2*T/2+a_3*T^2/3+a_4*T^3/4+a_5*T^4/5+a_6)*R*T`
`S=a_1lnT+a_2*T+a_3*T^2/2+a_4*T^3/3+a_5*T^4/4+a_7`
PROGRAM:
% parsing thermodynamic data of NASA

clear all
close all
clc
f1=fopen('THERMO.dat','r');     %given data file is opened in new file f1
header=fgetl(f1);               % header is read using fgetl command
temp_values=fgetl(f1);          % temp values are stored in temp_values
K=strsplit(temp_values,' ');    % three different temp's are seperated using string splitting
global_low_temp=str2double(K{2});  % Global low temp is converted from string to number
global_mid_temp=str2double(K{3});  % Global mid temp is converted from string to number
global_high_temp=str2double(K{4}); % Global high temp is converted from string to number
f2=fopen('output.txt','w');     % new f2 file is opened to write data
fprintf(f2,'%16s %16s\n','species','molecular_mass');  % header is written using fprintf command

%commands in the given data
for k=3:5
fgetl(f1);
end

% program for the species
for i=1:53
species=fgetl(f1);               % the first line in species data is assigned to species variable
species_names=species(1:6);       % species name is sperated.
%Inorder to find the individual temperature ranges the strfind command is
%used
D=strfind(species,'G ');
local_min_temp=str2double(species(D(1)+3:D(1)+10));
local_max_temp=str2double(species(D(1)+12:D(1)+20));
local_mid_temp=str2double(species(D(1)+22:D(1)+30));

% next line in species data is read
L1=fgetl(f1);
A=strfind(L1,'E');   % letter E is found out and seperation of the number has been done with refrence to that charcter.

% all the coefficients in that line is read and converted into numbers and
% stored in seperate variables
a1=str2double(L1(1:A(1)+3));
a2=str2double(L1(A(1)+4:A(2)+3));
a3=str2double(L1(A(2)+4:A(3)+3));
a4=str2double(L1(A(3)+4:A(4)+3));
a5=str2double(L1(A(4)+4:A(5)+3));

% next line is read
L2=fgetl(f1);
B=strfind(L2,'E');

% all the coefficients in that line is read and converted into numbers and
% stored in seperate variables
a6=str2double(L1(1:B(1)+3));
a7=str2double(L1(B(1)+4:B(2)+3));
a8=str2double(L1(B(2)+4:B(3)+3));
a9=str2double(L1(B(3)+4:B(4)+3));
a10=str2double(L1(B(4)+4:B(5)+3));

% next line is read
L3=fgetl(f1);
C=strfind(L3,'E');

% all the coefficients in that line is read and converted into numbers and
% stored in seperate variables
a11=str2double(L1(1:C(1)+3));
a12=str2double(L1(C(1)+4:C(2)+3));
a13=str2double(L1(C(2)+4:C(3)+3));
a14=str2double(L1(C(3)+4:C(4)+3));

mkdir(['F:\skill-lync\matlab\',species_names]);   % to create a new folder

% Tempearture ranges inorder to apply the coefficients and calculate Cp,H,S
T=linspace(local_min_temp,local_max_temp,100);

% Universal gas constant
R=8.314;

for j=1:length(T)
    % As first 7  coefficients arae hight temp coefficients
    if T(j)>local_mid_temp
        Cp= (a1+a2.*T+a3.*(T).^2+a4.*(T).^3+a5.*(T).^4)*R;
        H=(a1+((a2.*T)./2)+((a3.*(T).^2)./3)+(a4.*(T).^3)./4+((a5.*(T).^4)./5)+a6./(T)).*R.*T;
        S=(a1.*log(T)+a2.*T+(a3.*(T).^2)./2+(a4.*(T).^3)./3+(a5.*(T).^4)./4+a7).*R;
        % As next & coefficients are low temp coefficients
    else
        Cp=(a8+a9.*T+a10.*(T).^2+a11.*(T).^3+a12.*(T).^4)*R;
        H=(a8+((a9.*T)./2)+((a10.*(T).^2)./3)+(a11.*(T).^3)./4+((a12.*(T).^4)./5)+a13./(T)).*R.*T;
        S=(a8.*log(T)+a9.*T+((a10.*(T).^2)./2)+(a11.*(T).^3)./3+(a12.*(T).^4)./4+a14).*R;

    end
end

%plotting

%temperature vs entropy
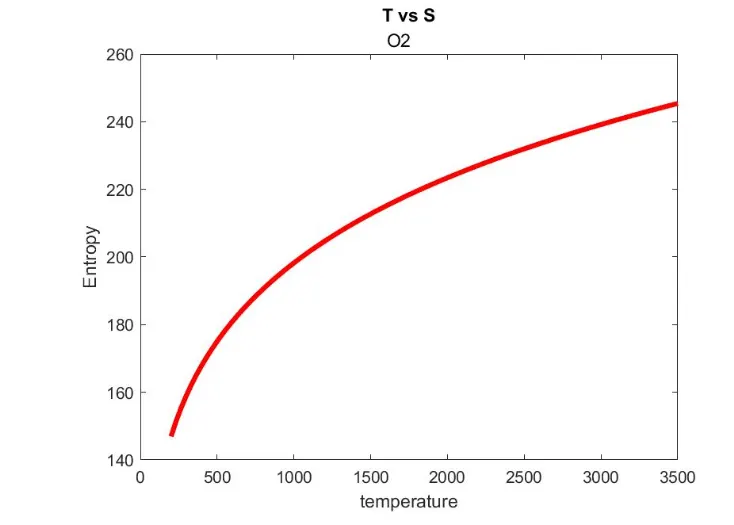
figure(1)
plot(T,S,'linewidth',3,'color','r'); % plot between temp and entropy
xlabel('temperature');               % tempearture on axis labelled
ylabel('Entropy');                   % entropy on yaxis labelled
title('T vs S',species_names);               % title is given

%Temperature vs Enthalpy
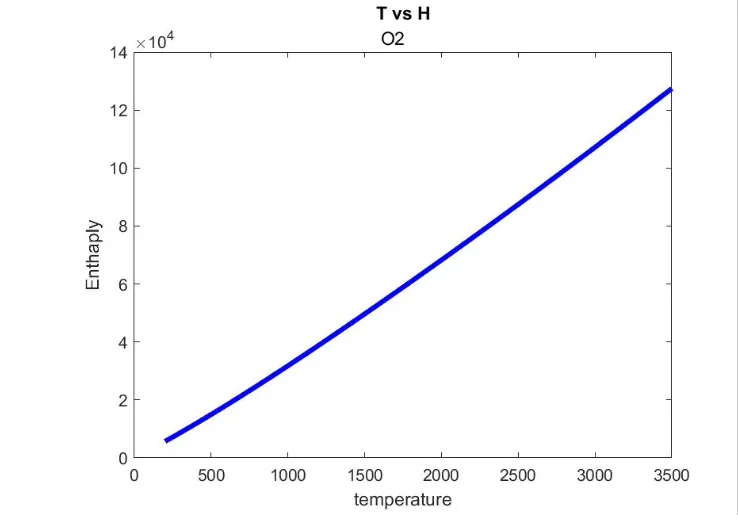
figure(2)
plot(T,H,'linewidth',3,'color','b'); % plot between temp and enthalpy
xlabel('temperature');               % tempearture on axis labelled
ylabel('Enthaply');                  % enthalpy on yaxis labelled
title('T vs H',species_names);

%temperature vs Specific heat
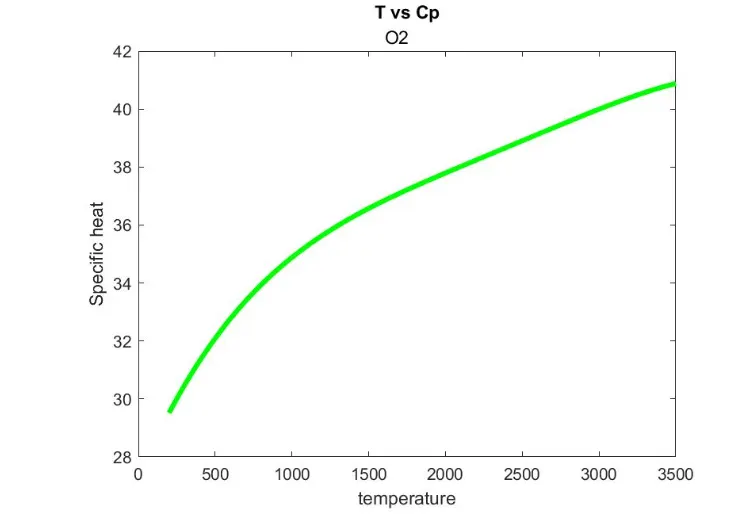
figure(3)
plot(T,Cp,'linewidth',3,'color','g'); % plot between temp and Specific heat
xlabel('temperature');                % tempearture on axis labelled
ylabel('Specific heat');              % Specific heat on yaxis labelled
title('T vs Cp',species_names);

cd(['F:\skill-lync\matlab\',species_names]) % changes the current folder

%saving plots
% images saved in folder in jpg format
saveas(1,'temperature vs Entropy','jpg')
saveas(2,'temperature vs Enthalpy','jpg')
saveas(3,'temperature vs Speific heat','jpg')

cd('F:\skill-lync\matlab')     % return to the orginal folder

% molecular mass function is called
MM=molecular_mass(species_names);

% The name of the species and the repsctive molecular mass is written in
% the ouput in text format
fprintf(f2,'%16s %16f',species_names,MM);
fprintf(f2,'\n');  % this line is used to change the line

end
fclose(f1);    % file f1 is closed
fclose(f2);    % file f2 is closed
EXPLANATION OF CODE:
1. clear all command is used to clear the workspace
2. close all command is used to close all figures or graphs etc
3. clc is used to clear the command window.
4. Intially a file f1 is opened and thermo.dat file is read line by line
5. Inorder to read line by line fgetl command is used.
6. After reading the header and storing the temperature values using strsplit, strfind and str2double commands the species lines are read were the cofficients are available
7. Coefficients values are extracted by using the above dicussed commands and stored in variables .
8. Now a new folder is created using mkdir command to store all the values that are to be programmed.
8. Now an if loop is used to calculate the entropy, enthalpy and specific heat values for individual species based upon their respective local tempearture ranges
9. After caclculating the values the temperature vs all the other three thermodynamic properties are plotted and stored as jpg files in the folder that was created earlier.
10. Now after returning to the original folder Molecular mass is calculated by calling the molecular_mass function.
11. A new file f2 is created to store all the molecular mass values and stored after ceating.
12. Finally the two file f1 and f2 are closed.
The molecular function used in main program is given below.
molecular_mass function
function MM=molecular_mass(species_names)
species=upper(species_names);              % used to converted all the letters into uppercase
individual_species=['C' 'H' 'O' 'N' 'Ar']; % array of individual constituents
atomic_weights=[12.0107 1.00794 15.994 14.0067 39.948]; % and their respective atmoic weights

MM=0;
for i=1:length(species)
    for j=1:length(individual_species)
        if       strcmp(species(i),individual_species(j))  % string comparision is done
        MM=MM+atomic_weights(j);
        u=j;                     % the position of the matched constituent is stored
        end
    end
        n=str2num(species(i));   % each character of the str in read and numbers are found out
        if n>1
            MM=MM+atomic_weights(u)*(n-1);  % already the addition is done once in the loop so n-1
        end
end
end
EXPLANATION OF CODE:
1. The function molecular_mass contains species_names as an input argument and it is saved in the variable MM and the output is molecular mass
2. A array is created which contains the atom names and another aaray is created with mass of the repective atoms.
3. In for for loop the strcmp command is used for the string comparsion and the atoms matched are carried to the next line and added to MM. The postion of the atom matched is stored in u for futher usage.
4. The repitation of the elements in known by using str2num command
OUTPUTS:
PLOTS OF H, S, Cp FOR 'O2'
PLOTS OF H,S,Cp FOR 'CO2'
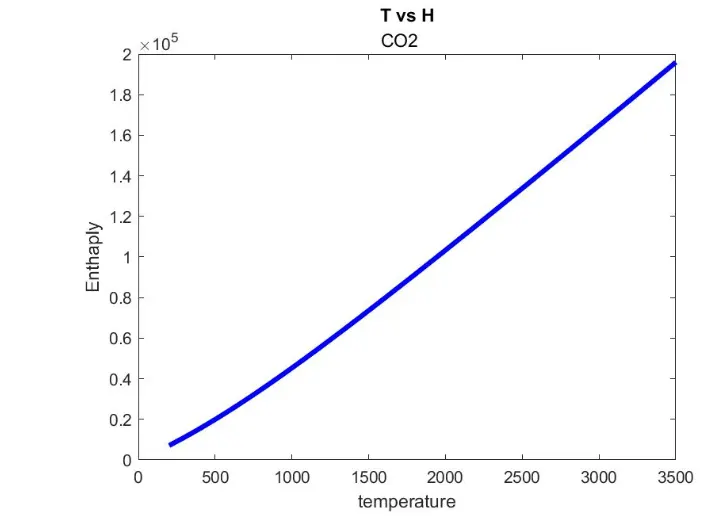
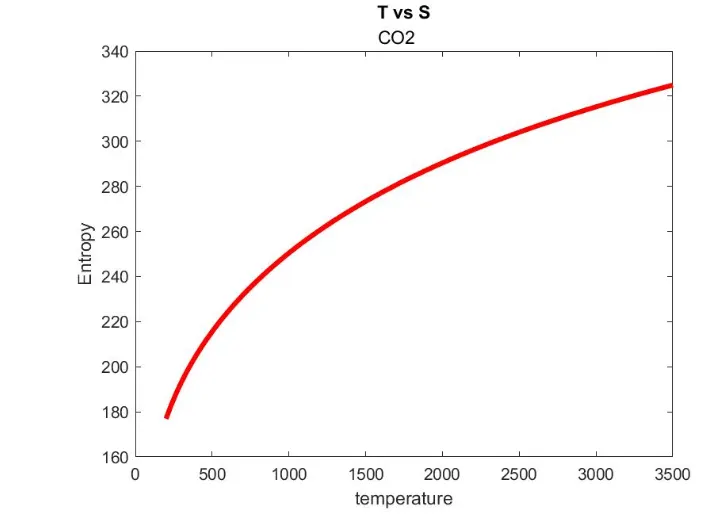
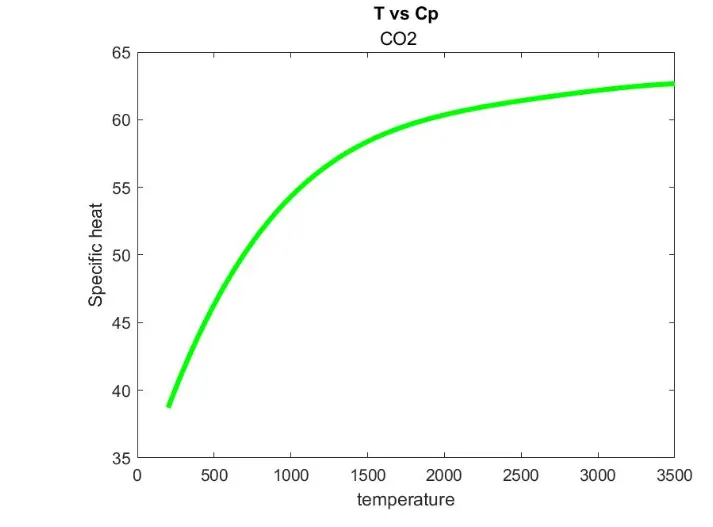
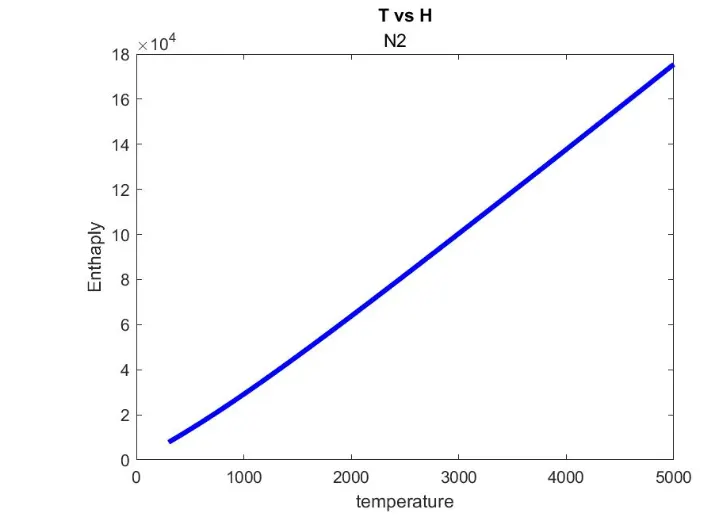
PLOTS OF H, S,Cp FOR 'N2'
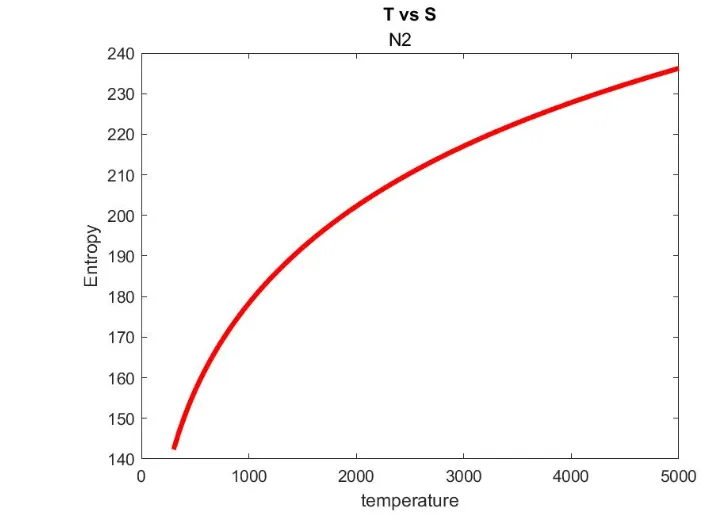
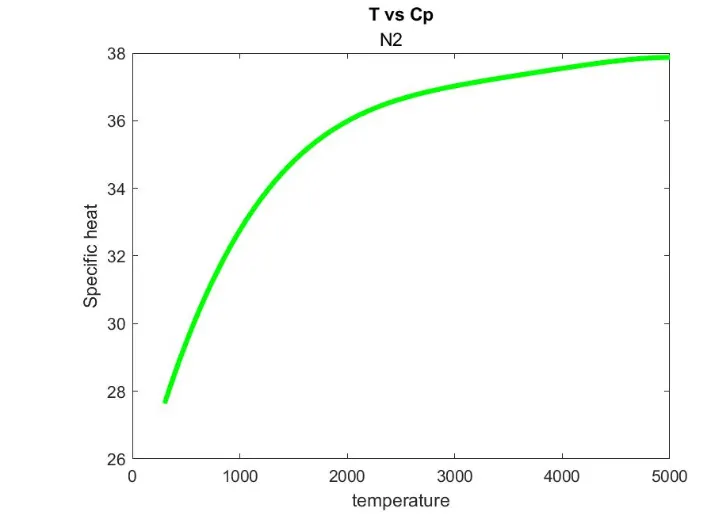
FOLDER SCREENSHOT
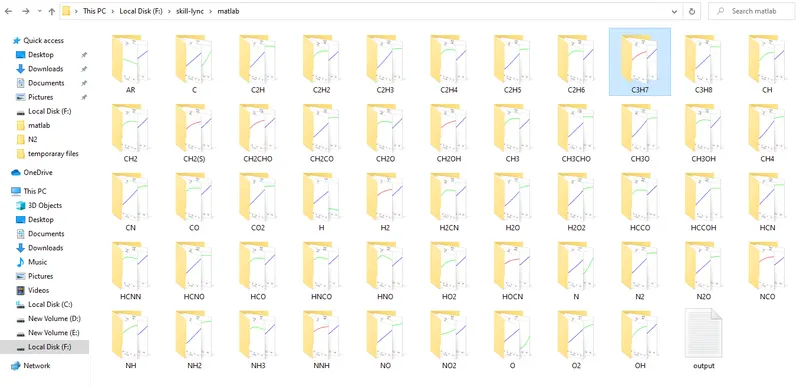
MOLECULAR MASS SCREENSHOTS
Screenshot of output text created : Molecular mass of all the species is saved in this txt but half of them are shown in screenshot for example purpose .
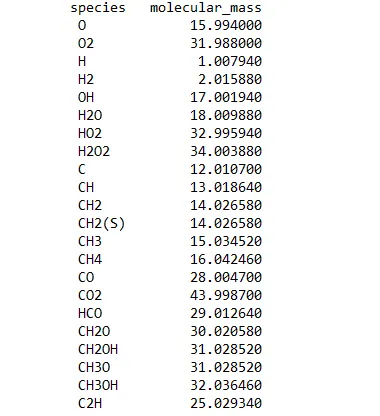
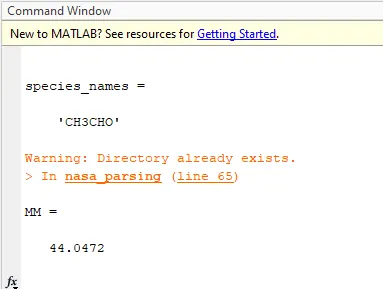
Screenshot of molecular mass in command window: Molecular mass of all the species is generated in comman dwindow only has shown as an example.
ERRORS:
Error in the folder saving:
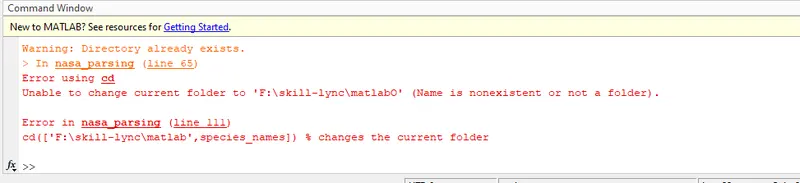
Solution: While creating folders for species '\' should be used after matlab , so that the files save in that folder . After rectifying the error the program worked.
REFERENCES:
1. https://en.wikipedia.org/wiki/Parsing
2. What is Parsing?. A brief introduction to Parsing | by Puneet Sapra | The Mighty Programmer | Medium
4.https://in.mathworks.com/help/matlab/ref/strcmp.html
5.https://in.mathworks.com/help/matlab/ref/mkdir.html