Week 4.1 - Genetic Algorithm
Objective :- To write a program to optimize a given function and find global maxima using Genetic algorithem.
for this we have to define our stalagmite function and find global maxima .
the stepwise explanation of the code is give and the graph and necessery thigs are aatached.
Defining function.
% defining the stalagmite function for Genetic Algorithems.
function [f]=stalagmite(V1)
x=V1(1);
y=V1(2);
f1_x=(sin(5.1*pi*x+0.5))^6;
f1_y=(sin(5.1*pi*y+0.5))^6;
f2_x=exp(-4*log(2)*((x-0.0667)^2)/0.64);
f2_y=exp(-4*log(2)*((y-0.0667)^2)/0.64);
f=-(f1_x*f1_y*f2_x*f2_y);
end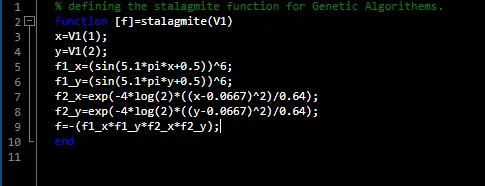
now our main program is as follows..
% a program on genetic algorithem which is used to determine the optimum
% maximum value of the given salagmite function
clc,clear,close all
x=linspace(0,0.6,150);           % using linspace command lets divide the x values into numbers of equal parts
y=linspace(0,0.6,150);           % using linspace command lets divide the y values into numbers of equal parts
num_pass=50;                     % num_pass is equal to number of iteration an inbuild GA will perform on the given function
for i=1:length(x)                % with the help of nested for loop we define the number of nodal points and
    for j=1:length(y)            ... for each nodal poimts we find the value of salagmite function by passing the
        V1(1)=x(i);              ... x and y cordinates each time from the define salagmite function.
        V1(2)=y(j);              ... here we assign the every nodal poitn to the variable V and that variable is assign to
        f(i,j)=stalagmite(V1);   ...proceed further in salagmite function which we define earlier.
    end
end

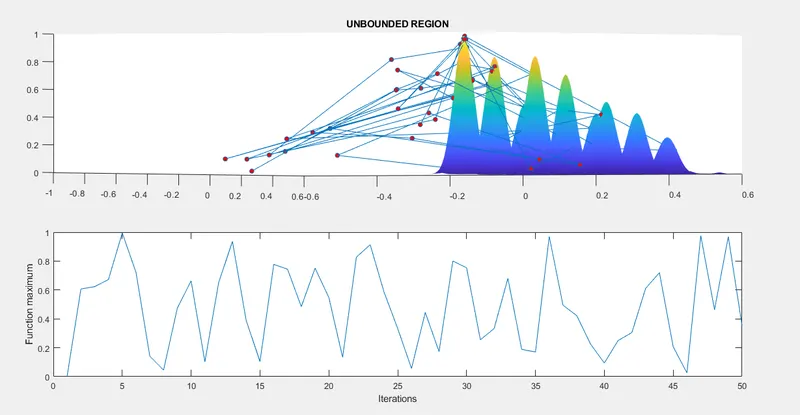
% UNBOUNDED REGION

% lets firts find the maxima of given function for UNBOUND REGION and set the ga algorithen as shown
for k=1:num_pass                % here with the help of for loop we difine the number of iteration by num_pass.
[V2,fopt1(k)]=ga(@stalagmite,2);% here 2 shown the number of input variable x and y whereas output v2 and foptimum
xopt1(k)=V2(1);                 ... gives optimum value of function for each and every points.
yopt1(k)=V2(2);                 % these output values we assign to our optimum x and y value for the given function
end
figure(1);                      % lets shown the output values in figure 1
subplot(2,1,1);                 % here we define two plots one for the optimization of the function
hold on
surf(x,y,-f);                   % using surf command we plot the function in 3d and finding the optimization value.
shading interp;
plot3(xopt1,yopt1,-fopt1,'marker','o','markersize',5,'markerfacecolor','r'); % by assigning the marker size and color the points are clearly visible
title('UNBOUNDED REGION');
subplot(2,1,2);                 % our second plot is for the iteration going on for the Genetic Algorithem.
plot(-fopt1)
xlabel('Iterations');
ylabel('Function maximum');


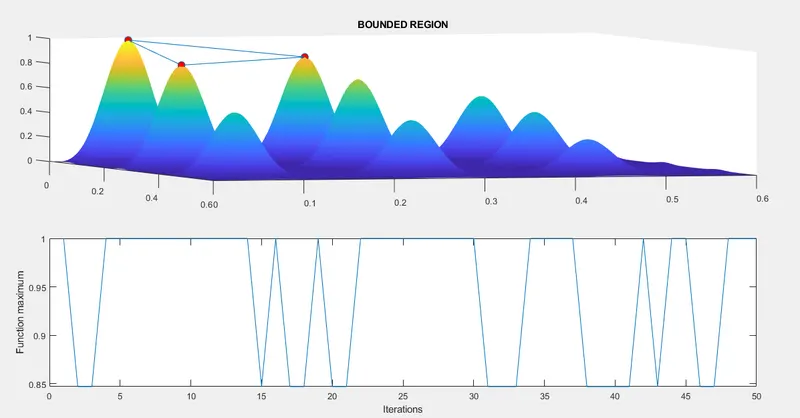
% BOUNDED REGION

% lets firts find the maxima of given function for BOUNDED REGION and set the ga algorithen as shown
for k=1:num_pass                % here with the help of for loop we difine the number of iteration by num_pass.
[V2,fopt2(k)]=ga(@stalagmite,2,[],[],[],[],[0 0],[0.6 0.6]);% here 2 shown the number of input variable x and y whereas output v2 and foptimum
xopt2(k)=V2(1);                 ... here we define the initial and final value of x and y upto which our boundry condition is define
yopt2(k)=V2(2);                 % these output values we assign to our optimum x and y value for the given function
end
figure(2);                      % lets shown the output values in figure 1
subplot(2,1,1);                 % here we dwfine two plots one for the optimization of the function and
hold on                         % and showing the different points for unbound condition.
surf(x,y,-f);                   % using surf command we plot the function in 3d and finding the optimization value.
shading interp;
plot3(xopt2,yopt2,-fopt2,'marker','o','markersize',8,'markerfacecolor','r');% by assigning the marker size and color the points are clearly visible
title('BOUNDED REGION');
subplot(2,1,2);                 % our second plot is for the iteration going on for the Genetic Algorithem.
plot(-fopt2)
xlabel('Iterations');
ylabel('Function maximum');


% FOR SPECIFIC POPULATION SIZE

% lets firts find the maxima of given function for specific population size and set the ga algorithen as shown
options=optimoptions('ga');    % here we use inbuild optimopttions command to apply some changes in inbuild GA command
options=optimoptions('ga','populationsize',500);...by changing the population size to 500
for k=1:num_pass               % here with the help of for loop we difine the number of iteration by num_pass.
[V3,fopt3(k)]=ga(@stalagmite,2,[],[],[],[],[0 0],[0.6 0.6],[],[],options);% here 2,shown as the number of input variable x and y whereas output v2 and foptimum
xopt3(k)=V3(1);                ... and the option is used to change the population size in inbulid GA function
yopt3(k)=V3(2);                % these output values we assign to our optimum x and y value for the given function
end
figure(3);                     % lets shown the output values in figure 3
subplot(2,1,1);                % here we dwfine two plots one for the optimization of the function and
hold on
surf(x,y,-f);                  % using surf command we plot the function in 3d and finding the optimization value.
shading interp;
plot3(xopt3,yopt3,-fopt3,'marker','o','markersize',10,'markerfacecolor','r');% by assigning the marker size and color the points are clearly visible
title('Specific Population Size');
subplot(2,1,2);                % our second plot is for the iteration going on for the Genetic Algorithem.
plot(-fopt3)
xlabel('Iterations');
ylabel('Function maximum');

the above program is written in matlab and the output graph for all three conditions are give below.
1.For Unbounded Region
2.For Bounded Region
3.For Specific Population Size
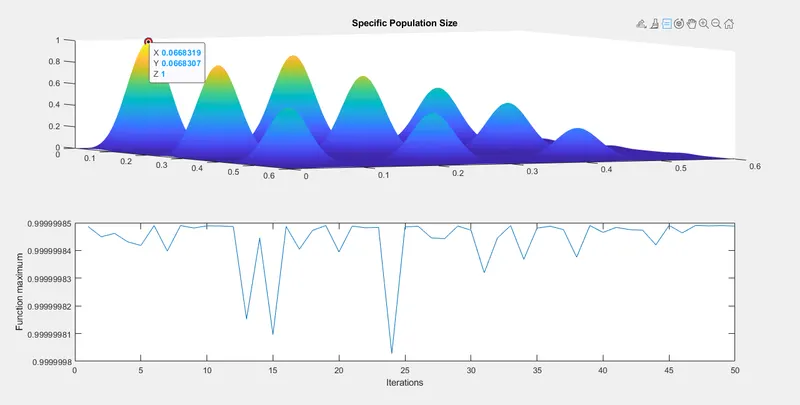
clearly from above plot its visible that the global maxima point is (0.066831,0.0668307,1).
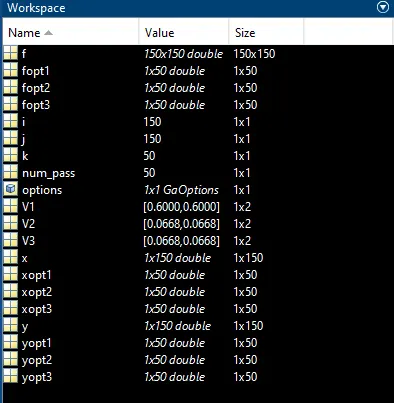
the workspace variable is shown below.