Project 1 - Parsing NASA thermodynamic data
objective:- Write a function that extracts the 14 co-efficients and calculates the enthalpy, entropy and specific heats for all the species in the data file.
1.The file THERMO.dat is opened and read
2.Then the 14 co-effs. of polynomials are extracted
3. The coefficients are then arranged according to the higher and lower temperature co-effs.
inside the for a loop.
4. The specific heat, enthalpy, and entropy are calculated using the above formula and higher and lower temperature co-eff.
respectively. Separate functions are created d for each and called inside the main code of for loop.
5. The current folders are changed and identified using cd(pwd) command and the folders are created using the mkdir command
inside the for loop of the main code
6. Figures are plotted against temperature and specific heat, enthalpy, and entropy respectively using plot command inside the main
code of for loop
7. The plotted figures are named and the path to save them inside the corresponding folders is written in the main code for the loop.
8. Then the graphs are saved in the respective folders using the created path, written in the main code for a loop.
9.loop ends
clc,clear,close all
f=fopen('THERMO.dat','r');    % Open the the THERMO.dat file
                              % skip the first line of the file
fgetl(f);                     % fgetl is the command which read the file,line by line one at a time.
line=fgetl(f);
a=strsplit(line,' ');         % split the string values distinguished by an space ' '.
global_low_temp=str2num(a{2});% reading the tempersture values distingushed as global low,average and high temperatures
global_average_temp=str2num(a{3});
global_high_temp=str2num(a{4});
R=8.314;                      % specifieng the value of Universal gas contant
for i_1=1:3                   % running for loop to skip the next three lines.
    fgetl(f);
end
for k=1:53                    % running for loop for 53 times so that it wil read all the species i the thermo.dat file
L_1=fgetl(f);                 % assigning first line after 5 lines fom the above to L_1
L_2=fgetl(f);                 % assigning next line after L_1 lines from the above to L_2
L_3=fgetl(f);                 % assigning next line after L_2 lines from the above to L_3
L_4=fgetl(f);                 % assigning next line after L_3 lines from the above to L_4
s=strsplit(L_1,' ');          % splitting al the string from L_1 line by splitcommand by taking space ' ' as reference.
species=(s{1});               % assigning firt string of s to species which he species of thermo file.
T_l=str2double(s{end-3});     % converting the string cell to char by using str2double command assign as Lower temperature
T_h=str2double(s{end-2});     % converting the string cell to char by using str2double command assign as Higher temperature
T_m=str2double(s{end-1});     % converting the string cell to char by using str2double command assign as Middle temperature
B_2=strfind(L_2,'E');         % finding the place values of E in the line L_2 so that it use as a reference for calling the coefficients
B_3=strfind(L_3,'E');         % finding the place values of E in the line L_3 so that it use as a reference for calling the coefficients
B_4=strfind(L_4,'E');         % finding the place values of E in the line L_3 so that it use as a reference for calling the coefficients
n_1=1;
for i_2=1:4                                           % running for loop to finding the values of all the coefficients from the file.
     c1(i_2)=str2double(L_2(B_2(n_1)+4:B_2(n_1+1)+3));% finding the coefficient from L_2 line all at a time.
     c2(i_2)=str2double(L_3(B_3(n_1)+4:B_3(n_1+1)+3));% finding the coefficient from L_3 line all at a time.
     if i_2<4
     c3(i_2)=str2double(L_4(B_4(n_1)+4:B_4(n_1+1)+3));% finding the coefficient from L_4 line all at a time.
     else                                             % note that there are only 3 coeffients in every fourth line of the species but our loop runs...
     break                                            % for 4 times so we use break statment aftrer it runs for 3 times
     end

    n_1=n_1+1;                                        % incremnting th value of n_1 by 1 each time the loop runs
end
% finding all the high (a1,a7) and low(a8,a14) temperature coefficient by
% assigning it to different elements of above arrays i.e c1,c2,c3.
% assigning the coefficient of line to a1 and convert it from string to char by str2double command.
a1=str2double(L_2(1:B_2(1)+3));
a2=c1(1);
a3=c1(2);
a4=c1(3);
a5=c1(4);
a6=str2double(L_3(1:B_3(1)+3));
a7=c2(1);
a8=c2(2);
a9=c2(3);
a10=c2(4);
a11=str2double(L_4(1:B_4(1)+3));
a12=c3(1);
a13=c3(2);
a14=c3(3);
% using linspace command to forming an array of temperature from local lower Temperature to local higher Temperature
T=linspace(T_l,T_h,1000);
% running if loop so that when Temperature is less than the middle
% Temperature than cp,s and h uses higher coefficient values i.e (a1 to a6) and if
% temperature is higher than he middle temperatue tahn it uses the lower
% temperature coefficients i.e(a8 to a14)
 if (T>=T_m)
         Cp = R*(a1 + (a2*T) + (a3*(T).^2) + (a4*(T).^3) + (a5*(T).^4));
         S = R*(a1.*log(T) + (a2*T) + ((a3*(T).^2)/2) + ((a4*(T).^3)/3) + ((a5*(T).^4)/4) + a7);
         H = R*T.*(a1 + ((a2*T)/2) + ((a3*(T).^2)/3) + ((a4*(T).^3)/4) + ((a5*(T).^4)/5) + ((a6./T)));
  else
         Cp = R*(a8 + (a9*T) + (a10*(T).^2) + (a11*(T).^3) + (a12*(T).^4));
         S = R*(a8.*log(T) + (a9*T) + ((a10*(T).^2)/2) + ((a11*(T).^3)/3) + ((a12*(T).^4)/4) + a14);
         H = R*T.*(a8 + ((a9*T)/2) + ((a10*(T).^2)/3) + ((a11*(T).^3)/4) + ((a12*(T).^4)/5) + ((a13./T)));
 end
 cur_dir=pwd;                       % saving the current directry path to variable by using pwd command.
 mkdir(species);                    % using mkdir command making a folder in curent directry by the name of species.
 % Plot 1 Cp vs T
 figure(1)                          % creating figure 1 of Specific heat vs Temperature and assigning a specifie linewidth, color and title to it.
 plot(T,Cp,'linewidth',2,'color','b');
 xlabel('Temperature(K)');          % providing x and y label to it
 ylabel('Specific Heat(KJ)');
 title(sprintf('Specific heat vs Temperature range of %s',species));
 grid on

 % Plot 2 S vs T
 figure(2)                          % creating figure 1 of Entropy vs Temperature and assigning a specifie linewidth, color and title to it.
 plot(T,S,'linewidth',2,'color','r');
 xlabel('Temperature(K)');          % providing x and y label to it
 ylabel('Entropy(KJ/mol-K)');
 title(sprintf('Entropy vs Temperature range of %s',species));
 grid on

 % Plot 3 Cp vs T
 figure(3)                          % creating figure 1 of Enthalpy vs Temperature and assigning a specifie linewidth, color and title to it.
 plot(T,H,'linewidth',2,'color','g');
 xlabel('Temperature(K)');          % providing x and y label to it
 ylabel('Enthalpy(KJ/mol)');
 title(sprintf('Enthalpy vs Temperature range of %s',species));
 grid on

 cd(species);                       % using cd command we enter into the folder which we just created using mkdir command
 saveas(1,'Specific Heat.jpg');     % saving all the figure created by using saveas file
 saveas(2,'Entropy.jpg');           % assigning name to the images and save it as .jpg extension file
 saveas(3,'Enthalpy.jpg');
 cd(cur_dir);                       % using cd command we return to the current directry again.

  % molecular weight finding.
Elements=['H' 'N' 'O' 'C' 'A' 'S']; % creating a string array of the elements which are in the species of thermo.dat file
at_wt=[1 14 16 12 40 32];           % creating an array of atomic weight respective to the string element array.
mol_wt=0;                           % assigning initial molecular weight as 0 and aftre that its value increases as per the value of iteration
for i=1:length(species)             % running for loop from 1 to size of species array
    for j=1:length(Elements)        % using nested for loop to compare each and every string of species to the element array
      if  strcmp(species(i),Elements(j))   % using strcmp command
           mol_wt=mol_wt+at_wt(j);         % if its same than we assign tha atomic weight of that element to molecular weight every time
           k=j;
      end
    end
          n=str2double(species(i))      ;  % if from above loop it fails to compare than the value is a number but it is in string form so we convert it into
          if n>1                           % integer value using str2double command and multiply that number to the final lement and asig its value to molecular weight
              mol_wt=mol_wt+at_wt(k)*(n-1);% the above process continues until we rach the szie of the species and the molecular
          end                              % weight we getis the final molecular weight of the species
end
fprintf('Molecular Weight Of %6s is = %5.2f\n',species,mol_wt);% showing the molecular weight of the species using fpringf command
end
fclose(f);                                 % close the file using fclose command
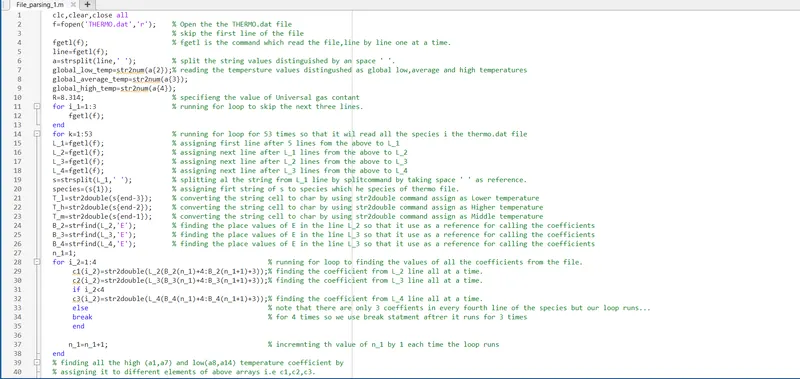
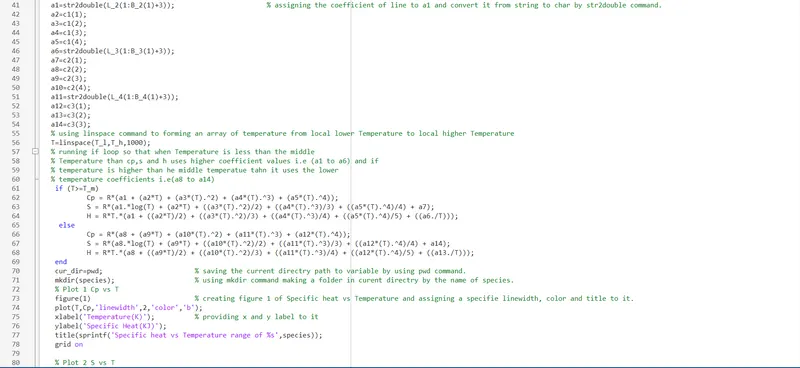
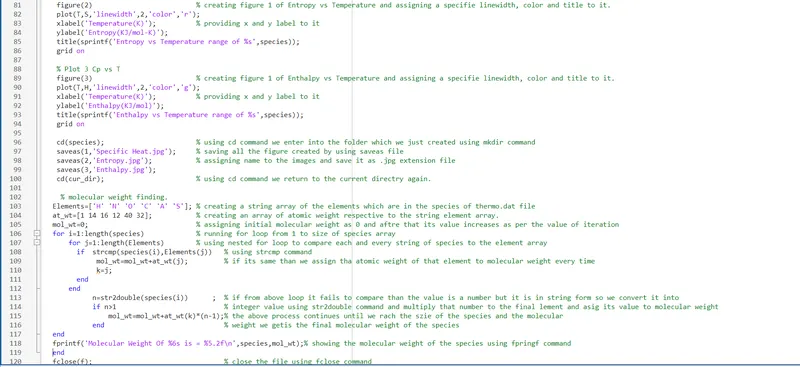
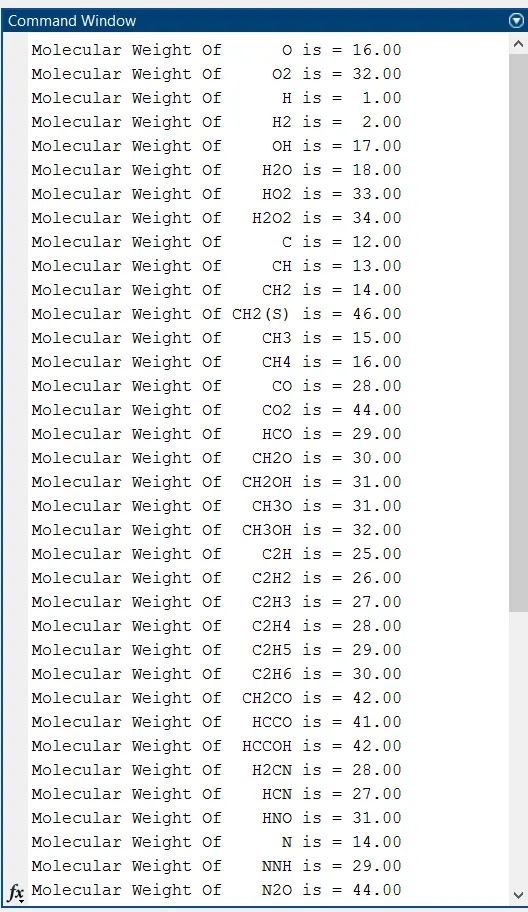
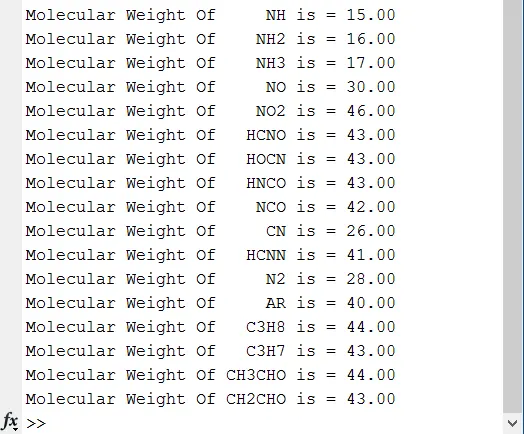
codes written in the matlab is shown now workspace and command window is shown below
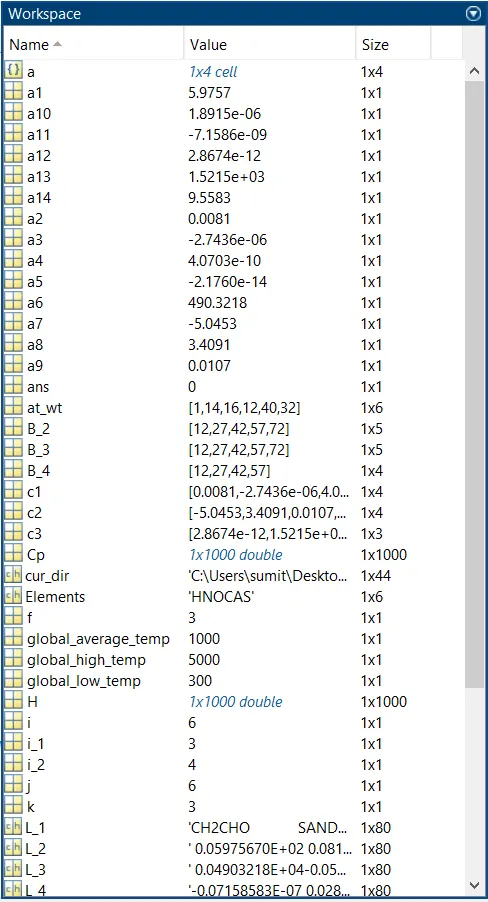
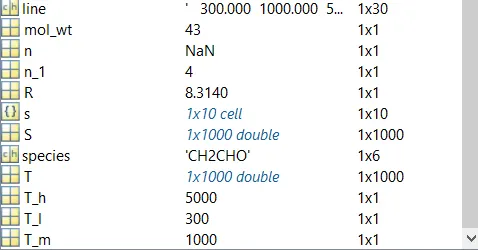
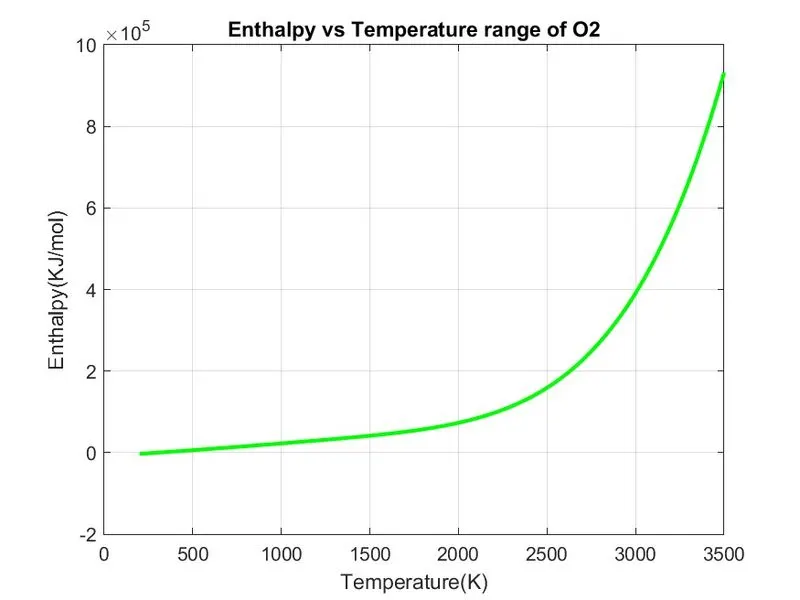
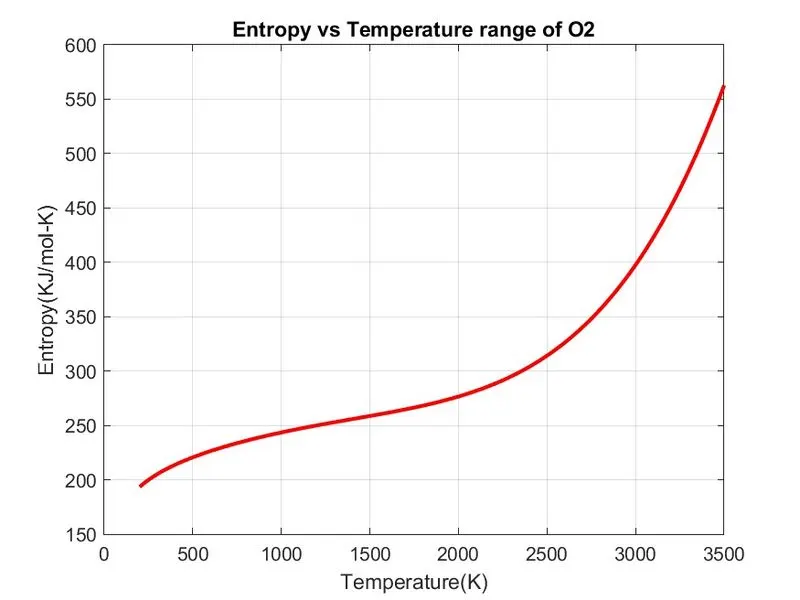
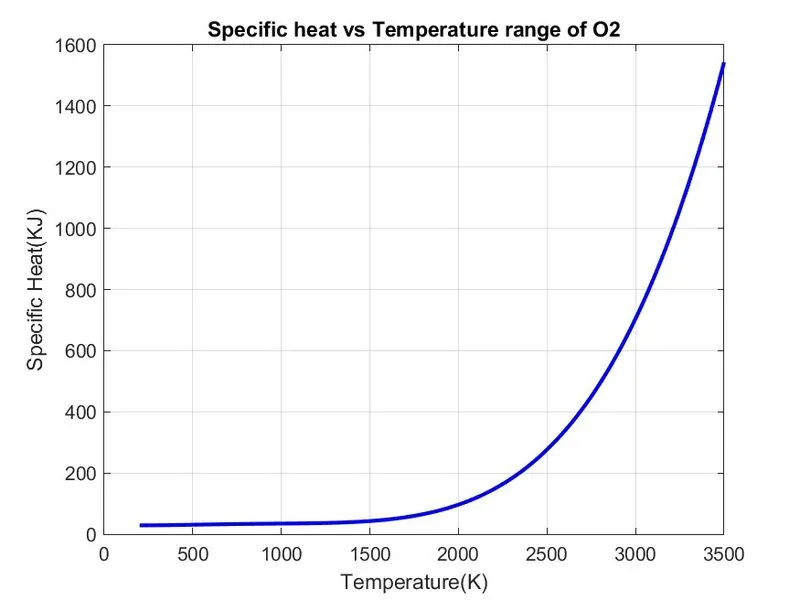
Plots for o2 is shown below
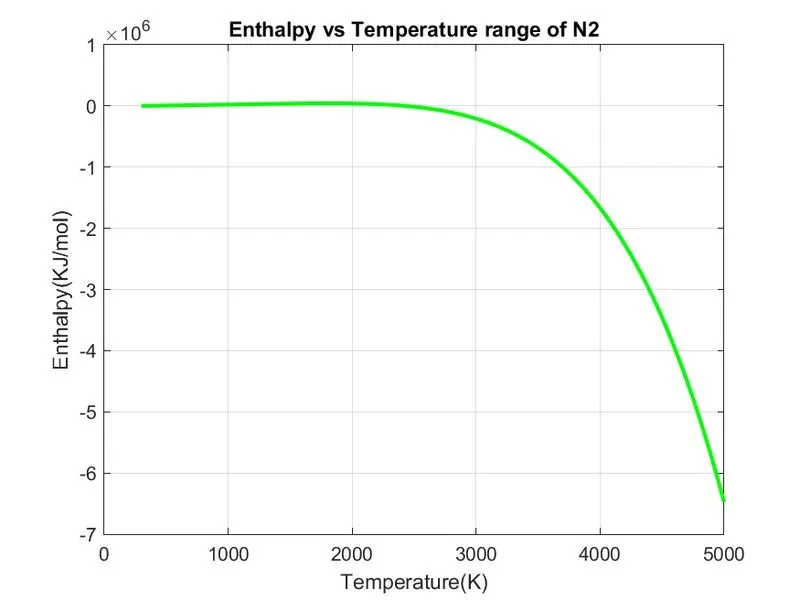
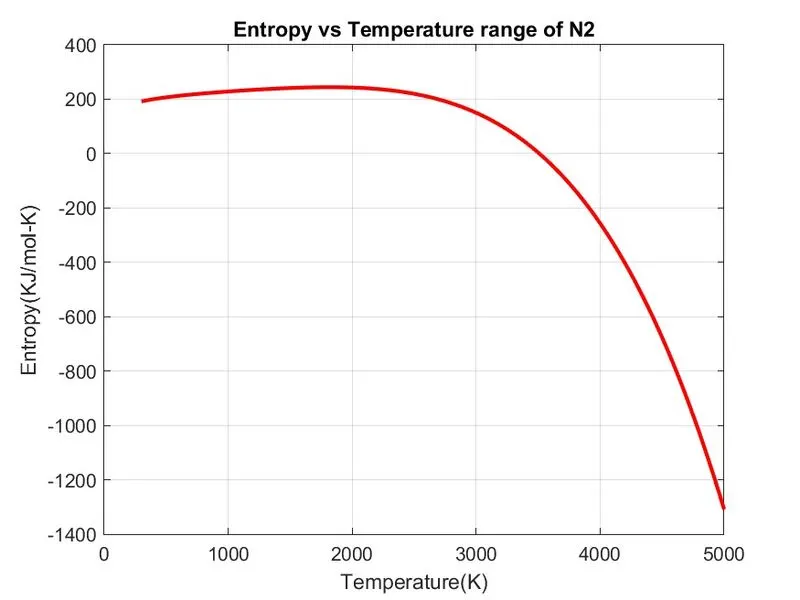
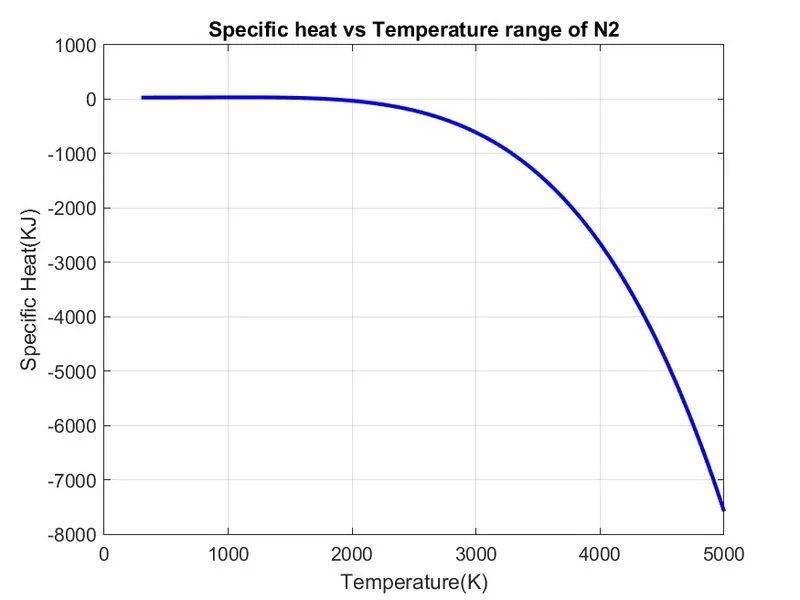
plots for N2 is shown below
plots for CO2 is shown below
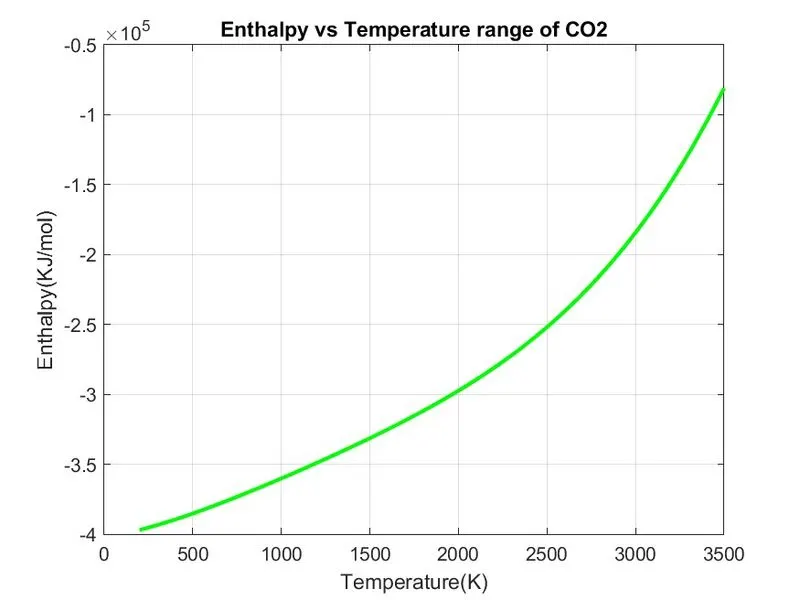
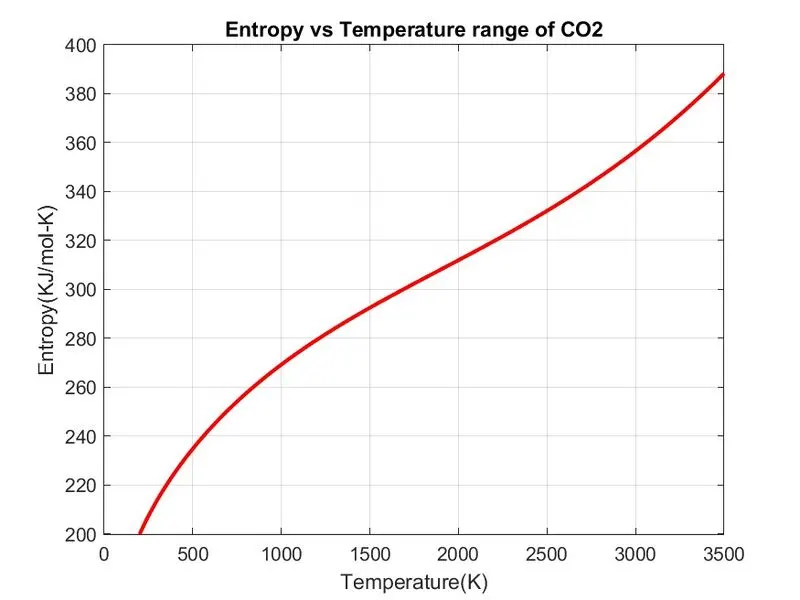
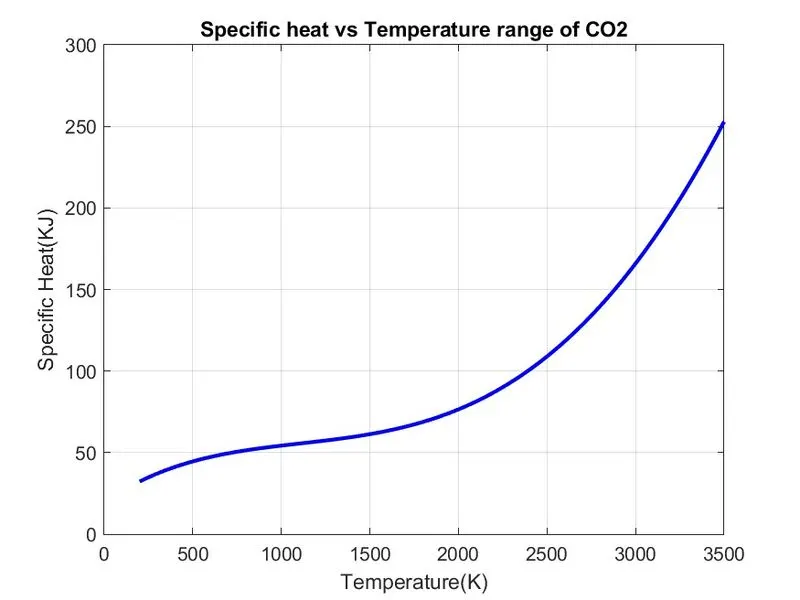
the screenshot of all the 53 species folder is given below

some extra work
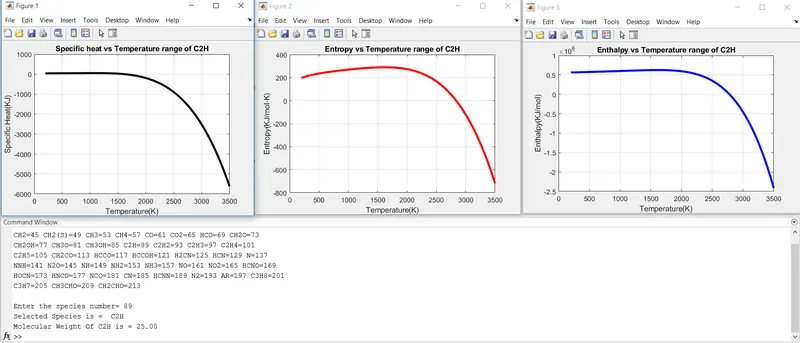
in the above program we get all the figures at a time when we run our program but what if i want to collect a data for any specific species ..
so i design a program in which i assign a number to particular species so that when u run the code it display you the different species and a number related to that. when u chose certain species by its number it can display you the chosen species and the molecular weight of the species and the three plots i.e specific heat ,entropy,enthaply vs temperatue for that particular species.the numbe assign to species is particularly the row number in which the species are in thermo.dat file when you enter the number it directly goes to that line and execute the next 4 line and provide the respected data.
the code is same as the above but with slight change so stepwise explanation is not provided.
code and screenshot of matlab and output is given below
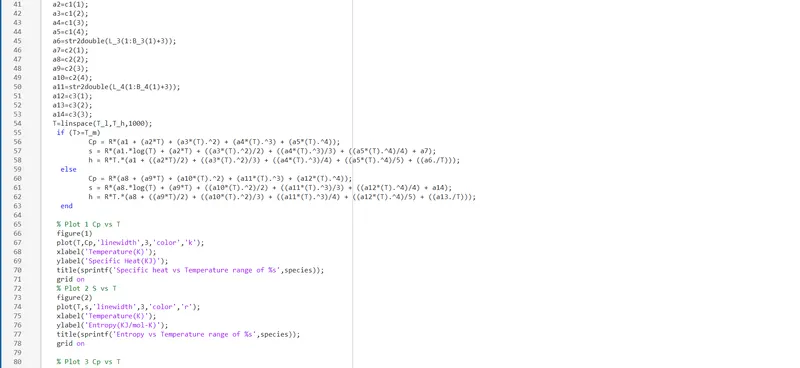
clc,clear,close all
disp('O=5 O2=9 H=13 H2=17 OH=21 H2O=25 HO2=29 H2O2=33 C=37 CH=41');
disp('CH2=45 CH2(S)=49 CH3=53 CH4=57 CO=61 CO2=65 HCO=69 CH2O=73');
disp('CH2OH=77 CH3O=81 CH3OH=85 C2H=89 C2H2=93 C2H3=97 C2H4=101 ');
disp('C2H5=105 CH2CO=113 HCCO=117 HCCOH=121 H2CN=125 HCN=129 N=137');
disp('NNH=141 N2O=145 NH=149 NH2=153 NH3=157 NO=161 NO2=165 HCNO=169');
disp('HOCN=173 HNCO=177 NCO=181 CN=185 HCNN=189 N2=193 AR=197 C3H8=201');
disp('C3H7=205 CH3CHO=209 CH2CHO=213 ');
disp(' ');
n=input('Enter the species number= ');
f=fopen('THERMO.dat');
R=8.314;
for i_1=1:n
    fgetl(f);
end
L_1=fgetl(f);
L_2=fgetl(f);
L_3=fgetl(f);
L_4=fgetl(f);
s=strsplit(L_1,' ');
species=(s{1});
fprintf('Selected Species is =  %s\n',species)
T_l=str2double(s{end-3});% Lower temperature
T_h=str2double(s{end-2});% Higher temperature
T_m=str2double(s{end-1});% Middle temperature
B_2=strfind(L_2,'E');
B_3=strfind(L_3,'E');
B_4=strfind(L_4,'E');
n_1=1;
for i_2=1:4
     c1(i_2)=str2double(L_2(B_2(n_1)+4:B_2(n_1+1)+3));
     c2(i_2)=str2double(L_3(B_3(n_1)+4:B_3(n_1+1)+3));
     if i_2<4
     c3(i_2)=str2double(L_4(B_4(n_1)+4:B_4(n_1+1)+3));
     else
     break
     end
    n_1=n_1+1;
end
a1=str2double(L_2(1:B_2(1)+3));
a2=c1(1);
a3=c1(2);
a4=c1(3);
a5=c1(4);
a6=str2double(L_3(1:B_3(1)+3));
a7=c2(1);
a8=c2(2);
a9=c2(3);
a10=c2(4);
a11=str2double(L_4(1:B_4(1)+3));
a12=c3(1);
a13=c3(2);
a14=c3(3);
T=linspace(T_l,T_h,1000);
 if (T>=T_m)
         Cp = R*(a1 + (a2*T) + (a3*(T).^2) + (a4*(T).^3) + (a5*(T).^4));
         s = R*(a1.*log(T) + (a2*T) + ((a3*(T).^2)/2) + ((a4*(T).^3)/3) + ((a5*(T).^4)/4) + a7);
         h = R*T.*(a1 + ((a2*T)/2) + ((a3*(T).^2)/3) + ((a4*(T).^3)/4) + ((a5*(T).^4)/5) + ((a6./T)));
  else
         Cp = R*(a8 + (a9*T) + (a10*(T).^2) + (a11*(T).^3) + (a12*(T).^4));
         s = R*(a8.*log(T) + (a9*T) + ((a10*(T).^2)/2) + ((a11*(T).^3)/3) + ((a12*(T).^4)/4) + a14);
         h = R*T.*(a8 + ((a9*T)/2) + ((a10*(T).^2)/3) + ((a11*(T).^3)/4) + ((a12*(T).^4)/5) + ((a13./T)));
  end

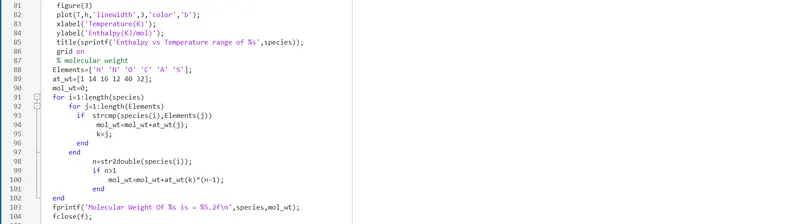
 % Plot 1 Cp vs T
 figure(1)
 plot(T,Cp,'linewidth',3,'color','k');
 xlabel('Temperature(K)');
 ylabel('Specific Heat(KJ)');
 title(sprintf('Specific heat vs Temperature range of %s',species));
 grid on
 % Plot 2 S vs T
 figure(2)
 plot(T,s,'linewidth',3,'color','r');
 xlabel('Temperature(K)');
 ylabel('Entropy(KJ/mol-K)');
 title(sprintf('Entropy vs Temperature range of %s',species));
 grid on

 % Plot 3 Cp vs T
 figure(3)
 plot(T,h,'linewidth',3,'color','b');
 xlabel('Temperature(K)');
 ylabel('Enthalpy(KJ/mol)');
 title(sprintf('Enthalpy vs Temperature range of %s',species));
 grid on
 % molecular weight
Elements=['H' 'N' 'O' 'C' 'A' 'S'];
at_wt=[1 14 16 12 40 32];
mol_wt=0;
for i=1:length(species)
    for j=1:length(Elements)
      if  strcmp(species(i),Elements(j))
           mol_wt=mol_wt+at_wt(j);
           k=j;
      end
    end
          n=str2double(species(i));
          if n>1
              mol_wt=mol_wt+at_wt(k)*(n-1);
          end
end
fprintf('Molecular Weight Of %s is = %5.2f\n',species,mol_wt);
fclose(f);