Week 4.1 - Genetic Algorithm
AIM:- To write a code to calculate a globle maxima of STALAGMITE function.
OBJECTIVE:
- Write a code in MATLAB to optimise the stalagmite function and find the global maxima of the function.
- Clearly expalin the concept of genetic algorithm in your own words and also explain the syntax for ga in MATLAB in your report.
- Make sure that your code gives the same output, even if it is made to run several times.
- Plot graphs for all 3 studies and for F maximum vs no. of iterations. Title and axes labels are a must, legends could be shown if necessary.
THEORY:
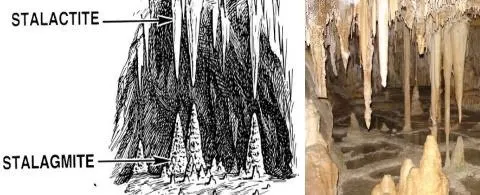
Stalactites grow down from the cave ceiling, while stalagmites grow up from the cave floor. It's easy to remember which is which: Stalactites have a "T" for top.
Stalagmites have a "G" for ground. Speleothems actually form because of water. Rainwater seeps through cracks in the rock.
Optimization:-Optimization methods are used in many areas of study to find solutions that maximize or minimize some study parameters, such as minimize costs in the production of a good or service, maximize profits, minimize raw material in the development of a good, or maximize production.
Optimization important?
The goal of software optimization is to improve the behaviour of a correct program so that it also meets the customer's need for speed, throughput and resource usage. Software optimization is just as important to the development process as implementing features is.
Process flow:
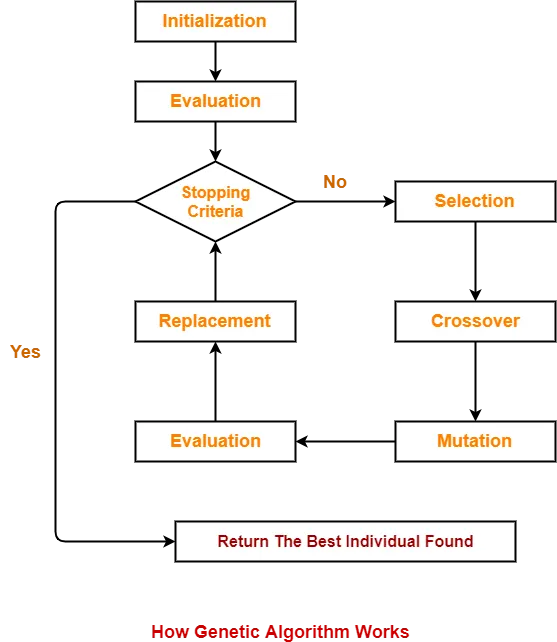
Genetic algorithm :-is a method for solving both constrained and unconstrained optimization problems that is based on natural selection, the process that drives biological evolution. The genetic algorithm repeatedly modifies a population of individual solutions.
SELECTION:- it defined the selection of parents for the next generation.
CROSSOVER:- A point or place of crossing from one side to the other.
MUTATION:- Change in the basis genetic structure.
MATHEMATICAL EQUATION:-
find global maxima
f = (f1_x*f1_y*f2_x*f2_y)
find global minima
f = -(f1_x*f1_y*f2_x*f2_y)
where,
f1_x = (sin(5.1*pi *x+0.5)).^6;
f1_y = (sin(5.1*pi *y+0.5)).^6;
f2_x = exp((-4*0.6931).*(x-0.0667)^2/(0.64));
f2_y = exp((-4*0.6931).*(y-0.0667)^2/(0.64));
here x & y are variable.
STALAGMITE Function:
function [stalagmite] = stalagmite_func(input_vector)
x = input_vector(1);
y = input_vector(2);
f1_x = (sin(5.1*pi *x+0.5)).^6;
f1_y = (sin(5.1*pi *y+0.5)).^6;
f2_x = exp((-4*0.6931).*(x-0.0667)^2/(0.64));
f2_y = exp((-4*0.6931).*(y-0.0667)^2/(0.64));
stalagmite = -(f1_x.*f2_x.*f1_y.*f2_y)
end
TEST CODE:-
% close all
% clear all
% clc
% defining search input
x = linspace(0,0.6,150);
y = linspace(0,0.6,150);
% creating 2 dimentional array
[xx,yy] = meshgrid(x,y);
% evaluate the stalagmite function
for i = 1:length(xx)
for j = 1:length(yy)
input_vector(1) = xx(i,j);
input_vector(2) = yy(i,j);
f(i,j) = -stalagmite_func(input_vector);
end
end
surf(xx,yy,f)
shading interp
xlabel('x value')
ylabel('ylabel')
[x_output,fval] = ga(@stalagmite_func,2);
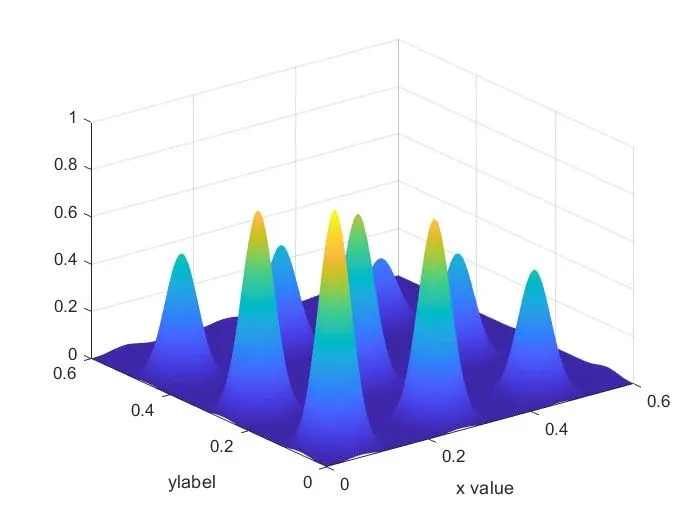
Output Graph
GA SYNTAX:-
x = ga(fun,nvars,A,B,Aeq,beq,lb,ub,nonlcon,options)
fun = objective function
nvars = number of variable (specified as positive integer)
A,b= Linear inequality constraints(A = Real matrix ,b = Real vector)
Aeq,beq = linear equality constraints(A =Real matrix,b = real vector)
Lb,ub = lower bound,upper bond
nonlcon = nonlinear constraints
option = optimization option.
Code & Plot graphs for all 3 studies and for F maximum vs no. of iterations.
% close all
% clear all
% clc
% defining search input
x = linspace(0,0.6,150);
y = linspace(0,0.6,150);
% creating 2 dimentional array
[xx,yy] = meshgrid(x,y);
num_cases = 50;
% evaluate the stalagmite function
for i = 1:length(x)
for j = 1:length(y)
input_vector(1) = xx(i,j);
input_vector(2) = yy(i,j);
f(i,j) = stalagmite_func(input_vector);
end
end
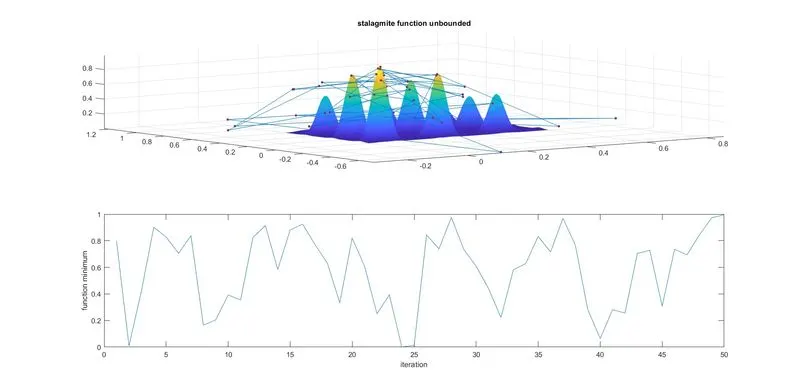
% study(1) unbounded
tic
for i = 1:num_cases
[results,fopt(i)] = ga(@stalagmite_func,2);
xopt(i) = results(1);
yopt(i) = results(2);
end
study1_time_1 = toc
% plotting the optimization of stalagmite function
figure(1)
subplot(2,1,1)
surfc(x,y,-f)
shading interp
hold on
plot3(xopt,yopt,-fopt,'marker','o','markersize',3,'markerfacecolor','r')
title('stalagmite function unbounded')
subplot(2,1,2)
plot(-fopt)
xlabel('iteration')
ylabel('function minimum')
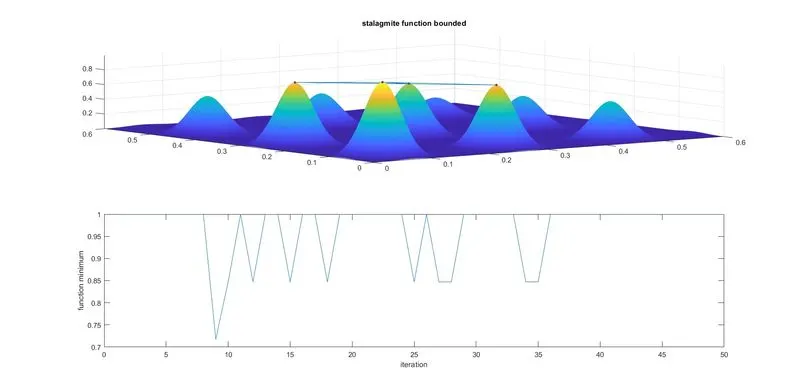
% case study(2) bounded
tic
for i = 1:num_cases
[results,fopt(i)] = ga(@stalagmite_func,2,[],[],[],[],[0;0],[0.6;0.6]);
xopt(i) = results(1);
yopt(i) = results(2);
end
study2_time_2 = toc
% plotting the optimization of stalagmite function
figure(2)
subplot(2,1,1)
surfc(x,y,-f)
shading interp
hold on
plot3(xopt,yopt,-fopt,'marker','o','markersize',3,'markerfacecolor','r')
title('stalagmite function bounded')
subplot(2,1,2)
plot(-fopt)
xlabel('iteration')
ylabel('function minimum')
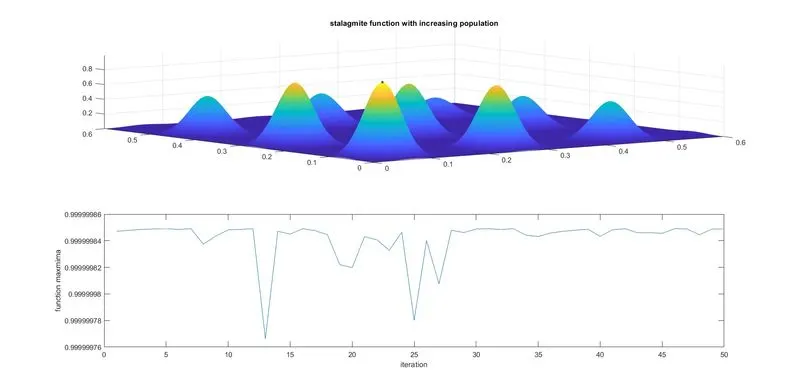
% case study (3) increase initial population for ga
tic
options = optimoptions('ga');
options = optimoptions(options,'populationsize',300);
for i = 1:num_cases
[results,fopt(i)] = ga(@stalagmite_func,2,[],[],[],[],[0;0],[0.6,0.6],[],[],options)
xopt(i) = results(1);
yopt(i) = results(2);
end
study3_time_3 = toc
% plotting the optimization function of stalagmite with increase population
figure(3)
subplot(2,1,1)
surfc(x,y,-f)
shading interp
hold on
plot3(xopt,yopt,-fopt,'marker','o','markersize',3,'markerfacecolor','r')
title('stalagmite function with increasing population')
subplot(2,1,2)
plot(-fopt)
xlabel('iteration')
ylabel('function maxmima')
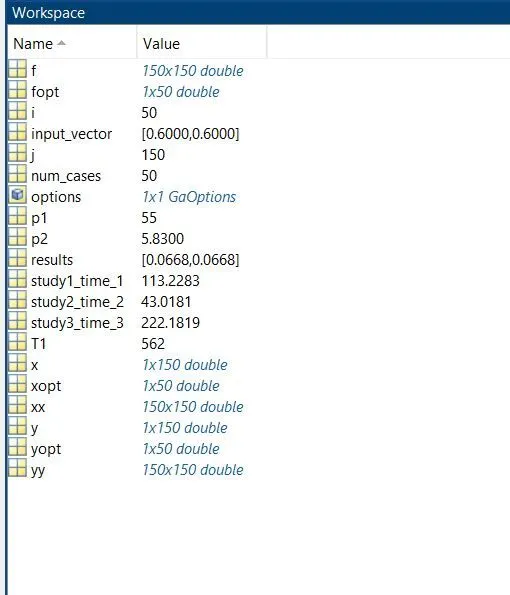
output
CODE EXPLANATION:-
- Firstly a random array of x & y values were created and the corresponding 2D array was obtained using meshgrid function.
- since we need to plot a 3d surface and we take the 2nd array of x,y using meshgrid command and store them in input_vector array, so that it can be used as an argument to call the function stalagmite.
- A nested loop was used to assign values from the array named input_vector.
- Input_vector is the input to the stalagmite function. the stalagmite function is written as seperate .
- minus(-) sign is given to the out put of stalagmite function so that after the ga process it we get the globle maxima (normally ga output global minima )
- tic-toc command are used to get the running time of each case.
- In the first case bound were not defined and the plots were made.now we store the results into xopt,yopt ,now to plot the surface of x,y,-f to gat the 3d plot.
- to get the time taken to complete cycle we used the tic toc command to record the time .
- negative (-)sign is given for f value inside surface function to get the stalagmite function upward
- bounding is given in next case so that the number of solution approch more accuracy.
- The global maxima is found in the last case .the x&y values for which the function has maxima value is also displayed the iteration were decresed to such a value the results didnot vary and the program consumed minimum time to execute.
UNBOUNDED FUNCTION GRAPH:-
for i = 1:num_cases
[results,fopt(i)] = ga(@stalagmite_func,2);
xopt(i) = results(1);
yopt(i) = results(2);
end
BOUNDED FUNCTION GRAPH:-
for i = 1:num_cases
[results,fopt(i)] = ga(@stalagmite_func,2,[],[],[],[],[0;0],[0.6;0.6]);
xopt(i) = results(1);
yopt(i) = results(2);
end
Increase initial population for GA GRAPH:-
tic
options = optimoptions('ga');
options = optimoptions(options,'populationsize',300);
for i = 1:num_cases
[results,fopt(i)] = ga(@stalagmite_func,2,[],[],[],[],[0;0],[0.6,0.6],[],[],options)
xopt(i) = results(1);
yopt(i) = results(2);
end
study3_time_3 = toc
Error & Solution
To create maxima from ga function . As we know that ga function only generate minimum value, it has become difficult to generate maximum value . i have tried many combination in fitness function as well as main function .
so that i finally got the solution