Week 4.1 - Genetic Algorithm
Genetic Algorithm
- AIM:-
Write a code in MATLAB to optimise the stalagmite function and find the global maxima of the function.
- OBJECTIVES:-
- Write a code in MATLAB to optimise the stalagmite function and find the global maxima of the function.
- Clearly explain the concept of genetic algorithm in your own words and also explain the syntax for GAin MATLAB in your report.
- Plot graphs for all 3 studies and for F maximum vs no. of iterations.
- INTRODUCTION
Genetic Algorithm (GA) is a search-based optimization technique based on the principles of Genetics and Natural Selection. It is frequently used to find optimal or near-optimal solutions to difficult problems which otherwise would take a lifetime to solve. It is frequently used to solve optimization problems, in research, and in machine learning.
Introduction to Optimization
Optimization is the process of making something better. In any process, we have a set of inputs and a set of outputs as shown in the following figure.
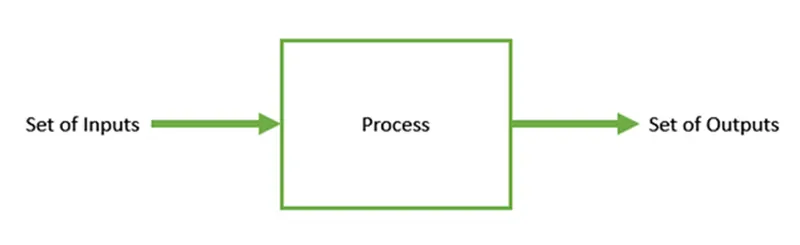
Optimization refers to finding the values of inputs in such a way that we get the “best” output values. The definition of “best” varies from problem to problem, but in mathematical terms, it refers to maximizing or minimizing one or more objective functions, by varying the input parameters.
The set of all possible solutions or values which the inputs can take make up the search space. In this search space, lies a point or a set of points which gives the optimal solution. The aim of optimization is to find that point or set of points in the search space.
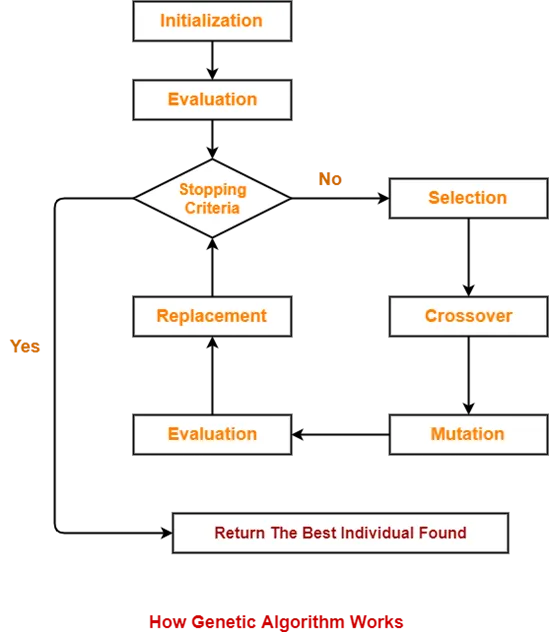
The following outline summarizes how the genetic algorithm works:
- The algorithm begins by creating a random initial population.
- The algorithm then creates a sequence of new populations. At each step, the algorithm uses the individuals in the current generation to create the next population. To create the new population, the algorithm performs the following steps:
- Scores each member of the current population by computing its fitness value. These values are called the raw fitness scores.
- Scales the raw fitness scores to convert them into a more usable range of values. These scaled values are called expectation values.
- Selects members, called parents, based on their expectation.
- Some of the individuals in the current population that have lower fitness are chosen as elite. These elite individuals are passed to the next population.
- Produces children from the parents. Children are produced either by making random changes to a single parent—mutation—or by combining the vector entries of a pair of parents—crossover.
- Replaces the current population with the children to form the next generation.
- The algorithm stops when one of the stopping criteria is met.
- The algorithm takes modified steps for linear and integer constraints.
- The algorithm is further modified for nonlinear constraints.
GA Syntax In MATLAB
- ga(stalagmite_fun,2) is the function to find minimum value of a equation using matlab. In this ‘ga’ represents the genetic algorithm, and ‘stalagmite_fun’ is the function name and ‘2’ is the number of variables as input. In a general way it is determined as
A=ga(func,nvars)
- For giving boundaries we have to choose syntax as:
A= ga(@stalagmite,2,[],[],[],[],[0;0],[.5;.5]
In this the ‘[]’ represents the linear constraints, and [0;0] and [0.5;0.5] are the upper and lower limits respectively.
- For the increased population type we have to change the syntax and also to add some more options as specifications. They are:
options=optimoptions('ga');
options=optimoptions(options,'populationsize',400);
ga(@stalagmite,2,[],[],[],[],[0;0],[.5;.5],[],[],options);
other Syntax for ga:
- x= ga(fun,nvars) finds a local unconstrained minimum, x, to the objective function, fun. nvars is the dimension (number of design variables) of fun.
- x= ga(fun,nvars,A,b) finds a local minimum x to fun, subject to the linear inequalities A*x ≤ b. ga evaluates the matrix product A*x as if x is transposed (A*x').
- x= ga(fun,nvars,A,b,Aeq,beq) finds a local minimum x to fun, subject to the linear equalities Aeq*x = beq and A*x ≤ b. (Set A=[] and b=[] if no linear inequalities exist.) ga evaluates the matrix product Aeq*x as if x is transposed (Aeq*x').
- x= ga(fun,nvars,A,b,Aeq,beq,lb,ub) defines a set of lower and upper bounds on the design variables, x, so that a solution is found in the range lb ≤ x ≤ ub. (Set Aeq=[] and beq=[] if no linear equalities exist.)
- x= ga(fun,nvars,A,b,Aeq,beq,lb,ub,nonlcon) subjects the minimization to the constraints defined in nonlcon. The function nonlcon accepts x and returns vectors C and Ceq, representing the nonlinear inequalities and equalities respectively. ga minimizes the fun such that C(x) ≤ 0 and Ceq(x) = 0. (Set lb=[] and ub=[] if no bounds exist.)
- x= ga(fun,nvars,A,b,Aeq,beq,lb,ub,nonlcon,options) minimizes with the default optimization parameters replaced by values in options. (Set nonlcon=[] if no nonlinear constraints exist.) Create options using optimoptions.
- x= ga(fun,nvars,A,b,Aeq,beq,lb,ub,nonlcon,intcon) or x = ga(fun,nvars,A,b,Aeq,beq,lb,ub,nonlcon,intcon,options) requires that the variables listed in intcon take integer values.
Mat lab Program.
Function Program

% The stalagmite function

function f=stalagmite(input_vector)

x=input_vector(1);
y=input_vector(2);

f1x=sin((5.1*pi*x)+0.5)^6;
f1y=sin((5.1*pi*y)+0.5)^6;
f2x=exp((-4*log(2)*(x-0.667)^2)/0.64);
f2y=exp((-4*log(2)*(y-0.667)^2)/0.64);

f=-f1x*f1y*f2x*f2y;
end


Main Program


clear all
close all
clc

% Search Space
x=linspace(0,0.6,150);
y=linspace(0,0.6,150);

%creating 2dimensional mesh
[xx,yy]=meshgrid(x,y);


% evaluating the stalagmite function

for i=1:length(xx)
    for j=1:length(yy)
        input_vector(1)=xx(i,j);
        input_vector(2)=yy(i,j);
        f(i,j)=stalagmite(input_vector);
    end
end

%study 1 - without boundaries

tic %calculating time taken for the study
% allocating the number of cases has to be performed
num_cases=50;

for i=1:num_cases
    [inputs,fopt(i)]=ga(@stalagmite,2);
    xopt(i)=inputs(1);
    yopt(i)=inputs(2);
end
study1_time=toc;

figure(1)
subplot(2,1,1)
hold on
surfc(x,y,f)
shading interp

%plot 3 command for plotting in 3 axis
plot3(xopt,yopt,fopt,'Marker','.','MarkerSize',10,'MarkerEdgeColor','r')
xlabel('x axis')
ylabel('y axis')
title('without boundaries')
subplot(2,1,2)
plot(fopt)
xlabel('iterations')
ylabel('F maximum')

% study 2- Allocting Upper and lower boundaries
tic
for z=1:num_cases
    [inputs,fopt(z)]=ga(@stalagmite,2,[],[],[],[],[0;0],[.5;.5]);
    xopt(z)=inputs(1);
    yopt(z)=inputs(2);
end
figure(2)
subplot(2,1,1)
hold on
surfc(x,y,f)
shading interp
study2_time=toc
%plot 3 command for plotting in 3 axis
plot3(xopt,yopt,fopt,'Marker','.','MarkerSize',10,'MarkerEdgeColor','r')
xlabel('x axis')
ylabel('y axis')
title('bounded inputs')
subplot(2,1,2)
plot(fopt)
xlabel('iterations')
ylabel('F maximum')


% study 3 - bounded inputs with incresed population
tic
options=optimoptions('ga');
options=optimoptions(options,'populationsize',400);
for z=1:num_cases
    [inputs,fopt(z)]=ga(@stalagmite,2,[],[],[],[],[0;0],[.5;.5],[],[],options);
    xopt(z)=inputs(1);
    yopt(z)=inputs(2);
end
figure(3)
subplot(2,1,1)
hold on
surfc(x,y,f)
shading interp
study3_time=toc
%plot 3 command for plotting in 3 axis
plot3(xopt,yopt,fopt,'Marker','.','MarkerSize',10,'MarkerEdgeColor','r')
xlabel('x axis')
ylabel('y axis')
title('bounded inputs with increased population')
subplot(2,1,2)
plot(fopt)
xlabel('iterations')
ylabel('F maximum')
Outputs
Figure 1
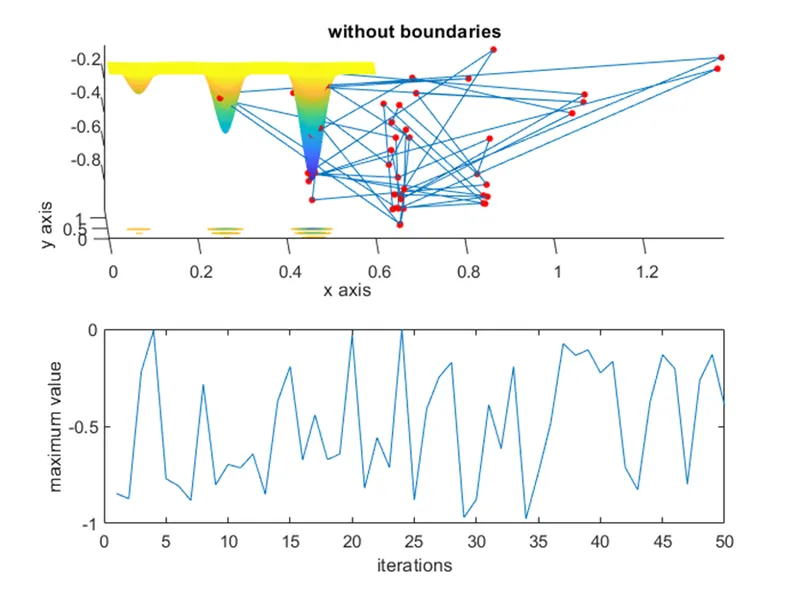
Figure 2
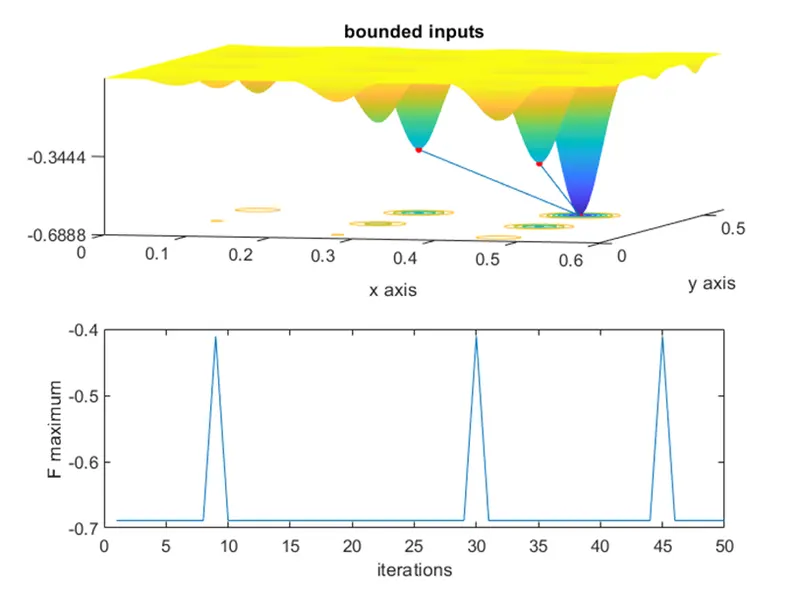
Figure 3
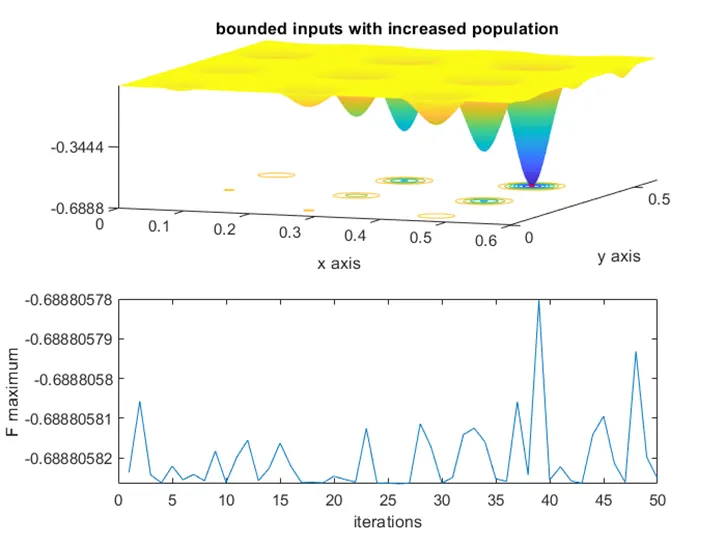
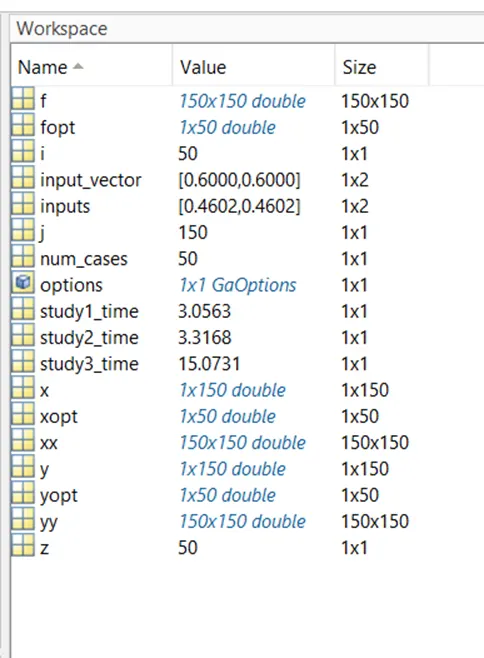
Errors occurred during the programming.
- Error 1.
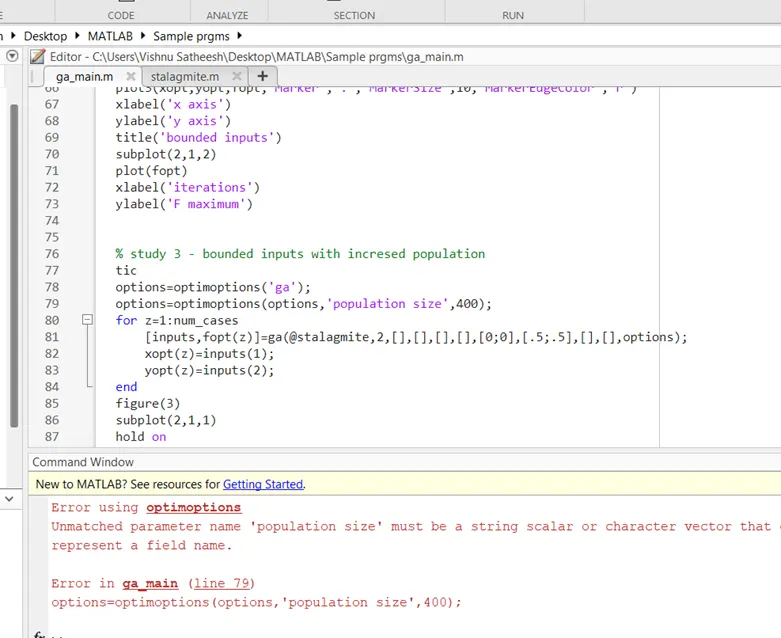
Solution : Removed the space between the word population size.
2. Error 2.
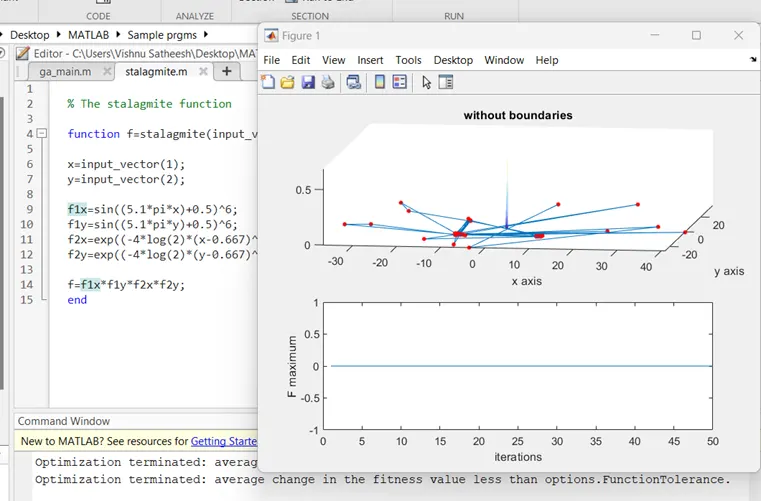
Solution: initially the plot was coming like this. After some research about the function equation added ‘-‘ symbol to the solution for ‘f’.
References
1. https://in.mathworks.com/help/gads/ga.html
2. https://skill-lync.com/knowledgebase/genetic-algorithm-explained
Function Program
% The stalagmite function
function f=stalagmite(input_vector)
x=input_vector(1);
y=input_vector(2);
f1x=sin((5.1*pi*x)+0.5)^6;
f1y=sin((5.1*pi*y)+0.5)^6;
f2x=exp((-4*log(2)*(x-0.667)^2)/0.64);
f2y=exp((-4*log(2)*(y-0.667)^2)/0.64);
f=-f1x*f1y*f2x*f2y;
end
Main Program
clear all
close all
clc
% Search Space
x=linspace(0,0.6,150);
y=linspace(0,0.6,150);
%creating 2dimensional mesh
[xx,yy]=meshgrid(x,y);
% evaluating the stalagmite function
for i=1:length(xx)
for j=1:length(yy)
input_vector(1)=xx(i,j);
input_vector(2)=yy(i,j);
f(i,j)=stalagmite(input_vector);
end
end
%study 1 - without boundaries
tic %calculating time taken for the study
% allocating the number of cases has to be performed
num_cases=50;
for i=1:num_cases
[inputs,fopt(i)]=ga(@stalagmite,2);
xopt(i)=inputs(1);
yopt(i)=inputs(2);
end
study1_time=toc;
figure(1)
subplot(2,1,1)
hold on
surfc(x,y,f)
shading interp
%plot 3 command for plotting in 3 axis
plot3(xopt,yopt,fopt,'Marker','.','MarkerSize',10,'MarkerEdgeColor','r')
xlabel('x axis')
ylabel('y axis')
title('without boundaries')
subplot(2,1,2)
plot(fopt)
xlabel('iterations')
ylabel('F maximum')
% study 2- Allocting Upper and lower boundaries
tic
for z=1:num_cases
[inputs,fopt(z)]=ga(@stalagmite,2,[],[],[],[],[0;0],[.5;.5]);
xopt(z)=inputs(1);
yopt(z)=inputs(2);
end
figure(2)
subplot(2,1,1)
hold on
surfc(x,y,f)
shading interp
study2_time=toc
%plot 3 command for plotting in 3 axis
plot3(xopt,yopt,fopt,'Marker','.','MarkerSize',10,'MarkerEdgeColor','r')
xlabel('x axis')
ylabel('y axis')
title('bounded inputs')
subplot(2,1,2)
plot(fopt)
xlabel('iterations')
ylabel('F maximum')
% study 3 - bounded inputs with incresed population
tic
options=optimoptions('ga');
options=optimoptions(options,'populationsize',400);
for z=1:num_cases
[inputs,fopt(z)]=ga(@stalagmite,2,[],[],[],[],[0;0],[.5;.5],[],[],options);
xopt(z)=inputs(1);
yopt(z)=inputs(2);
end
figure(3)
subplot(2,1,1)
hold on
surfc(x,y,f)
shading interp
study3_time=toc
%plot 3 command for plotting in 3 axis
plot3(xopt,yopt,fopt,'Marker','.','MarkerSize',10,'MarkerEdgeColor','r')
xlabel('x axis')
ylabel('y axis')
title('bounded inputs with increased population')
subplot(2,1,2)
plot(fopt)
xlabel('iterations')
ylabel('F maximum')