Genetic Algorithm
Aim:
To write the code in Matlab for optimise the stalagmite function and aslo to find the global maximaof the function.
Introduction:
Optimization:
Optimization is area of study that deals with Minimize or Maximize for particular function which depends on the multiple input parameters to obtain desired output.
Genetic algorithm:
A genetic algorithm (GA) is a method used for solving constrained and unconstrained optimization problems based on a natural selection process that is based on the concept of biological evolution. The Genetic Algorithm is based on Evaluation Theory proposed by Charles Darwin.
This algorithm modifies a population of individual solutions repeatedly. The genetic algorithm at each step randomly selects the individuals from the current population and uses them as parents to produce the children for the next generation. After the creation of successfully generation the population approach toward an optimal solution. The genetic algorithm is used for solving a variety of optimization problems that are not well suited for standard optimization algorithms and also for the problems in which the objective function is discontinuous, nondifferentiable, stochastic, or highly nonlinear. The genetic algorithm is also used for solving problems of mixed integer programming, where some components are restricted to be integer-valued.
In Matlab it is inbuilt function as ga which minimize the function.
Difference Between Genetic Algorithm and Classical Algorithm:
- The genetic algorithm generates a population of points at each iteration and the best point in the population approaches an optimal solution but in classical algorithm generates a single point at each iteration and the sequence of points approaches an optimal solution
- In ga selects the next population by computation which uses random number generators but in classical algorithm selects the next point in the sequence by a deterministic computation.
Genetic Algorithm Syntax:
- x = ga(fun,nvars)
x = ga(fun,nvars) finds a local unconstrained minimum, x, to the objective function, fun. nvars is the dimension (number of design variables) of fun that is function.
- x = ga(fun,nvars,A,b)
x = ga(fun,nvars,A,b) finds a local minimum x to fun, subject to the linear inequalities A*x ≤ b. ga evaluates the matrix product A*x as if x is transposed (A*x').
- x = ga(fun,nvars,A,b,Aeq,beq)
x = ga(fun,nvars,A,b,Aeq,beq) finds a local minimum x to fun, subject to the linear equalities Aeq*x = beq and A*x ≤ b. (Set A=[] and b=[] if no linear inequalities exist.) ga evaluates the matrix product Aeq*x as if x is transposed (Aeq*x').
- x = ga(fun,nvars,A,b,Aeq,beq,lb,ub)
x = ga(fun,nvars,A,b,Aeq,beq,lb,ub) defines a set of lower and upper bounds on the design variables, x, so that a solution is found in the range lb ≤ x ≤ ub. (Set Aeq=[] and beq=[] if no linear equalities exist).
- x = ga(fun,nvars,A,b,Aeq,beq,lb,ub,nonlcon)
x = ga(fun,nvars,A,b,Aeq,beq,lb,ub,nonlcon) subjects the minimization to the constraints defined in nonlcon. The function nonlcon accepts x and returns vectors C and Ceq, representing the nonlinear inequalities and equalities respectively. ga minimizes the fun such that C(x) ≤ 0 and Ceq(x) = 0. (Set lb=[] and ub=[] if no bounds exist).
- x = ga(fun,nvars,A,b,Aeq,beq,lb,ub,nonlcon,options)
x = ga(fun,nvars,A,b,Aeq,beq,lb,ub,nonlcon,options) minimizes with the default optimization parameters replaced by values in options. (Set nonlcon=[] if no nonlinear constraints exist). Create options using optimoptions.
- x = ga(fun,nvars,A,b,Aeq,beq,lb,ub,nonlcon,intcon)
x = ga(fun,nvars,A,b,Aeq,beq,lb,ub,nonlcon,intcon) requires that the variables listed in intcon take integer values.
- x = ga(fun,nvars,A,b,Aeq,beq,lb,ub,nonlcon,intcon,options)
x = ga(fun,nvars,A,b,Aeq,beq,lb,ub,nonlcon,intcon,options) requires that the variables listed in intcon take integer values.Create options using optimoptions.
- x = ga(problem)
x = ga(problem) finds the minimum for problem, a structure described in problem.
- [x,fval] = ga(___)
[x,fval] = ga(___), for any previous input arguments, also returns fval, the value of the fitness function at x.
- [x,fval,exitflag,output] = ga(___)
[x,fval,exitflag,output] = ga(___) also returns exit flag, an integer identifying the reason the algorithm terminated, and output, a structure that contains output from each generation and other information about the performance of the algorithm.
- [x,fval,exitflag,output,population,scores] = ga(___)
[x,fval,exitflag,output,population,scores] = ga(___) also returns a matrix population, whose rows are the final population, and a vector scores, the scores of the final population.
In this program we use the following syntax:
- x = ga(fun,nvars)
- x = ga(fun,nvars,A,b,Aeq,beq,lb,ub)
- x = ga(fun,nvars,A,b,Aeq,beq,lb,ub,nonlcon,intcon,options)
Stalagmite Function:
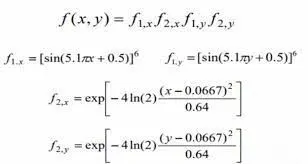
The stalagmite function we use is
f(x,y) = f1,x*f2,x*f1,y*f2,y
where f1,x, f2,x, f1,y, f2,y are
Program to optimise the Stalagmite function and find the Global Maxima of the function:
Stalagmite function:
%Stalgamite Function
function [f] = stalagmite_func(input_vectors)

x = input_vectors(1);
y = input_vectors(2);

term1 = (sin((5.1*pi*x)+0.5))^6;
term2 = (sin((5.1*pi*y)+0.5))^6;
term3 = exp(-4*log(2)*((x-0.0667)^2)/0.64);
term4 = exp(-4*log(2)*((y-0.0667)^2)/0.64);

f = -(term1*term2*term3*term4);
end- The function code is used for solving the stalagmite function.
- The function should contain function keyword followed by input arguments then the function name and folllowed by the output arguments In this program the function is defined as function
[f] = stalagmite_func (input_vectors) where function is the function keyword, [f] is input arguments, stalagmite_func is function name and input_vectors are output arguments.
- The file name stored and function name used in function definition should be same otherwise the program throws an error.
- The Function should contain input argument and the input which is to provided by user should match exact number of input arguments provided in the function definition .In this program the input arguments are input_vectors the user should provide values for these inputs if not provided it shows error msessage that the input missing varialbe is not defined.
- Likerwise the output arguments should match the output variables defined in the function definition. In this program f is used as output arguments and it is also defined in the program.
- The input_vectors are defined.
- The stalagmite function forumal is divided into four terms that is f1,x as term1, f1,y as term2, f2,x as term3 and f2,y as term4.
- The output argument f is obtained by multiplying the all terms such as term1,term2,term3,term4 and the ('-') negative sign is added because the ga always minimize the function.As far our challenge we need to find the maximum of the function, so we use the negative sign to find the maximum of the function.
- The 'end' command is used to stop the function running.
To optimise the Stalagmite function and find the Global Maxima of the function:
%Generic Algorithm

close all
clear all
clc

%Search space or Inputs
x = linspace(0,0.6,150);
y = linspace(0,0.6,150);

%Number of iterations
n = 50;

%Creating 2-D Array
[xx,yy] = meshgrid(x,y);

%Evaluation of Stalagmite Function
for i = 1:length(xx)
    for j = 1:length(yy)
        input_vectors(1) = xx(i,j);
        input_vectors(2) = yy(i,j);
        f(i,j) = stalagmite_func(input_vectors);
    end
end

%Study1 - Statistical Behaviour With Unbound Inputs
tic
for k = 1:n

    [inputs1,fopt1(k)] = ga(@stalagmite_func,2);
    xopt1(k) = inputs1(1);
    yopt1(k) = inputs1(2);

end
study_time1 = toc

figure(1)
subplot(2,1,1)
hold on
surf(x,y,-f)
shading interp
plot3(xopt1,yopt1,-fopt1,'marker','o','MarkerFaceColor','r')
xlabel ('X-values')
ylabel ('Y-values')
title ('Statistical Behaviour Unbound Inputs')
subplot(2,1,2)
plot(-fopt1)
xlabel ('Iterations')
ylabel ('Function Maximun')
title ('Statistical Behaviour Unbound Inputs')

%Study2 - Statistical Behaviour With Lower and Upper Bound Inputs
tic
for k = 1:n

    [inputs2,fopt2(k)] = ga(@stalagmite_func,2,[],[],[],[],[0;0],[1;1]);
    xopt2(k) = inputs2(1);
    yopt2(k) = inputs2(2);

end
study_time2 = toc

figure(2)
subplot(2,1,1)
hold on
surf(x,y,-f)
shading interp
plot3(xopt2,yopt2,-fopt2,'marker','o','MarkerFaceColor','r')
xlabel ('X-values')
ylabel ('Y-values')
title ('Statistical Behaviour With Lower and Upper Bound Inputs')
subplot(2,1,2)
plot(-fopt2)
xlabel ('Iterations')
ylabel ('Function Maximun')
title ('Statistical Behaviour With Lower and Upper Bound Inputs')

%Study3 - Statistical Behaviour With Increase in  PopulationSize to 200
option1 = optimoptions('ga');
option1 = optimoptions(option1,'PopulationSize',200);
tic
for k = 1:n

    [inputs3,fopt3(k)] = ga(@stalagmite_func,2,[],[],[],[],[0;0],[1;1],[],[],option1);
    xopt3(k) = inputs3(1);
    yopt3(k) = inputs3(2);

end
study_time3 = toc

figure(3)
subplot(2,1,1)
hold on
surf(x,y,-f)
shading interp
plot3(xopt3,yopt3,-fopt3,'marker','o','MarkerFaceColor','r')
xlabel ('X-values')
ylabel ('Y-values')
title ('Statistical Behaviour With Increase in  PopulationSize to 200')
subplot(2,1,2)
plot(-fopt3)
xlabel ('Iterations')
ylabel ('Function Maximun')
title ('Statistical Behaviour With Increase in  PopulationSize to 200')

%Study4 - Statistical Behaviour With Increase in  PopulationSize to 500
option2 = optimoptions('ga');
option2 = optimoptions(option2,'PopulationSize',500);
tic
for k=1:n

    [inputs4,fopt4(k)] = ga(@stalagmite_func,2,[],[],[],[],[0;0],[1;1],[],[],option2);
    xopt4(k) = inputs4(1);
    yopt4(k) = inputs4(2);

end
study_time4 = toc

figure(4)
subplot(2,1,1)
hold on
surf(x,y,-f)
shading interp
plot3(xopt4,yopt4,-fopt4,'marker','o','MarkerFaceColor','r')
xlabel ('X-values')
ylabel ('Y-values')
title ('Statistical Behaviour With Increase in  PopulationSize to 500')
subplot(2,1,2)
plot(-fopt4)
xlabel ('Iterations')
ylabel ('Function Maximun')
title ('Statistical Behaviour With Increase in PopulationSize to 500')- It is important to write Close all, Clear all and clc before start of program,because Close all - deletes the current figures or thespecified figures, Clear all - deletes the data from workspace and clear the system memory and clc - clear the data present in the Command Window and gives clean Command Window.
- We define the inputs or search space x and y using 'Linspace' command for 0 and 0.6 upto 150 values. The' Linspace' command will create evenly spaced values.
- The number of iteration the ga wil run is defined as 50.
- 1-D array is converted into 2-D array using 'Meshgrid' command.
- In this program 'For loop' used to execute the set of command for specific number of times.
- The for loop is used for iteration of each value of xx and yy it is stored in array called input_vectors, that is the input_ vectors will store the every values of xx and yy.The variables used for this iteratrion is i for xx and j for yy.
- The stalagmite function is calling the function stalagmite_func (input_vectors).The Call of Function is used to invoke the function by just mentioning the function name and input arguments.By specifing the function name and their inputs the function will be called of and runs the function program.
- The f(i,j) is used to store the function executed values for every input_vectors.
- The 'end' command is used to stop the for loop running.
The Genetic Algorithm is studied using four studies and they are as follows:
%Study1 - Statistical Behaviour With Unbound Inputs
tic
for k=1:n

    [inputs1,fopt1(k)] = ga(@stalagmite_func,2);
    xopt1(k) = inputs1(1);
    yopt1(k) = inputs1(2);

end
study_time1 = toc

figure(1)
subplot(2,1,1)
hold on
surf(x,y,-f)
shading interp
plot3(xopt1,yopt1,-fopt1,'marker','o','MarkerFaceColor','r')
xlabel ('X-values')
ylabel ('Y-values')
title ('Statistical Behaviour Unbound Inputs')
subplot(2,1,2)
plot(-fopt1)
xlabel ('Iterations')
ylabel ('Function Maximun')
title ('Statistical Behaviour Unbound Inputs')- In this study we do not use the upper and lower bound inputs.
- In this program 'For loop' used to execute the set of command for specific number of times.
- The Varialbe k is asigned for the genetic algorithm where k is 1:n where n is 50, so the genetic algorithm runs the program for 50 iterations.
- The genetic syntax used for this study is x = ga(fun,nvars) where ga is inbuilt matlab function for genetic algorithm, x is the output argument , fun is function to optimized and nvars is number of variables used in the function to be optimized.
- In this program x that is output argument is defined as [inputs1,fopt1] and the function is stalagmit_func which is to be optimized and the number of variables is 2 used in the function.
- This x = ga(fun,nvars) is used to find the local minimum to the function.
- The input1 of the genetic algorithm are stored to xopt1 and yopt1.
- The 'end' command is used to stop the for loop running.
- The study time is noted and stored using 'tic and toc' function, where tic is used to record the current time and toc is uses the recorded time to find the ellapsed time.
- The 'Figure(1)' command is used to create the figure graphical object.
- The 'Subplot' command is used for plotting two graph in same window or same figure.
- The 'Surf' command is used plot the 3-D graph.In this program the 'surf' command is used for 3-D visulaisation of the function. The minus sign is used to find the maximum of the function.
- The 'Shading Interp' command is used for shades the surface of the plot or eleminates the grid line present in the plot and makes smooth surface for the plot.
- The 'Plot3' command is used for 3-D representaion of the plot between xopt1,yopt1 and fopt1.The minus sign is used to find the maximum of the function.The 'marker''o'command is used to plot o size to the points in the plot and 'Markerfacecolor'r' command is used for red color marker in the plot.
- The "xlabel ('X-values')" is mentioned to show x-axis as X-values in the graph and "ylabel ('Y-values')" command is used to y-axis as Y-values in the graph.
- The ''title' command is used to give title to the plot. In this program the title is given as Statistical Behaviour Unbound Inputs.
- The 'plot' command is used for plotiing the optimized function that is fopt1 for every iterations.The minus sign is used to find the maximum of the function.
- The "xlabel ('Iteration')" is mentioned to show x-axis as Iteration in the graph and "ylabel ('Function Maximum')" command is used to y-axis as Function Maximum in the graph.
- The 'title' command is used to give title to the plot. In this program the title is given as Statistical Behaviour Unbound Inputs.
Output:
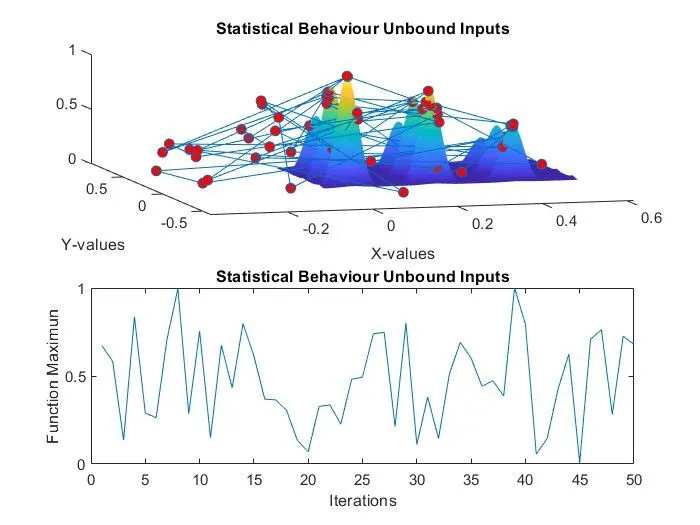
In this study we get multiple results where more number of red dots are shown in the plot due to random sampling and the x and y values that is maximum value are in the range of above 0.6 and below 0.So this study does not provide the correct value which we required.So further optimization is required. The Study_time1 is recored as 2.4593 secs.
For further optimization we provide upper bound and lower bound for the variables in the function to get the desired output.
%Study2 - Statistical Behaviour With Lower and Upper Bound Inputs
tic
for k=1:n

    [inputs2,fopt2(k)] = ga(@stalagmite_func,2,[],[],[],[],[0;0],[1;1]);
    xopt2(k) = inputs2(1);
    yopt2(k) = inputs2(2);

end
study_time2 = toc

figure(2)
subplot(2,1,1)
hold on
surf(x,y,-f)
shading interp
plot3(xopt2,yopt2,-fopt2,'marker','o','MarkerFaceColor','r')
xlabel ('X-values')
ylabel ('Y-values')
title ('Statistical Behaviour With Lower and Upper Bound Inputs')
subplot(2,1,2)
plot(-fopt2)
xlabel ('Iterations')
ylabel ('Function Maximun')
title ('Statistical Behaviour With Lower and Upper Bound Inputs')- In this study we do not use the upper and lower bound inputs.
- In this program 'For loop' used to execute the set of command for specific number of times.
- The Varialbe k is asigned for the genetic algorithm where k is 1:n where n is 50, so the genetic algorithm runs the program for 50 iterations.
- The genetic syntax used for this study is x = ga(fun,nvars,A,b,Aeq,beq,lb,ub) where ga is inbuilt matlab function for genetic algorithm, x is the output argument , fun is function to optimized and nvars is number of variables used in the function to be optimized,A,B are linear inequalities and Aeq, Beq are linear equalities,lb and ub are lower and upper bound for x that is lb<x<ub.
- In this program x that is output argument is defined as [inputs2,fopt2] and the function is stalagmit_func which is to be optimized and the number of variables is 2 used in the function, the A,B,Aeq,Beq are not provided so they are metion by parathesis that is by '[]' for all these four parametrs.The lb and ub are mention as 0;0 for and 1;1 for ub.
- This x = ga(fun,nvars,A,b,Aeq,beq,lb,ub) is when the lower and upper bounds are used for the variables in the function.
- The input2 of the genetic algorithm are stored to xopt2 and yopt2.
- The 'end' command is used to stop the for loop running.
- The study time is noted and stored using 'tic and toc' function, where tic is used to record the current time and toc is uses the recorded time to find the ellapsed time.
- The 'Figure(2)' command is used to create the figure graphical object.
- The 'Subplot' command is used for plotting two graph in same window or same figure.
- The 'Surf' command is used plot the 3-D graph.In this program the 'surf' command is used for 3-D visulaisation of the function. The minus sign is used to find the maximum of the function.
- The 'Shading Interp' command is used for shades the surface of the plot or eleminates the grid line present in the plot and makes smooth surface for the plot.
- The 'Plot3' command is used for 3-D representaion of the plot between xopt2,yopt2 and fopt2.The minus sign is used to find the maximum of the function.The 'marker''o'command is used to plot o size to the points in the plot and 'Markerfacecolor'r' command is used for red color marker in the plot.
- The "xlabel ('X-values')" is mentioned to show x-axis as X-values in the graph and "ylabel ('Y-values')" command is used to y-axis as Y-values in the graph.
- The ''title' command is used to give title to the plot. In this program the title is given as Statistical Behaviour with Lower and Upper Bound Inputs.
- The 'plot' command is used for plotiing the optimized function that is fopt2 for every iterations.The minus sign is used to find the maximum of the function.
- The "xlabel ('Iteration')" is mentioned to show x-axis as Iteration in the graph and "ylabel ('Function Maximum')" command is used to y-axis as Function Maximum in the graph.
- The 'title' command is used to give title to the plot. In this program the title is given as Statistical Behaviour with Lower and Upper Bound Inputs.
Output:
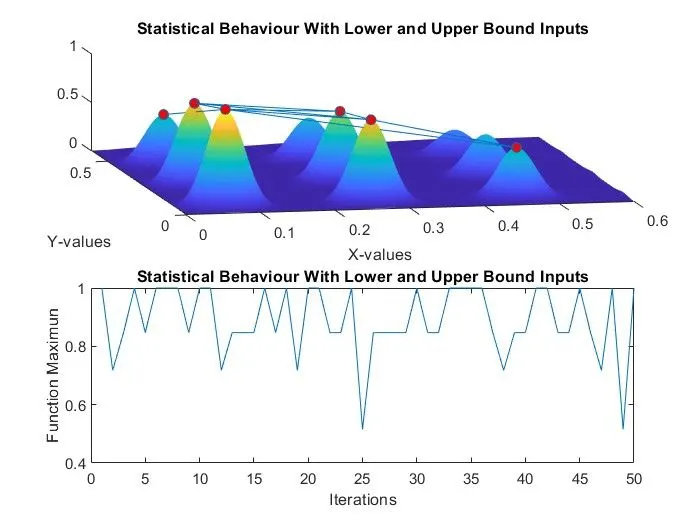
In this study the results are clear compared to the previous study but the x and y values that is maximum value range from 0.7 to 0.85, but this study does not provide the correct value which we required.The Study_time2 is recorded as 3.3244 secs. Hence further optimization is required.
The Genetic algorithm starts with random sampling. In this program ga takes two sets of 50 number of random samples since we have two variable and it is recogonized as population.If intial population is too small ga finds local minimum or maximum instead of global minimum or maximum.So in next study we change the population size for optimization.
%Study3 - Statistical Behaviour With Increase in PopulationSize to 200
option1 = optimoptions('ga');
option1 = optimoptions(option1,'PopulationSize',200);
tic
for k = 1:n
[inputs3,fopt3(k)] = ga(@stalagmite_func,2,[],[],[],[],[0;0],[1;1],[],[],option1);
xopt3(k) = inputs3(1);
yopt3(k) = inputs3(2);
end
study_time3 = toc
figure(3)
subplot(2,1,1)
hold on
surf(x,y,-f)
shading interp
plot3(xopt3,yopt3,-fopt3,'marker','o','MarkerFaceColor','r')
xlabel ('X-values')
ylabel ('Y-values')
title ('Statistical Behaviour With Increase in PopulationSize to 200')
subplot(2,1,2)
plot(-fopt3)
xlabel ('Iterations')
ylabel ('Function Maximun')
title ('Statistical Behaviour With Increase in PopulationSize to 200')
- In this study we do not use the upper and lower bound inputs.
- In this program 'For loop' used to execute the set of command for specific number of times.
- The Varialbe k is asigned for the genetic algorithm where k is 1:n where n is 50, so the genetic algorithm runs the program for 50 iterations.
- The genetic syntax used for this study is x = ga(fun,nvars,A,b,Aeq,beq,lb,ub,nonlcon,intcon,options) ga is inbuilt matlab function for genetic algorithm,x is the output argument , fun is function to optimized and nvars is number of variables used in the function to be optimized,A,B are linear inequalities and Aeq, Beq are linear equalities,lb and ub are lower and upper bound for x that is lb<x<ub, nonlcon is non-collinear constrains, intcon is the collinear takes integer value, option is used for change the parameters of the optimization present in option values in optimoptions.
- In this program x that is output argument is defined as [inputs3,fopt3] and the function is stalagmit_func which is to be optimized and the number of variables is 2 used in the function ,the A,B,Aeq,Beq are not provided so they are metion by parathesis that is by '[]' for all these four parametrs.The lb and ub are mention as 0;0 for and 1;1 for ub,as non-collinear and intcoln are not provided, so we also use '[]' for these parameters.In options1 we want to change the population value, we use otimoptions and the 'Populationsize' parameters and metioned 200.The syntax is option = optimoptions(ga,'Populationsize',200).
- The input3 of the genetic algorithm are stored to xopt3 and yopt3.
- The 'end' command is used to stop the for loop running.
- The study time is noted and stored using 'tic and toc' function, where tic is used to record the current time and toc is uses the recorded time to find the ellapsed time.
- The 'Figure(3)' command is used to create the figure graphical object.
- The 'Subplot' command is used for plotting two graph in same window or same figure.
- The 'Surf' command is used plot the 3-D graph.In this program the 'surf' command is used for 3-D visulaisation of the function. The minus sign is used to find the maximum of the function.
- The 'Shading Interp' command is used for shades the surface of the plot or eleminates the grid line present in the plot and makes smooth surface for the plot.
- The 'Plot3' command is used for 3-D representaion of the plot between xopt3,yopt3 and fopt3.The minus sign is used to find the maximum of the function.The 'marker''o'command is used to plot o size to the points in the plot and 'Markerfacecolor'r' command is used for red color marker in the plot.
- The "xlabel ('X-values')" is mentioned to show x-axis as X-values in the graph and "ylabel ('Y-values')" command is used to y-axis as Y-values in the graph.
- The ''title' command is used to give title to the plot. In this program the title is given as Statistical Behaviour with Increase in Population to 200.
- The 'plot' command is used for plotiing the optimized function that is fopt3 for every iterations.The minus sign is used to find the maximum of the function.
- The "xlabel ('Iteration')" is mentioned to show x-axis as Iteration in the graph and "ylabel ('Function Maximum')" command is used to y-axis as Function Maximum in the graph.
- The 'title' command is used to give title to the plot. In this program the title is given as Statistical Behaviour with Increase in Population to 200.
Output:
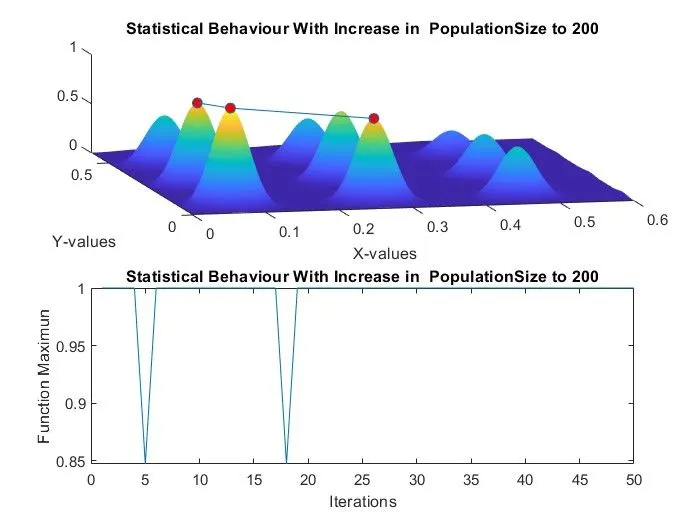
In this study we obtained more clear results than the previous one.The maximum value that is x and y values are 0.0668 and 0.0668 but in another plot there is two maximum values or two peaks for the populationsize 200.But we need the global maximum, so further optimization is required.The Study_time3 is recorded as 9.2540 secs.
The function needs further optimization by increasing the population size to 500.
%Study4 - Statistical Behaviour With Increase in  PopulationSize to 500
option2 = optimoptions('ga');
option2 = optimoptions(option2,'PopulationSize',500);
tic
for k=1:n

    [inputs4,fopt4(k)] = ga(@stalagmite_func,2,[],[],[],[],[0;0],[1;1],[],[],option2);
    xopt4(k) = inputs4(1);
    yopt4(k) = inputs4(2);

end
study_time4 = toc

figure(4)
subplot(2,1,1)
hold on
surf(x,y,-f)
shading interp
plot3(xopt4,yopt4,-fopt4,'marker','o','MarkerFaceColor','r')
xlabel ('X-values')
ylabel ('Y-values')
title ('Statistical Behaviour With Increase in  PopulationSize to 500')
subplot(2,1,2)
plot(-fopt4)
xlabel ('Iterations')
ylabel ('Function Maximun')
title ('Statistical Behaviour With Increase in PopulationSize to 500')- In this study we do not use the upper and lower bound inputs.
- In this program 'For loop' used to execute the set of command for specific number of times.
- The Varialbe k is asigned for the genetic algorithm where k is 1:n where n is 50, so the genetic algorithm runs the program for 50 iterations.
- The genetic syntax used for this study is x = ga(fun,nvars,A,b,Aeq,beq,lb,ub,nonlcon,intcon,options) ga is inbuilt matlab function for genetic algorithm,x is the output argument , fun is function to optimized and nvars is number of variables used in the function to be optimized,A,B are linear inequalities and Aeq, Beq are linear equalities,lb and ub are lower and upper bound for x that is lb<x<ub, nonlcon is non-collinear constrains, intcon is the collinear takes integer value, option is used for change the parameters of the optimization present in option values in optimoptions.
- In this program x that is output argument is defined as [inputs4,fopt4] and the function is stalagmit_func which is to be optimized and the number of variables is 2 used in the function ,the A,B,Aeq,Beq are not provided so they are metion by parathesis that is by '[]' for all these four parametrs.The lb and ub are mention as 0;0 for and 1;1 for ub,as non-collinear and intcoln are not provided, so we also use '[]' for these parameters.In options2 we want to change the population value, we use otimoptions and the 'Populationsize' parameters and metioned 500.The syntax is option = optimoptions(ga,'Populationsize',500).
- The input4 of the genetic algorithm are stored to xopt4 and yopt4.
- The 'end' command is used to stop the for loop running.
- The study time is noted and stored using 'tic and toc' function, where tic is used to record the current time and toc is uses the recorded time to find the ellapsed time.
- The 'Figure(4)' command is used to create the figure graphical object.
- The 'Subplot' command is used for plotting two graph in same window or same figure.
- The 'Surf' command is used plot the 3-D graph.In this program the 'surf' command is used for 3-D visulaisation of the function. The minus sign is used to find the maximum of the function.
- The 'Shading Interp' command is used for shades the surface of the plot or eleminates the grid line present in the plot and makes smooth surface for the plot.
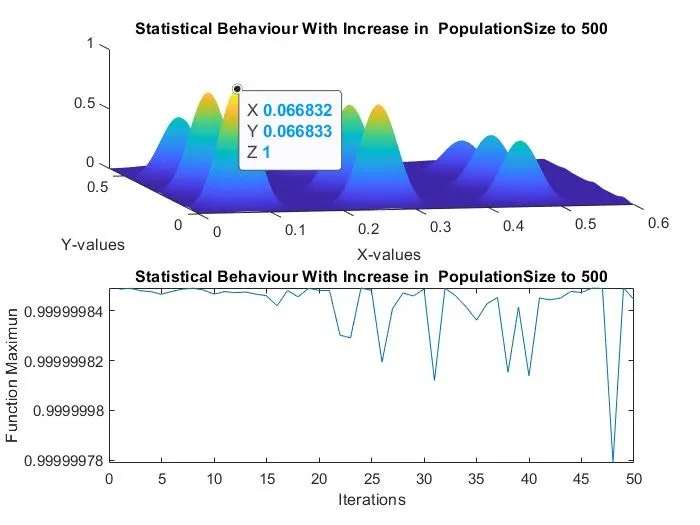
- The 'Plot3' command is used for 3-D representaion of the plot between xopt4,yopt4 and fopt4.The minus sign is used to find the maximum of the function.The 'marker''o'command is used to plot o size to the points in the plot and 'Markerfacecolor'r' command is used for red color marker in the plot.
- The "xlabel ('X-values')" is mentioned to show x-axis as X-values in the graph and "ylabel ('Y-values')" command is used to y-axis as Y-values in the graph.
- The ''title' command is used to give title to the plot. In this program the title is given as Statistical Behaviour with Increase in Population to 500.
- The 'plot' command is used for plotiing the optimized function that is fopt4 for every iterations.The minus sign is used to find the maximum of the function.
- The "xlabel ('Iteration')" is mentioned to show x-axis as Iteration in the graph and "ylabel ('Function Maximum')" command is used to y-axis as Function Maximum in the graph.
- The 'title' command is used to give title to the plot. In this program the title is given as Statistical Behaviour with Increase in Population to 500.
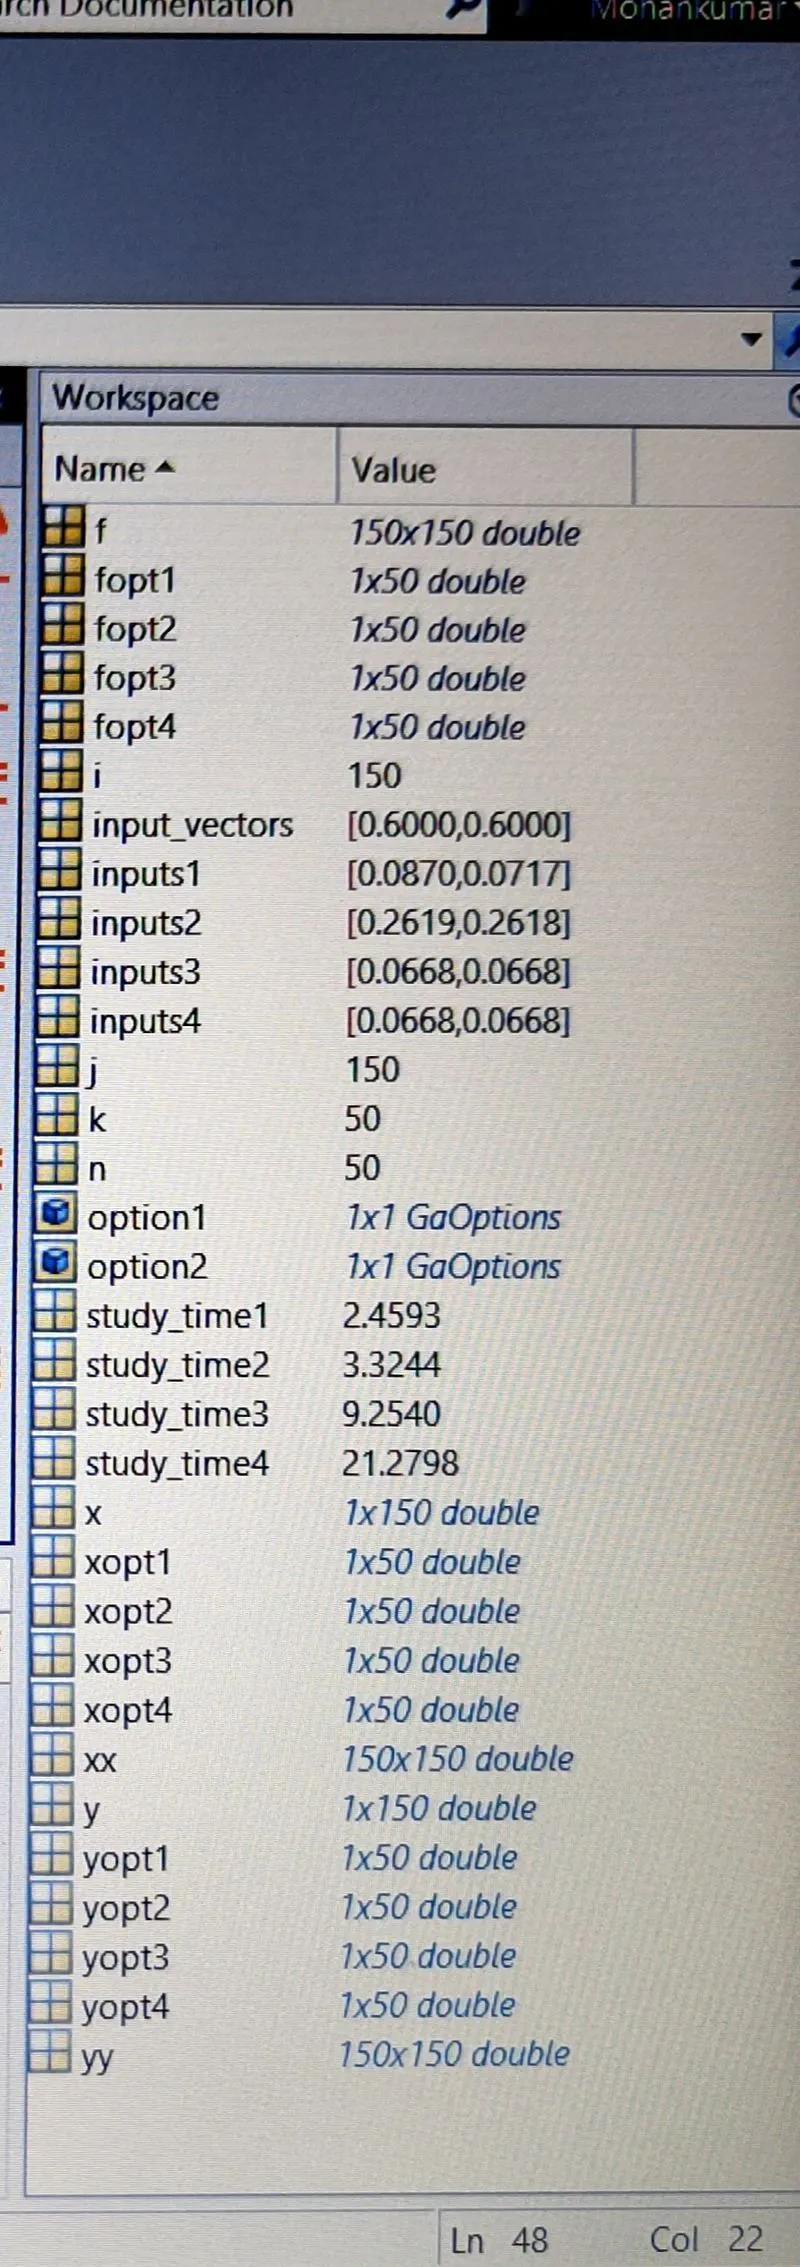
Screenshots showing errors thrown in command window:
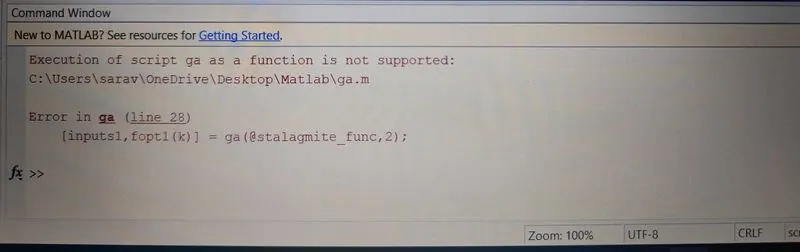
Steps taken to overcome those errors:
I changed my file name from ga to global_maximum and the program runs without any error.
Conclusion:
Thus the code is written in Matlab for optimise the stalagmite function and aslo the global maximaof the function is calculated.