Week 4.1 - Genetic Algorithm
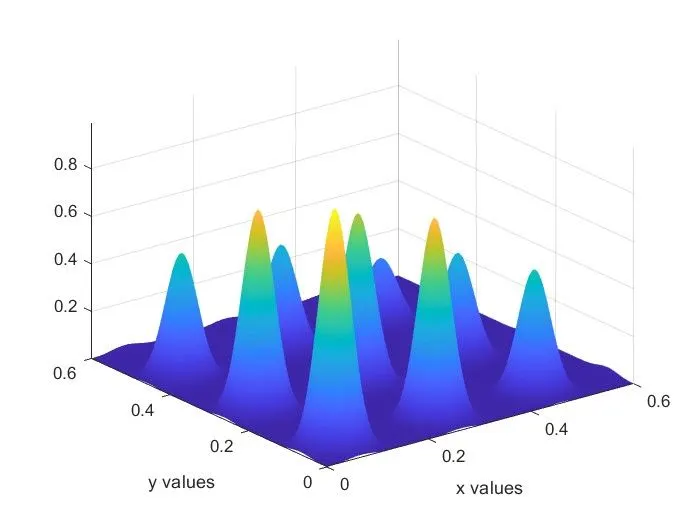
AIM: Write a code in MATLAB to optimise the stalagmite function and find the global maxima of the function.
INTRODUCTION
Optimisation : Optimisation is a decision-making process, it helps to find the best results
Under a set of prioritized criteria or constraints. it is a procedure that is executed iteratively by comparing various solutions till an optimum or a satisfactory solution is found
These include maximizing factors such as productivity, strength, reliability, efficiency, utilization, etc
Genetic Algorithm GA: Genetic algorithm (GA) is a search-based optimization technique based on the principles of genetics and natural selection. it is frequently used to find the optimal or near-optimal solutions
It is frequently used to solve optimization problems, in research, and in machine learning.
Input Function:
`f(x,y) = f1,x *f2,x*f1,y*f2,y`
where
`f1,x = [sin(5.1pix+0.5)]^6`
`f1,y=[sin(5.1piy+0.5)]^6`
`f2,x = exp[- (4ln(2)(x-0.0667)^2)/0.64]`
`f2,y = exp[- (4ln(2)(y-0.0667)^2)/0.64]`
`f = -(f1,x*f1,y*f2,x*f2,y)`
STEPWISE CODE EXPLANATION
1. start with clear all, close all, clc to clear all content previously stored
2. linspace command is used to define 150 x & y values between 0 to 0.6 with run 50 times (num_cases)
3.meshgrid command is used to form two dimensional array
4. for loop is executed to evaluate the stalagmite function. evaluating the stalagmite function here the function code (stalagmite.m)
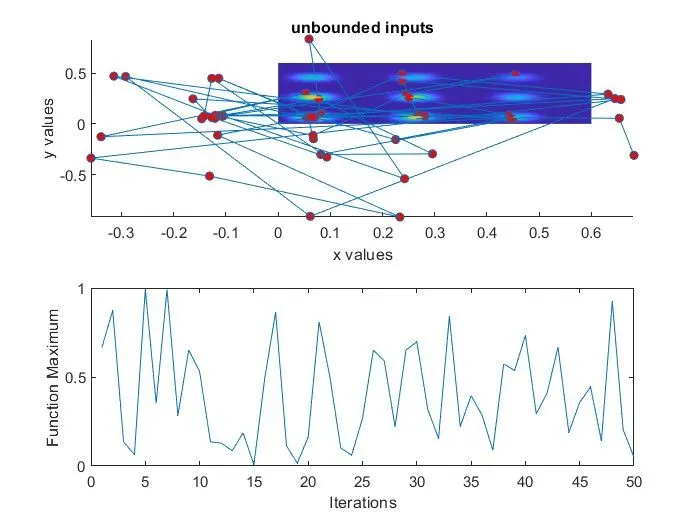
5. for STUDY 1 statistical behavior for loop is executed and also used stalagmite function (stalagmite_fun.m), And tic and toc command is used to measure the time taken for execution.
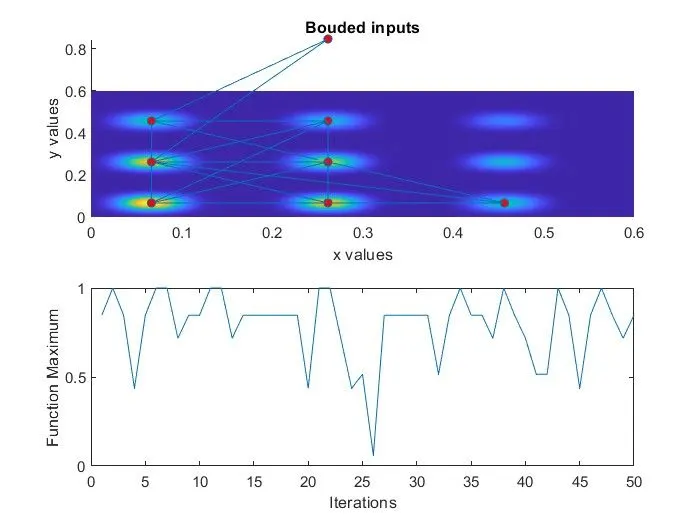
6. for STUDY 2 statistical behavior with upper and lower bounds executed stalagmite function (stalagmite_fun.m), And tic and toc command is used to measure the time taken for execution.
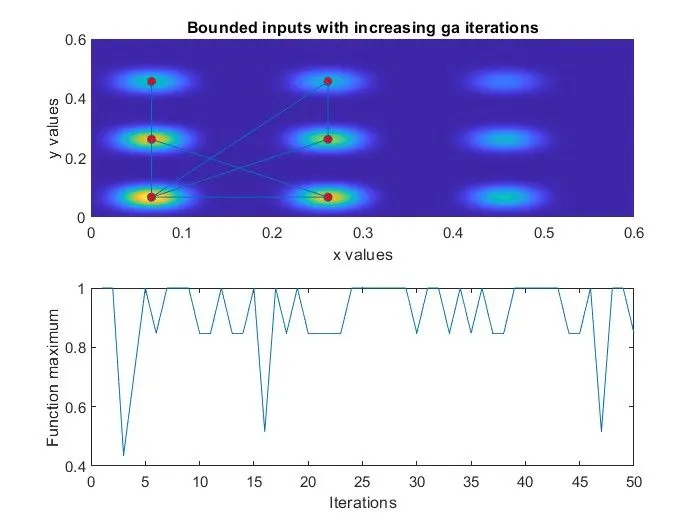
7. for STUDY 3 with increasing integrations, for loop is executed stalagmite function (stalagmite_fun.m), And tic and toc command is used to measure the time taken for execution.
MAIN code
Evaluting stalagmite Function program
clear all
close all
clc

%Defining search space
x = linspace(0,0.6,150);
y = linspace(0,0.6,150);

% creating a 2-dimensional mesh
[xx yy] = meshgrid(x,y);

%Evaluating the stalagmite function
for i = 1:length(xx)
    for j = 1:length(yy)
        input_vector(1) = xx(i,j);
        input_vector(2) = yy(i,j);
        f(i,j) = stalagmite(input_vector);
    end
end
surfc(xx,yy,-f)
xlabel('x values')
ylabel('y values')
shading interp
[inputs,fval] = ga(@stalagmite,2)
Function Code
%stalagmite function with input_vector which contains x and y variables
function [f] = stalagmite(input_vector)
x = input_vector(1);
y = input_vector(2);
f1 = (sin(5.1*pi*x+0.5))^6;
f2 = (sin(5.1*pi*y+0.5))^6;
f3 = exp(-4*log(2)*(x-0.0667)^2/0.64);
f4 = exp(-4*log(2)*(y-0.0667)^2/0.64);

f = -(f1*f2*f3*f4)
end
Result
MATLAB CODE2
Evaluating the stalagmite function
clear all
close all
clc

%Study Statistical Behavior


x = linspace(0,0.6,150);
y = linspace(0,0.6,150);
num_case = 50

% creating a 2-dimensional mesh

[xx, yy] = meshgrid(x,y);

%Evaluating the stalagmite function

for i = 1:length(xx)
    for j = 1:length(yy)
        input_vector(1) = xx(i,j);
        input_vector(2) = yy(i,j);
        f(i,j) = stalagmite_fun(input_vector);
    end
end

% STUDY 1 - statistical behavior

tic
for i = 1:num_case
    [inputs, fopt(i)] = ga(@stalagmite_fun,2);
    xopt(i) = inputs(1);
    yopt(i) = inputs(2);
end

study1_time = toc

figure(1)
subplot(2,1,1)
hold on
surfc(xx,yy,-f)
xlabel('x values')
ylabel('y values')
shading interp
plot3(xopt,yopt,-fopt,'marker','o','markersize',5,'markerfacecolor','r')
title('unbounded inputs')
subplot(2,1,2)
plot(-fopt)
xlabel('Iterations')
ylabel('Function Maximum')

tic


% STUDY 2 - statistical behavior -with upper & lower bound

 for i = 1:num_case
     [inputs , fopt(i)] = ga(@stalagmite_fun,2,[],[],[],[],[0,0],[1:1]);
     xopt(i) = inputs(1);
     yopt(i) = inputs(2);
 end
 study2_time = toc

 figure(2)
 subplot(2,1,1)
 hold on
 surfc(xx,yy,-f)
 xlabel('x values')
 ylabel('y values')
 shading interp
 plot3(xopt,yopt,-fopt,'marker','o','markersize',5,'markerfacecolor','r')
title('Bouded inputs')
subplot(2,1,2)
plot(-fopt)
xlabel('Iterations')
ylabel('Function Maximum')

tic


%STUDY 3 - Increasing GA iterations

options = optimoptions('ga')
options = optimoptions(options,'populationSize',150)

tic

for i = 1:num_case
    [inputs , fopt(i)] = ga(@stalagmite_fun,2,[],[],[],[],[0,0],[1:1],[],[],options);
    xopt(i) = inputs(1);
    yopt(i) = inputs(2);
end
study3_time = toc

figure(3)
subplot(2,1,1)
hold on
surfc(xx,yy,-f)
xlabel('x values')
ylabel('y values')
shading interp
plot3(xopt,yopt,-fopt,'marker','o','markersize',5,'markerfacecolor','r')
title('Bounded inputs with increasing ga iterations')
subplot(2,1,2)
plot(-fopt)
xlabel('Iterations')
ylabel('Function maximum')
tic
Function code for statistical Behavior
%stalagmite function with input_vector which contains x and y variables
function [f] = stalagmite_fun(input_vector)
x = input_vector(1);
y = input_vector(2);
f1 = (sin(5.1*pi*x+0.5))^6;
f2 = (sin(5.1*pi*y+0.5))^6;
f3 = exp(-4*log(2)*(x-0.0667)^2/0.64);
f4 = exp(-4*log(2)*(y-0.0667)^2/0.64);

f = -(f1*f2*f3*f4);
end
RESULTS
output
STUDY 1
STUDY 2
STUDY 3
ERROR-1
- Mention the errors while programming.
Mostly I was faced with an error is I writing the wrong spell
- Steps were taken to overcome those errors.
for the error i just took a over all look on the program
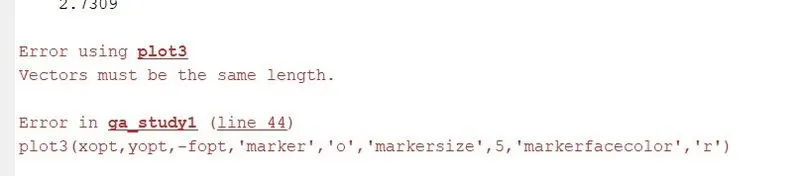
ERROR-2
- Mention the errors while programming.
I wrote the code with different vectors instead of both (i) written as i and j
- Steps were taken to overcome those errors.
I just read the error and understand the meaning and write as the same vector
- Screenshots showing errors thrown in the command window.
References:
- https://skill-lync.com/knowledgebase/genetic-algorithm-explained