Week 4.1 - Genetic Algorithm
AIM :
To write a code in MATLAB to optimise the stalagmite function and find the global maxima of the function.
OBJECTIVE :
- Write a code in MATLAB to optimise the stalagmite function and find the global maxima of the function.
- Clearly expalin the concept of genetic algorithm in your own words and also explain the syntax for ga in MATLAB in your report.
- To plot graphs for all 3 studies and for F maximum vs no. of iterations. Title and axes labels are a must, legends could be shown if necessary.
THEORY :
Stalagmite
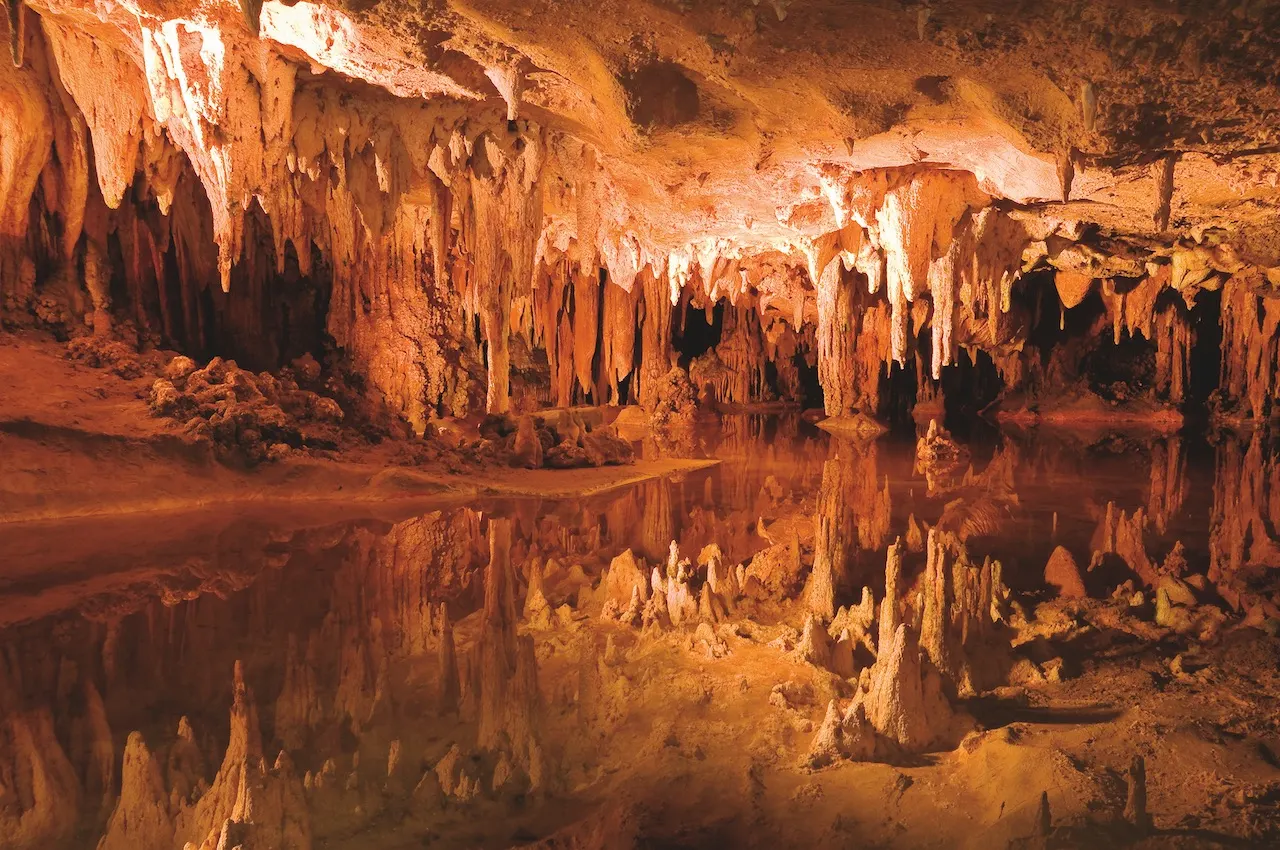
A stalagmite is the pointed formation that rises from the floor of a cave. Stalagmites are thin piles of mineral deposits that have fallen from the roof to the floor of a cave. They're sometimes connected to the stalactites that dangle down from the top. Because stalagmites form from drops of water combined with minerals, they get their name from the Greek stalagmos, "a dropping," .
Genetic Algorithm(ga)
The genetic algorithm is a method for solving both constrained and unconstrained optimization problems that is based on natural selection, the process that drives biological evolution. The genetic algorithm repeatedly modifies a population of individual solutions.
Mathematical Equation used:
To find Global maxima
`f=(f_1*f_2*f_3*f_4)`
To find Global minima
`f=-(f_1*f_2*f_3*f_4)`
where,
`f_1=[sin(5.1pix+0.5)]^6`
`f_2=[sin(5.1piy+0.5)]^6`
`f_3=exp[-4log(2)(x-0.667)^2/0.64]`
`f_3=exp[-4log(2)(y-0.667)^2/0.64]`
here. x and y are two variables
PROCEDURES :
1.Program to plot Global Maxima
- Defining Search Space:-
To find the Global Maxima, we have to first define the space where it has to be searched.
%defining the search space
x = linspace(0,0.6,150);
y = linspace(0,0.6,150);- Create a 2D mesh:-
To plot this value of x and y, we have to create a 2d array by meshgrid.
%Creating a 2D mesh
[xx, yy] = meshgrid(x,y);- Create a function
we have to create a function in another program and save it in same directory, to call it in main Program.
function [f]=stalagmite(input_vector)

x=input_vector(1);
y=input_vector(2);
f1=(sin(5.1*pi*x+0.5))^6;
f2=(sin(5.1*pi*y+0.5))^6;
f3=exp(-4*log(2)*(x-0.667)^2/0.64);
f4=exp(-4*log(2)*(y-0.667)^2/0.64);

f=(f1*f2*f3*f4);
end- Evaluation of the Function:-
We have created the function in another program, Now we have to use in a for loop inside another for loop to search the Maxima.
%Evaluating the stalgamite function
for i = 1:length(xx)
    for j = 1:length(yy)
        input_vector(1) = xx(i,j);
        input_vector(2) = yy(i,j);
        f(i,j) = stalagmite(input_vector);
    end
end- Plot the surface for Maxima with "ga" function:-
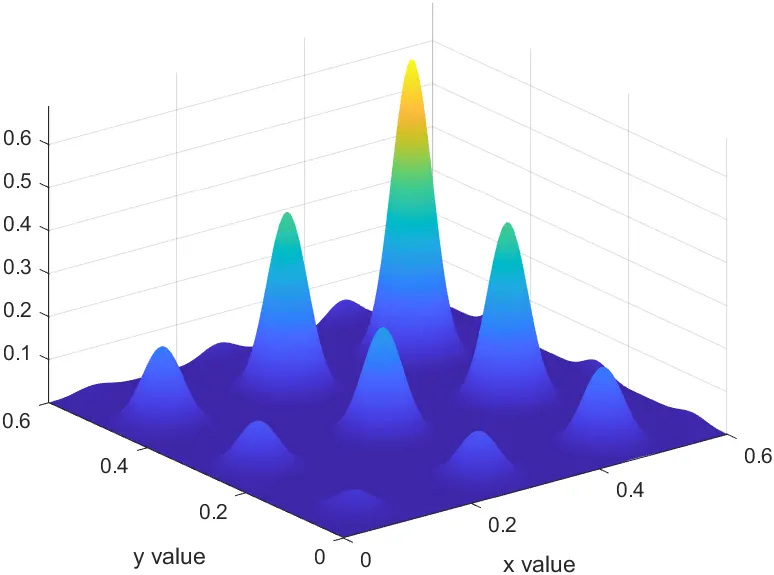
surfc(xx,yy,f)
xlabel('x value')
ylabel('y value')
shading interp
[inputs, fval] = ga(@stalagmite,2)- Full Program
clear all
close all
clc

%defining the search space
x = linspace(0,0.6,150);
y = linspace(0,0.6,150);

%Creating a 2D mesh
[xx, yy] = meshgrid(x,y);

%Evaluating the stalgamite function
for i = 1:length(xx)
    for j = 1:length(yy)
        input_vector(1) = xx(i,j);
        input_vector(2) = yy(i,j);
        f(i,j) = stalagmite(input_vector);
    end
end

surfc(xx,yy,f)
xlabel('x value')
ylabel('y value')
shading interp
[inputs, fval] = ga(@stalagmite,2)- Defining Search space:-
%defining the search space
x = linspace(0,0.6,150);
y = linspace(0,0.6,150);- Create a 2D mesh:-
To plot this value of x and y, we have to create a 2d array by meshgrid.
%Creating a 2D mesh
[xx, yy] = meshgrid(x,y);- Create a function
we have to create a function in another program and save it in same directory, to call it in main Program.
%Functions
function [f]=stalagmite(input_vector)
x=input_vector(1);
y=input_vector(2);
f1=(sin(5.1*pi.*x+0.5)).^6;
f2=(sin(5.1*pi.*y+0.5)).^6;
f3=exp(-4*log(2).*(x-0.667).^2/0.64);
f4=exp(-4*log(2).*(y-0.667).^2/0.64);

f=-(f1.*f2.*f3.*f4);
end- Evaluation of the Function:-
We have created the function in another program, Now we have to use in a for loop inside another for loop to search the Minima.
num_cases=50;
for i=1:length(xx)
    for j = 1:length(yy)
        input_vector(1)=xx(i,j);
        input_vector(2)=yy(i,j);
        f(i,j)=stalagmite(input_vector);
    end
end
After this Evaluation, we have to study 3 'Ga's, in order to find out the minima.
- Evaluation of Statistical Behaviour of ga through STUDY-1:-
tic
%study 1 - Statistical behaviour
for i=1:num_cases
    [inputs,fopt(i)]=ga(@stalagmite,2);
    xopt(i)=inputs(1);
    yopt(i)=inputs(2);
end

study1_time=toc
Here, we are using a function to count time ,i.e., tic and toc.
- Plot Study-1 Ga
%plotting1
figure(1)
subplot(2,1,1)
hold on
surfc(x,y,-f)
shading interp
plot3(xopt,yopt,-fopt,'marker','o','markersize',5,'markerfacecolor','g')
title('Unbounded inputs')
subplot(2,1,2)
plot(fopt)
xlabel('Iterations')
ylabel('Function minimum')
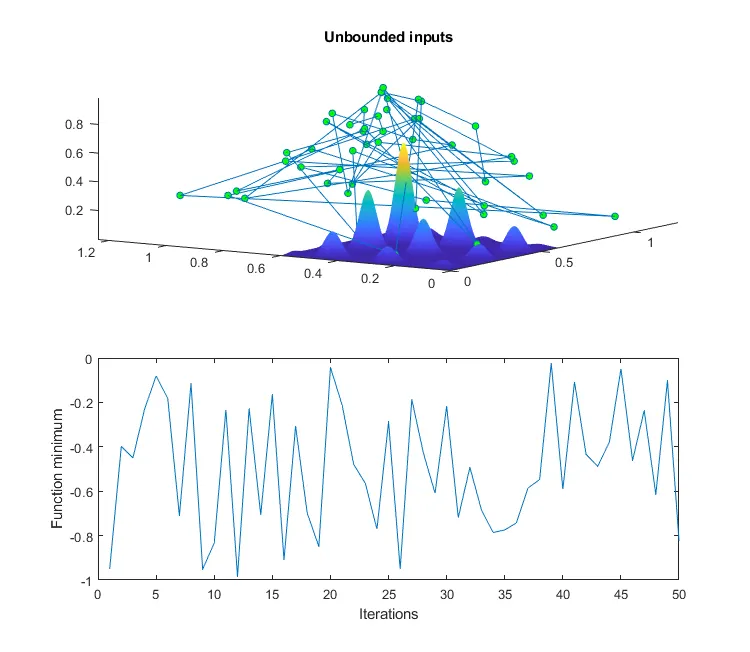
Here, we can see, the inputs are not bounded, due to which the plots are not specific to the Minima. So to improve the search, we will do Study-2.
- Evaluation of Statistical Behaviour of ga through STUDY-2:-
tic
%study2= Statistical Behaviour

for i=1:num_cases
    [inputs,fopt(i)]=ga(@stalagmite,2,[],[],[],[],[0,0],[0.6,0.6]);
    xopt(i)=inputs(1);
    yopt(i)=inputs(2);
end

study2_time=toc- Plot Study-2 Ga
%plotting2
figure(2)
subplot(2,1,1)
hold on
surfc(x,y,-f)
shading interp
plot3(xopt,yopt,-fopt,'marker','o','markersize',3,'markerfacecolor','g')
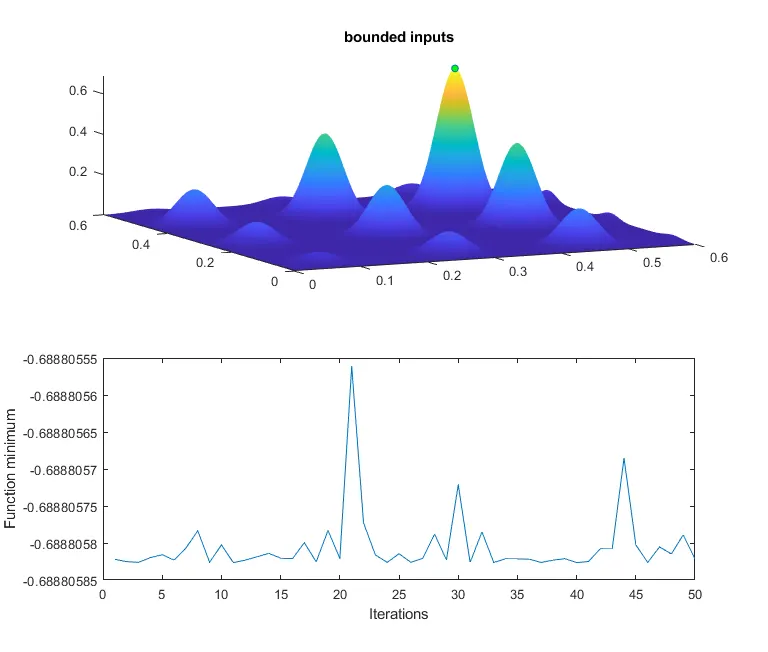
title('bounded inputs')
subplot(2,1,2)
plot(fopt)
xlabel('Iterations')
ylabel('Function minimum')
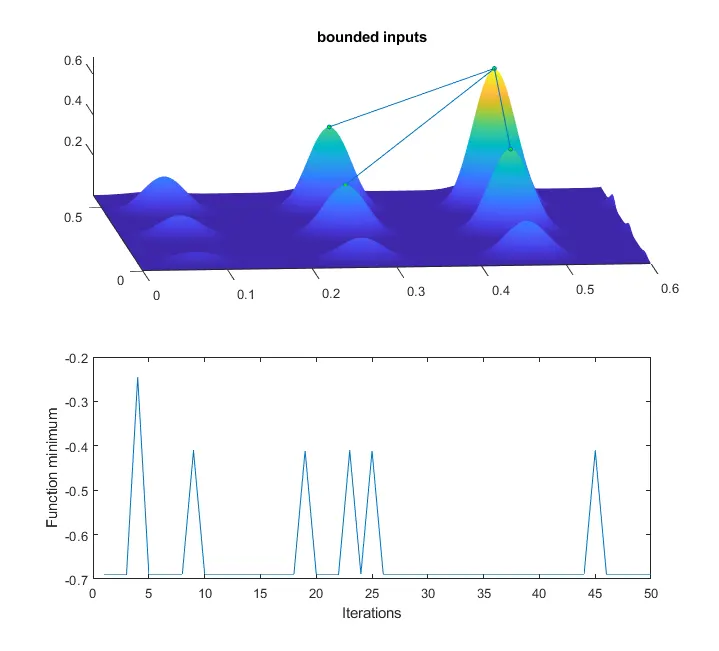
Here, is also observed that, the search points were bounded but, still we are unable to find the only one minima point.
- Increase Ga Iterations:-
To find the exact Minima, we have to increase the iterations for Ga.
%increasing ga iteration
options=optimoptions('ga')
options=optimoptions(options,'populationsize',170)- Evaluation of behaviour of Study-3
By using the increased Ga iteration, we will study 3rd case to Find the Minima.
tic

for i=1:num_cases
    [inputs,fopt(i)]=ga(@stalagmite,2,[],[],[],[],[0,0],[0.6,0.6],[],[],options)
    xopt(i)=inputs(1)
    yopt(i)=inputs(2)
end

study3_time=toc
- Plot Study-3 Ga
%plotting2
figure(3)
subplot(2,1,1)
hold on
surfc(x,y,-f)
shading interp
plot3(xopt,yopt,-fopt,'marker','o','markersize',5,'markerfacecolor','g')
title('bounded inputs')
subplot(2,1,2)
plot(fopt)
xlabel('Iterations')
ylabel('Function minimum')- Full Program
%finding global minima and minimum of the function

clear all
close all
clc

%defining the search space
x = linspace(0,0.6,150);
y = linspace(0,0.6,150);

%Creating a 2D mesh
[xx, yy] = meshgrid(x,y);

num_cases=50;
for i=1:length(xx)
    for j = 1:length(yy)
        input_vector(1)=xx(i,j);
        input_vector(2)=yy(i,j);
        f(i,j)=stalagmite(input_vector);
    end
end

tic
%study 1 - Statistical behaviour
for i=1:num_cases
    [inputs,fopt(i)]=ga(@stalagmite,2);
    xopt(i)=inputs(1);
    yopt(i)=inputs(2);
end

study1_time=toc

%plotting1
figure(1)
subplot(2,1,1)
hold on
surfc(x,y,-f)
shading interp
plot3(xopt,yopt,-fopt,'marker','o','markersize',5,'markerfacecolor','g')
title('Unbounded inputs')
subplot(2,1,2)
plot(fopt)
xlabel('Iterations')
ylabel('Function minimum')

tic
%study2= Statistical Behaviour

for i=1:num_cases
    [inputs,fopt(i)]=ga(@stalagmite,2,[],[],[],[],[0,0],[0.6,0.6]);
    xopt(i)=inputs(1);
    yopt(i)=inputs(2);
end

study2_time=toc

%plotting2
figure(2)
subplot(2,1,1)
hold on
surfc(x,y,-f)
shading interp
plot3(xopt,yopt,-fopt,'marker','o','markersize',3,'markerfacecolor','g')
title('bounded inputs')
subplot(2,1,2)
plot(fopt)
xlabel('Iterations')
ylabel('Function minimum')


%study3 behviour
%increasing ga iteration
options=optimoptions('ga')
options=optimoptions(options,'populationsize',170)

tic

for i=1:num_cases
    [inputs,fopt(i)]=ga(@stalagmite,2,[],[],[],[],[0,0],[0.6,0.6],[],[],options)
    xopt(i)=inputs(1)
    yopt(i)=inputs(2)
end

study3_time=toc

%plotting2
figure(3)
subplot(2,1,1)
hold on
surfc(x,y,-f)
shading interp
plot3(xopt,yopt,-fopt,'marker','o','markersize',5,'markerfacecolor','g')
title('bounded inputs')
subplot(2,1,2)
plot(fopt)
xlabel('Iterations')
ylabel('Function minimum')
OUTPUT :
Plot of Global maxima
Plot of Global Minima by 'Ga'- STUDY-1:
Plot of Global Minima by 'Ga'- STUDY-2:
Plot of Global Minima by 'Ga'- STUDY-3 (After increasing Iterations):
ERRORS :
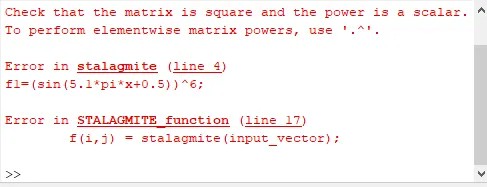
- The above error is thrown because input_vector has not been assigned.
- After assigning the input_vector, the error is closed and output is printed.
CONCLUSION :
- The program has been performed successfully.
- we successfully plotted the Global Maxima.
- We successfully plotted the Global Minima.
- The Genetic Algorithm is successfully, written, run and plotted as output attached.