Project 1 - Parsing NASA thermodynamic data
AIM :
To write a code in MATLAB to parse nasa thermo dynamic data file and then calculate thermodynamic properties of various gas species.
OBJECIVE :
- To write a function that extracts the 14 co-efficients and calculates the enthalpy, entropy and specific heats for all the species in the data file
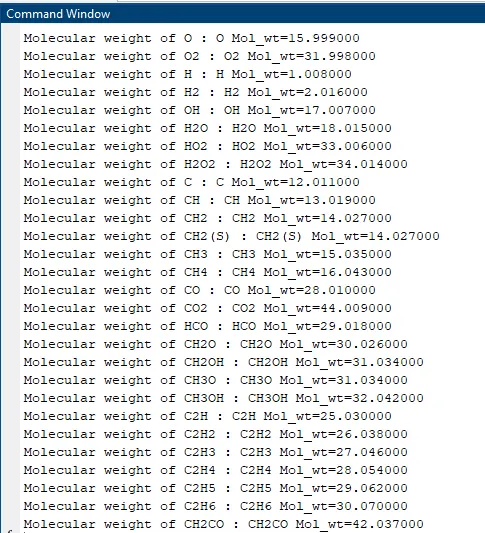
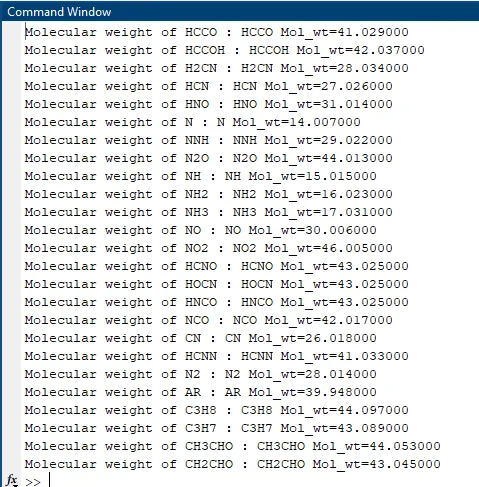
- To calculate the molecular weight of each species and display it in the command window.
- To plot the Cp, Enthalpy and Entropy for the local temperature range (low temperature : high temperature) specific for each species.
THEORY :
File Parsing
It is a process of converting formatted text into a data structure. A data structure type can be any suitable representation of the information engraved in the source text.
Equations Used
For Specific heats
`(cp)/R=a1+a2*T+a3*T^2+a4*T^3+a5*T^4`
For Enthalpy
`H/(RT)=a1+a2*T/2+a3*T^2/3+a4*T^3/4+a5*T^4/5+(a6)/T`
For Entropy
`S/R=a1*lnT+a2*T+a3*T^2/2+a4*T^3/3+a5*T^4/4+a7`
where,
`T` = Local Temperature
`a1 - a7` = High temperaure coefficient
`a8 - a14` = Low temperaure coefficient
`R` = Gas Constant = 8.314
The first 7 coefficients are high-temperature coefficients and the second 7 coefficients are low-temperature coefficients.
INTRODUCTION :
NASA came up with polynomials that can be used to evaluate thermodynamic properties such as Cp, H and S. They have also documented the co-efficients that are required to evaluate these polynomials for 1000+ species.
Here, we have been provided with the thermoynamic data file from NASA, named as THERMO.dat.
THERMO.dat file is a data file containing 14 coefficients for 53 different elements given by NASA.
PROCEDURES:
As our objective is to get Specific heats, Enthalpy, Entropy, and Molecular weight from the data file, we have to extract different data from the data file and calculate by writing code in MATLAB.
As we know, we have to calculate multiple entities, for which writing code in one program may complicate the Program. So to simplify rthe Program we have to write individual function for different entities which will be called in main programming for the calculation part.
1. Defining Functions
First we have to write code for Specific heats, Enthalpy, Entropy, and Molecular weight as individual functions which will be called in-between main program.
- Function - Specific heats
`(cp)/R=a1+a2*T+a3*T^2+a4*T^3+a5*T^4`
function[C_p] = specific_heat_calc(a1,a2,a3,a4,a5,a6,a7,a8,a9,a10,a11,a12,a13,a14,local_low_temp,local_mid_temp,local_high_temp,T,R)
if(T>local_mid_temp)
    C_p=R*((a1 + (a2*T)+(a3* (T.^2))+(a4* (T.^3))+(a5*(T.^4))));

else

C_p=R*((a8+(a9*T)+(a10*(T.^2))+ (a11*(T.^3))+(a12* (T.^4))));

end- Function - Enthalpy
`H/(RT)=a1+a2*T/2+a3*T^2/3+a4*T^3/4+a5*T^4/5+(a6)/T`
function [h]=enthalpy_calc(a1,a2,a3,a4,a5,a6,a7,a8,a9,a10,a11,a12,a13,a14,local_low_temp,local_mid_temp,local_high_temp,T,R)

if (T>local_mid_temp)


    h=R*((a1*T+(a2* (T.^2)/2)+(a3* (T.^3)/3)+(a4* (T.^4)/4)+(a5*(T.^5)/5)+a6));

else
    h=R*((a8*T+(a9* (T.^2)/2) + (a10*(T.^3)/3) + (a11*(T.^4)/4) + (a12* (T.^5)/5)+a13));
end- Function - Entropy
`S/R=a1*lnT+a2*T+a3*T^2/2+a4*T^3/3+a5*T^4/4+a7`
function [s] = entropy_calc(a1,a2,a3,a4,a5,a6,a7,a8,a9,a10,a11,a12,a13,a14,local_low_temp,local_mid_temp,local_high_temp,T,R)
if (T>local_mid_temp)

s=R*((a1* log(T) + (a2*T)+(a3*(T.^2)/2)+(a4*(T.^3)/3)+(a5*(T.^4)/4)+a7));

else

s=R*((a8* log(T) + (a9*T)+(a10*(T.^2)/2) + (a11*(T.^3)/3)+ (a12*(T.^4)/4)+a14));

end- Function - Molecular Weight
function [M] = molecular_weight(species_name)
Elements=['O', 'H', 'C', 'N', 'A'];
fprintf('Molecular weight of ');
fprintf(species_name);
fprintf(' : ');
Atomic_mass=[15.999,1.008,12.011,14.007,39.948];
Mol_wt=0;
for i=1:length(species_name)
    for j=1:length(Elements)
        if strcmp(species_name(i), Elements(j))
            Mol_wt = Mol_wt+Atomic_mass(j);
            z=j;
        end
    end
    var=str2double(species_name(i));
    if (var>1)
        Mol_wt = Mol_wt+(Atomic_mass(z)*(var-1));
    end
end
M=Mol_wt;
end
2. Reading the Data file
After defining functions, we have to write code for main Programming.
- First of all, we have to access the file named THERMO.dat by using 'fopen' and read the file by using 'r'
- Here, we have used a variable 'f1', for the file.
%reading Data file provided
f1= fopen('THERMO.dat', 'r');
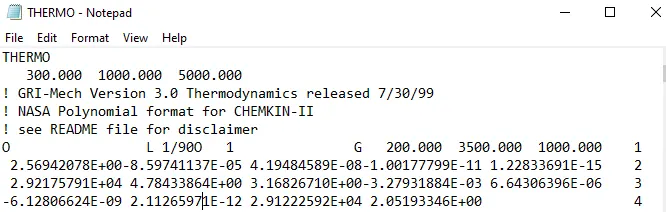
Screenshot of Data file provided
- Then, to read the lines inside the data file, we have to use 'fgetl'
Header1=fgetl(f1);3. Getting Global Temperatures
- As it can be seen in screenshot attached, the first header line 'THERMO' is of no use for our objective, we have to skip this line
- But the second line is having useful data for Global Temperatures.
- To read the second line, we will use the same (fgetl(f1)), which means whenever we use 'fgetl', It will read the line sequentially. To distinguish between lines we can use different variables, such as follows:-
%second line is having global temperatures
%Get Global temperature
Global_Temperatures=fgetl(f1);- The line read from the data file is in String now, which cannot be used for calculations.
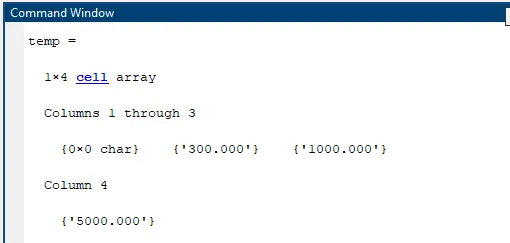
- To get the values as integer, first of all we have to split the whole string of line to individual strings by using 'strsplit' and storing it to a variable 'temp'.
%Splitting the strings
temp=strsplit(Global_Temperatures,' ');
screenshot of command window showing values of 'temp'
- Then convert the individual strings into integers by using 'str2double'.
- str2double converts strings to double precision values.
- And as we can see from the atached screenshot command window, first character is blank, and following second, third and fourth characters are low, mid, and high values for temp, respectively.
%Converting String cells into Double Precision values
global_low_temp=str2double(temp{2});
global_mid_temp=str2double(temp{3});
global_high_temp=str2double(temp{4});
- Then, once again we have to skip few unimportant lines, as per the screenshot of THERMO.dat file attached.
- Here 3 lines are unimportant. To skip these 3 lines, we have to use a 'for-loop'
%skip next threee lines
for i=1:3
    skippedlines=fgetl(f1);
end
4. Use For Loop to calculate data for all species
- Now, once again we have to check the screenshot of data file, and we can see the next lines are given different data set of different species.
- Each species consist of 4 lines.
- 1st line is having species name, then local temperatures for specific species.
- first 7 coefficients are high-temperature coefficients and the second 7 coefficients are low-temperature coefficients.
-
This same set of 4lines are to be read for 53 species, So we are using a 'for-loop'
-
for i=1:53
Header_line=fgetl(f1);                            %Read header line
S=strsplit(Header_line,' ');                      %Split the strings in header line
species_name= S{1};                               %Assign 1st String as Species name

%Get Local Temperature
A=strfind(Header_line, 'G');                      %Find 'G' in Strings of Header line
temp_values=Header_line(A+4:length(Header_line)); %values of local temperature after 'G' as Strings
B=strsplit(temp_values,' ');                      %Split the Strings of Local Temperature

%Convert Strings into double precision values
local_low_temp=str2double(B{1});                  %Local Low Temperature
local_mid_temp=str2double(B{3});                  %Local mid Temperature
local_high_temp=str2double(B{2});                 %Local High Temperature

%Get lines below Header line for Temperature Coefficients
%Get first line
line1=fgetl(f1);
f=strfind(line1, 'E');
a1=str2double(line1(1:(f(1)+3)));                 %1st Coefficient
a2=str2double(line1(f(1)+4:(f(2)+3)));            %2nd Coefficient
a3=str2double(line1(f(2)+4:(f(3)+3)));            %3rd Coefficient
a4=str2double(line1(f(3)+4:(f(4)+3)));            %4th Coefficient
a5=str2double(line1(f(4)+4:(f(5)+3)));            %5th Coefficient

%Get Second line
line2=fgetl(f1);
a6 = str2double(line2(1:(f(1)+3)));               %6th Coefficient
a7 = str2double(line2(f(1)+4:(f(2)+3)));          %7th Coefficient
a8 = str2double(line2(f(2)+4:(f(3)+3)));          %8th Coefficient
a9 = str2double(line2(f(3)+4:(f(4)+3)));          %9th Coefficient
a10 = str2double(line2(f(4)+4:(f(5)+3)));         %10th Coefficient

%Get Third line
line3=fgetl(f1);
a11 = str2double(line3(1:(f(1)+3)));              %11th Coefficient
a12 = str2double(line3(f(1)+4:(f(2)+3)));         %12th Coefficient
a13 = str2double(line3(f(2)+4:(f(3)+3)));         %13th Coefficient
a14 = str2double(line3(f(3)+4:(f(4)+3)));         %14th Coefficient
5. Define gas constant and range of Temperature
- In this for loop, after getting 14 coefficients, we have to define values for R (gas constant) and T (temperature range), which will be used to calculate Specific heats, Enthalpy, and Entropy.
% gas constant
R=8.314;

%defining Range of Temperature
T=linspace(local_low_temp,local_high_temp,100);
6. Calculate Specific heats, Enthalpy, and Entropy by calling function
- Now, we can call the individual functions of Specific heats, Enthalpy, and Entropy to be calculated.
%Calling function for Specific heat(C_p)
C_p=specific_heat_calc(a1,a2,a3,a4,a5,a6,a7,a8,a9,a10,a11,a12,a13,a14,local_low_temp,local_mid_temp,local_high_temp,T,R);

%Calling function for Entropy (s)
s=entropy_calc(a1,a2,a3,a4,a5,a6,a7,a8,a9,a10,a11,a12,a13,a14,local_low_temp,local_mid_temp,local_high_temp,T,R);

%Calling function for Enthalpy (h)
h=enthalpy_calc(a1,a2,a3,a4,a5,a6,a7,a8,a9,a10,a11,a12,a13,a14,local_low_temp,local_mid_temp,local_high_temp,T,R);
7. Make Directory
- Now, as per one of our objectives, we have to show the directory for each species, So we have to code it inside the loop to make folder for each species auomatically, by using 'mkdir'
mkdir (species_name);                             %make folder inside the current directory
cd(species_name) %change directory- Here 'cd' is used to change the directory for each species.
8. Plot the variation and Save the plots in directory
- Now, we have to plot different variations between Specific heats, Enthalpy, and Entropy for each species, so we have to code inside the loop.
%Plot specific heat vs temperature
figure(1)
plot(T,C_p)
title(sprintf('specific heat vs temperature of %s',species_name))
xlabel('temperature [K]')
ylabel('specific heat [KJ]')
image=getframe(gcf);
imwrite(image.cdata, 'cp vs T.png')
saveas(figure(1), 'specific_heat','jpg')

%Plot Enthalpy vs Temperature
figure(2)
plot (T,h)
title(sprintf('Enthalpy vs Temperature of %s',species_name))
xlabel('Temperature [K]')
ylabel('Enthalpy [kJ/mol]')
image=getframe(gcf);
imwrite(image.cdata,'h vs T.png')
saveas(figure (2), 'Enthalpy', 'jpg')

%plot Entropy vs Temperature
figure(3)
plot(T,s)
title(sprintf('Entropy vs Temperature of %s',species_name))
xlabel('Temperature [K]')
ylabel('Entropy [kJ/mol-K]')
image=getframe(gcf);
imwrite(image.cdata,'s vs T.png')
saveas(3,'entropy', 'jpg')

cd ..
- We have to save these plots of variations for each species, so 'imwrite' and 'saveas', is used.
- After saving we have to get out of the folder, so 'cd..' is used.
9. Calculate Molecular Weight
- As per our last objective we have to calculate molecular weight of every species. So it is also used imside the loop.
- And to display rthe values of molecular weight, we are using, 'disp'
%Calculating molecular mass
[M]=molecular_weight(species_name);
K = sprintf('%s Mol_wt=%f', species_name,M);
disp(K)
end- As all the objectives were completed for each species inside loop, So we have closed the loop by using 'end'.
FULL PROGRAM :
% Nasa thermodynamic file parsing
close all
clear all
clc


%reading Data file provided
f1= fopen('THERMO.dat', 'r');

%Skip first line
Header1=fgetl(f1);

%second line is having global temperatures
%Get Global temperature
Global_Temperatures=fgetl(f1);

%Splitting the strings
temp=strsplit(Global_Temperatures,' ');

%Converting String cells into Double Precision values
global_low_temp=str2double(temp{2});
global_mid_temp=str2double(temp{3});
global_high_temp=str2double(temp{4});

%skip next threee lines
for i=1:3
    skippedlines=fgetl(f1);
end

%Get Temperature Coefficients for all 53 elements
for i=1:53
Header_line=fgetl(f1);                            %Read header line
S=strsplit(Header_line,' ');                      %Split the strings in header line
species_name= S{1};                               %Assign 1st String as Species name

%Get Local Temperature
A=strfind(Header_line, 'G');                      %Find 'G' in Strings of Header line
temp_values=Header_line(A+4:length(Header_line)); %values of local temperature after 'G' as Strings
B=strsplit(temp_values,' ');                      %Split the Strings of Local Temperature

%Convert Strings into double precision values
local_low_temp=str2double(B{1});                  %Local Low Temperature
local_mid_temp=str2double(B{3});                  %Local mid Temperature
local_high_temp=str2double(B{2});                 %Local High Temperature

%Get lines below Header line for Temperature Coefficients
%Get first line
line1=fgetl(f1);
f=strfind(line1, 'E');
a1=str2double(line1(1:(f(1)+3)));                 %1st Coefficient
a2=str2double(line1(f(1)+4:(f(2)+3)));            %2nd Coefficient
a3=str2double(line1(f(2)+4:(f(3)+3)));            %3rd Coefficient
a4=str2double(line1(f(3)+4:(f(4)+3)));            %4th Coefficient
a5=str2double(line1(f(4)+4:(f(5)+3)));            %5th Coefficient

%Get Second line
line2=fgetl(f1);
a6 = str2double(line2(1:(f(1)+3)));               %6th Coefficient
a7 = str2double(line2(f(1)+4:(f(2)+3)));          %7th Coefficient
a8 = str2double(line2(f(2)+4:(f(3)+3)));          %8th Coefficient
a9 = str2double(line2(f(3)+4:(f(4)+3)));          %9th Coefficient
a10 = str2double(line2(f(4)+4:(f(5)+3)));         %10th Coefficient

%Get Third line
line3=fgetl(f1);
a11 = str2double(line3(1:(f(1)+3)));              %11th Coefficient
a12 = str2double(line3(f(1)+4:(f(2)+3)));         %12th Coefficient
a13 = str2double(line3(f(2)+4:(f(3)+3)));         %13th Coefficient
a14 = str2double(line3(f(3)+4:(f(4)+3)));         %14th Coefficient

% gas constant
R=8.314;

%defining Range of Temperature
T=linspace(local_low_temp,local_high_temp,100);

%Calling function for Specific heat(C_p)
C_p=specific_heat_calc(a1,a2,a3,a4,a5,a6,a7,a8,a9,a10,a11,a12,a13,a14,local_low_temp,local_mid_temp,local_high_temp,T,R);

%Calling function for Entropy (s)
s=entropy_calc(a1,a2,a3,a4,a5,a6,a7,a8,a9,a10,a11,a12,a13,a14,local_low_temp,local_mid_temp,local_high_temp,T,R);

%Calling function for Enthalpy (h)
h=enthalpy_calc(a1,a2,a3,a4,a5,a6,a7,a8,a9,a10,a11,a12,a13,a14,local_low_temp,local_mid_temp,local_high_temp,T,R);

mkdir (species_name);                             %make folder inside the current directory
cd(species_name)                                  %change directory

%Plot specific heat vs temperature
figure(1)
plot(T,C_p)
title(sprintf('specific heat vs temperature of %s',species_name))
xlabel('temperature [K]')
ylabel('specific heat [KJ]')
image=getframe(gcf);
imwrite(image.cdata, 'cp vs T.png')
saveas(figure(1), 'specific_heat','jpg')

%Plot Enthalpy vs Temperature
figure(2)
plot (T,h)
title(sprintf('Enthalpy vs Temperature of %s',species_name))
xlabel('Temperature [K]')
ylabel('Enthalpy [kJ/mol]')
image=getframe(gcf);
imwrite(image.cdata,'h vs T.png')
saveas(figure (2), 'Enthalpy', 'jpg')

%plot Entropy vs Temperature
figure(3)
plot(T,s)
title(sprintf('Entropy vs Temperature of %s',species_name))
xlabel('Temperature [K]')
ylabel('Entropy [kJ/mol-K]')
image=getframe(gcf);
imwrite(image.cdata,'s vs T.png')
saveas(3,'entropy', 'jpg')

cd ..


%Calculating molecular mass
[M]=molecular_weight(species_name);
K = sprintf('%s Mol_wt=%f', species_name,M);
disp(K)
end
RESULTS :
1. Screenshot of command window showing Molecular weight of all species
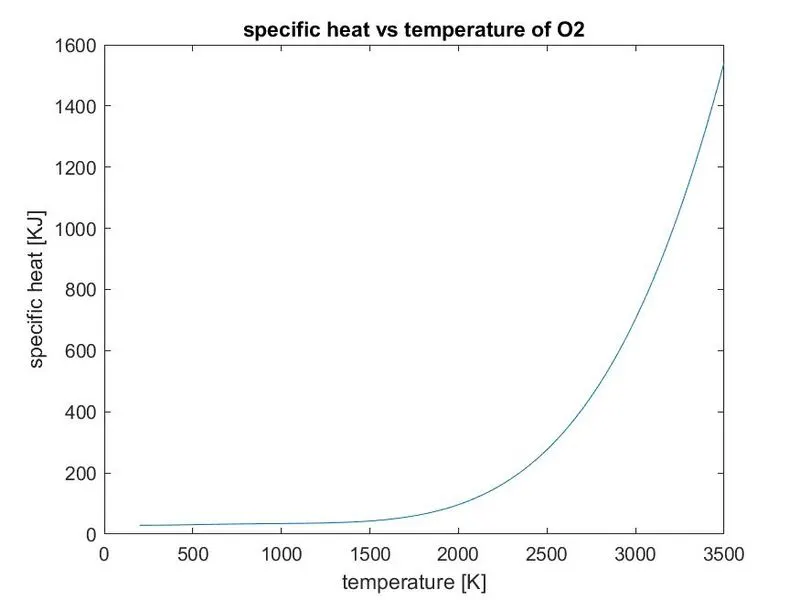
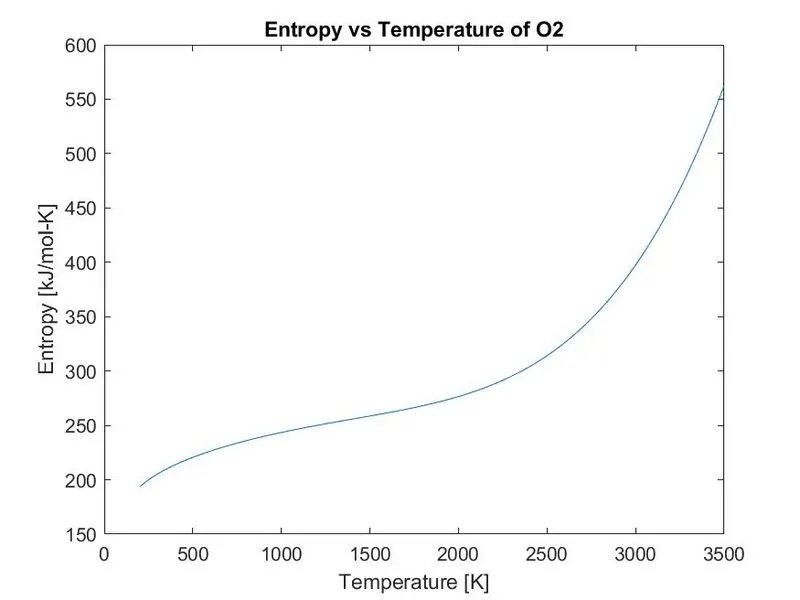
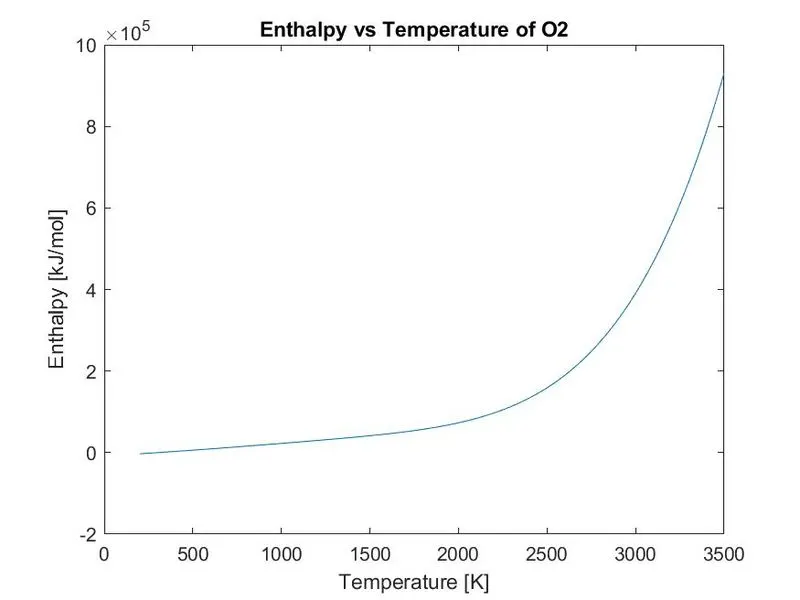
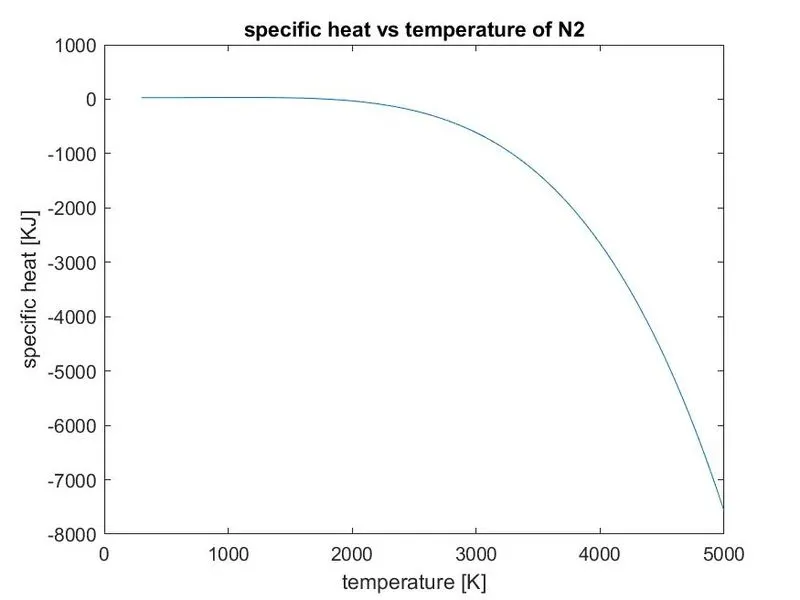
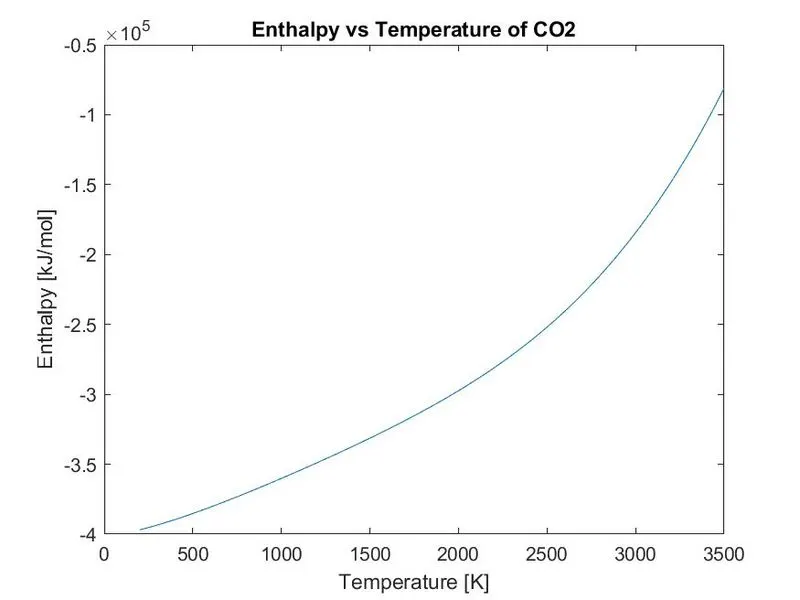
2. Plots of O2, N2 and Co2 Species
- Plots of O2
- Plots of N2
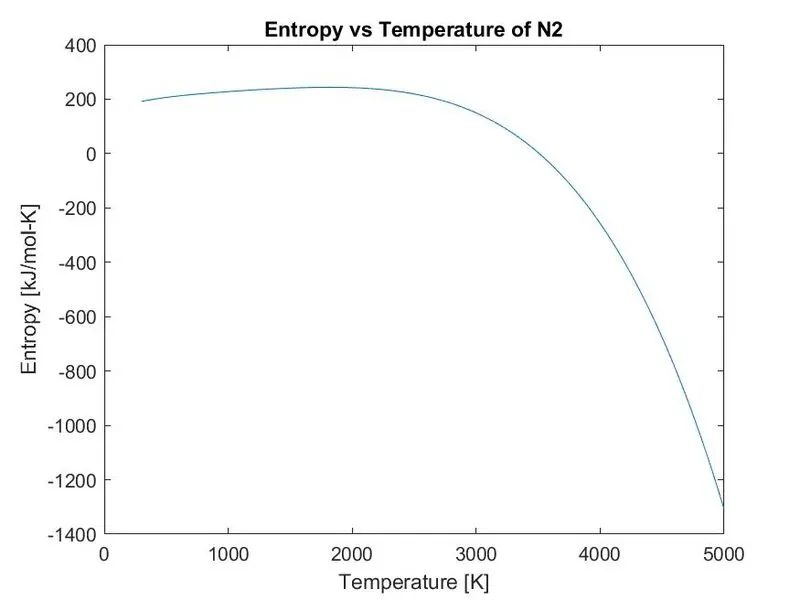
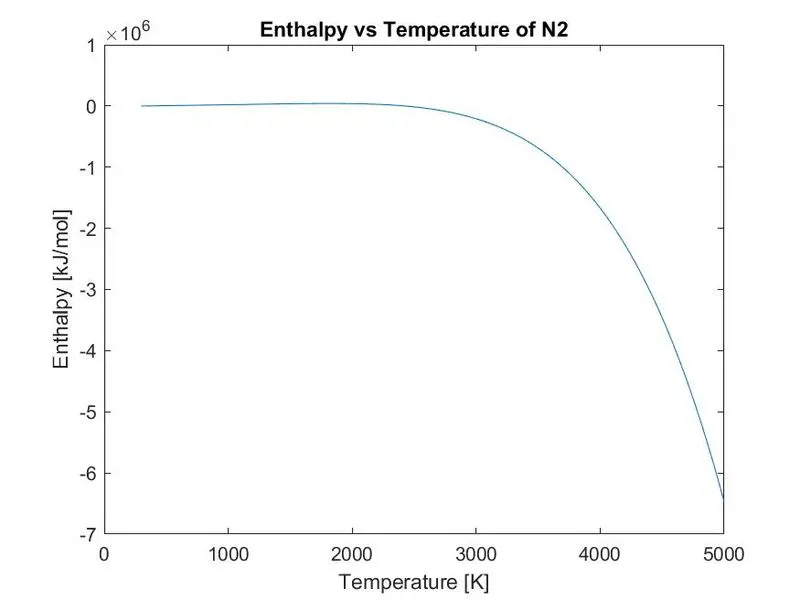
- Plots of C02
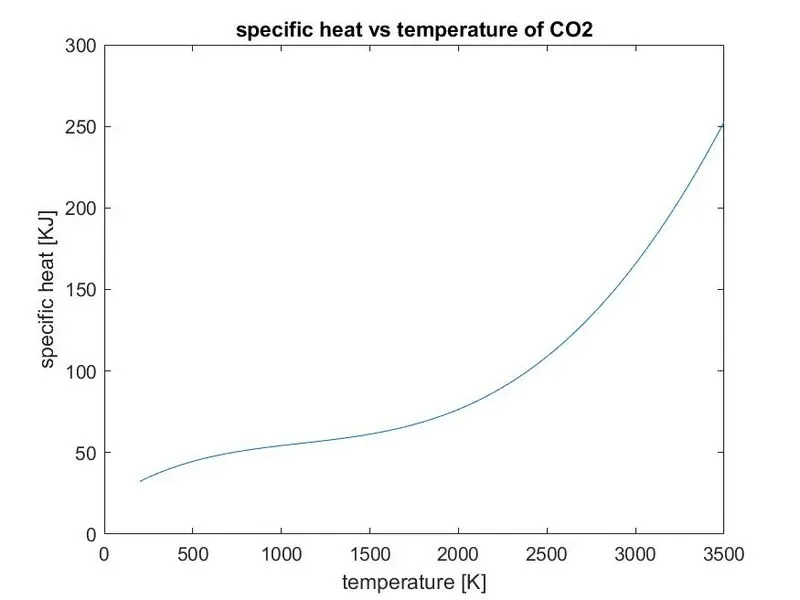
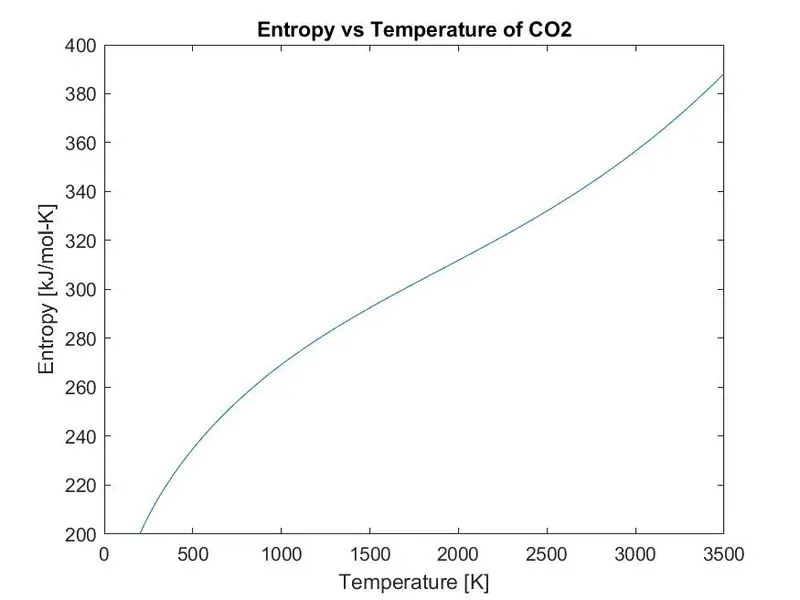
3. Screenshot of Directory having folder of species

ERROR :
- While running the main program, after all the correction this Error in command window is thrown.
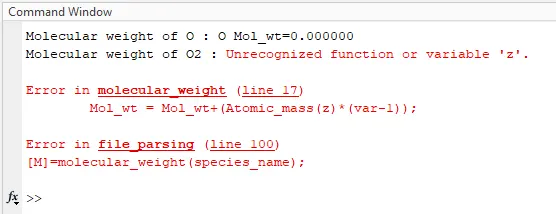
- Later on it was found out that, due to a small silly typo mistake i.e., '0'(number) instead of 'O'(alphabet) has been typed, due to which the variable 'Z' in molecular weight function has become unrecognisable, and hence Error in file parsing occured. Later it is successfully resolved.
CONCLUSION :
- Thermodynamic file has been successfully parsed by coding in MATLAB.
- Different errors resolved throughout the Programming
- New Coding functions and commands were learnt and executed.