Week 4.1 - Genetic Algorithm
Stalagmite Function
In computer science and operations research, a genetic algorithm (GA) is a metaheuristic inspired by the process of natural selection that belongs to the larger class of evolutionary algorithms (EA). Genetic algorithms are commonly used to generate high-quality solutions to optimization and search problems by relying on biologically inspired operators such as mutation, crossover and selection.
The genetic algorithm is a technique for solving both constrained and unconstrained optimization problems that are based on natural selection, the process that drives biological evolution. The genetic algorithm constantly modifies the population size of individual solutions.
Genetic Algoritham
Initialization of Population
The code generates its random population of defined size and from that population the code evaluates the fitness of the members of the population according to which it forms new population based on no. of iterations performed.
Fitness Function
It is that function which we have to optimize and its optimization is done with the help of number of generations which have been formed by the code accordance with the fitness value of each member generated, these fitness values are used for the reproduction of the children.
Selection
The idea of the selection phase is to select the fittest individuals and let them pass their genes to the next generation. The main goal of this phase is to find the region where the chances of getting the best solution are more.
Inspiration for this is from the survival of the fittest.
It should be a balance between exploration and exploitation of search space.
GA tries to move the genotype to higher fitness in the search space.
Too strong fitness selection bias can lead to sub-optimal solutions.
Too little fitness bias selection results in unfocused search.
Reproduction
Generation of offspring happen in 2 way:
Crossover
Mutation
Crossover
Crossover is the most significant stage in the genetic algorithm. During crossover, a random point is selected while mating a pair of parents to generate offspring.
There are 3 major types of crossover.
Single Point Crossover:
A point on both parents’ chromosomes is picked randomly, and designated a ‘crossover point’.
Two-Point Crossover: Two crossover points are picked randomly from the parent chromosomes.
Unifofm Crossover: In a uniform crossover, typically, each bit is chosen from either parent with equal probabilit
Mutation
In a few new offspring formed, some of their genes can be subjected to a mutation with a low random probability. This indicates that some of the bits in the bit chromosome can be flipped. Mutation happens to take care of diversity among the population and stop premature convergence.
(ga code) x = ga( fun , nvars , A , b , Aeq , beq , lb , ub ) where 'fun' is the function that is stalagmite.'nvar' is the number of variables.A and b are the inequality constraints where x function is subject to the linear inequalities A*x ≤ b.'Aeq' & 'beq' are x to fun, subject to the linear equalities Aeq*x = beq and A*x ≤ b/lb and ub are upper and lower bounds such that lb≤ x ≤ub.
(Starting with the code in MATLAB)
*) By using clear close all clc any past record of program or anything in workplace,editor or command window will be erased.I have provided randomn inputs with a range with 100 values for the search space on which the stalagmite will take in each of the mentioned values.Then these set of x and y values are then converted into a 2 dimension array for the search space.
clear
close all
clc

%stalagmite function
%inputs for search space
x=linspace(0,0.6,150)
y=linspace(0,0.6,150)

%Converting into 2D array
[xx,yy]=meshgrid(x,y)
The output in the command window-
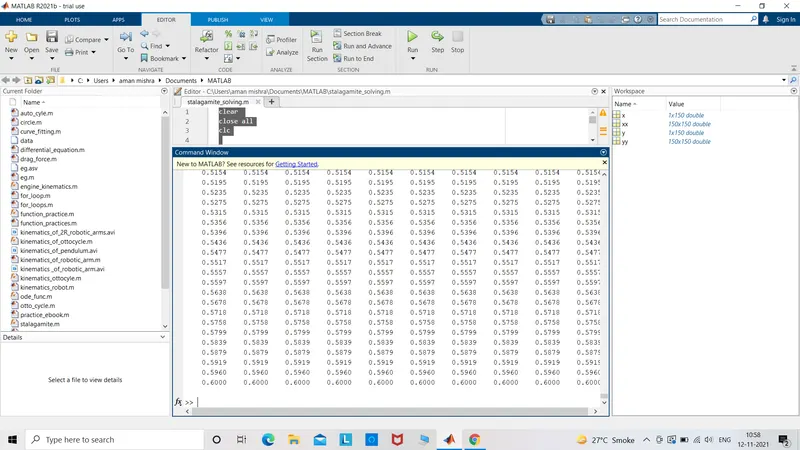
(TAB 2)
*) In the other tab,I typed the same given equations but in computer language which will be my inputs of the function.With outputs term1,term2,term3,term4 and equations were the inputs.There are 5 equations and are listed below.The calling the function by 'stalagmite(inputs) which will be the function and the input x to be worked on.The function file and the main program should be in the same folder only then (Matlab) it will sync this function code with the main tab program.The negative sign is used in 'f' equation because this will give me the maxima of the later used function 'ga'.
function [F]=stalagmite(inputs)
x=inputs(1)
y=inputs(2)

term1=sin(5.1*(pi*x)+0.5)^6
term2=sin(5.1*(pi*y)+0.5)^6
term3=exp((-4)*log(2)*((x-0.0667)^2)/0.64)
term4=exp((-4)*log(2)*((y-0.0667)^2)/0.64)
F =-(term1*term2*term3*term4)
end
TAB 1
*)back to tab 1,to plot the surface of the stalagmite,I used for loop with input length of 'xx' and 'yy' 2D arrays. By this,we I will get the best fitness function values at each point of the meshgrid.In the end,I copied the same function 'stalagmite(inputs)' that was called in tab 2 back on tab 1.
%solving the function
for i=1:length(xx)
    for j=1:length(yy)
        inputs(1)=x(i,j)
        inputs(2)=y(i,j)
F(i,j)=stalagmite(inputs)
    end
*)Now I try to plot the stalagmite by using 'surfc' to give me a surface plot. The negative sign in the function will give me an upside down graph and also the maxima value will be in postive.I have used shading interp which will remove all the grid lines on the surface plot.This is just a general plot without any condition.
(I got an error.)
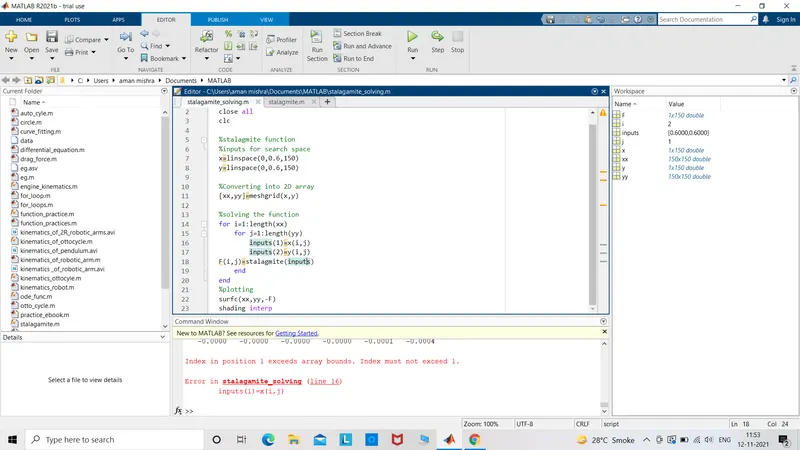
I realized that I had not given the 2D array inputs 'xx and yy' and mistakenly gave 1D x and y.
The stalagmite graph looks like this-
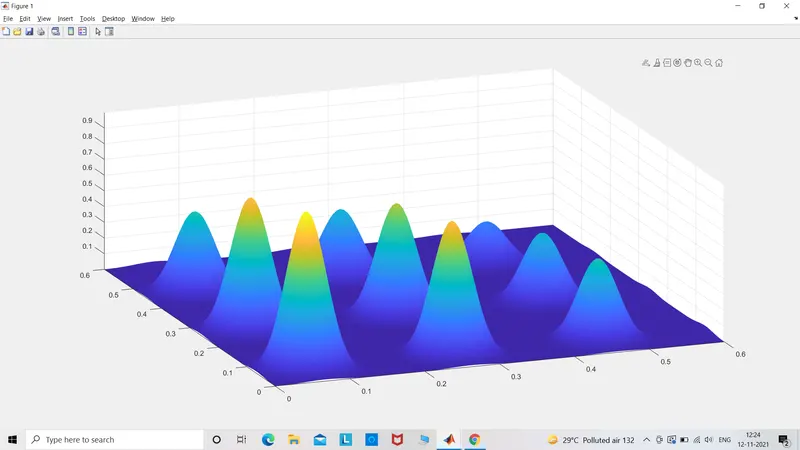
Now, to find the global maxima we need to use another 'for loop' which will give me a set of maximas by using the inbuilt function ga which will and then I will modify the equation to get lesser and and lesser value of maxima.
Case 1:statistical study without boundary
%stalagmite function
%inputs for search space
x=linspace(0,0.6,150)
y=linspace(0,0.6,150)
num_case=50
%Converting into 2D array
[xx,yy]=meshgrid(x,y)

%solving the function
for i=1:length(xx)
    for j=1:length(yy)
        inputs(1)=xx(i,j)
        inputs(2)=yy(i,j)
F(i,j)=stalagmite(inputs)
    end
end

tic
%Case1: Statistical study without boundary
for i=1:num_case
    xout(i)=inputs(1)
    yout(i)=inputs(2)
    [inputs,Fout]=ga(@stalagmite,2)
end
study_case1=toc

%plotting
figure(1)
subplot(2,1,1)
surfc(xx,yy,-F)
shading interp
hold on
plot3(xout,yout,-Fout,'marker','O','markersize',5,'markerfacecolor','g')
xlabel('x axis')
ylabel('y axis')
subplot(2,1,2)
plot(-Fout)
xlabel('iterations')
ylabel('function maximum')
title('my stalagmite')
grid on
*)I have used num_case =50 which will run the ga program 50 times.
*)Later,the optimum values of fitness function at each iteration and calculating and then I have used these with the already given syntax.This will give me values of x and y for stalagmite function to be minimum.
*)I have used tic and toc command which will start the stopwatch timer and then will display the time taken to optimize the function and will be shown in the command window after the program gives the output.
*)I have used the ga with respect to stalagmite function and 2 is for the number of variables which are x and y.I have stored the values in xout,yout,Fout which will give me the optimum value of function stalagmite that will be predicted.
*)To plot the overall graph I have used figure (1) in which the original surfc command to plot the surface of stalagmite and also subplot which will include the other plots in the same figure window.
-)surfc(xx,yy,-F) will create the first plot stalagmite function.
-)'plot3(xout,yout,-Fout,'marker','O','markersize',5,'markerfacecolor','g')' will plot x, y, z over those 50 ran studies.To make it understand more clearly,I create a second subplot 'subplot(2,1,2)' which is shown in the photo below.Here I have given plot(-fout) which will give me optimum value of the function for each iteration.
-)I have labeled them by using 'xlabel' and 'ylabel' with a 'title' command to display the title of the plot.
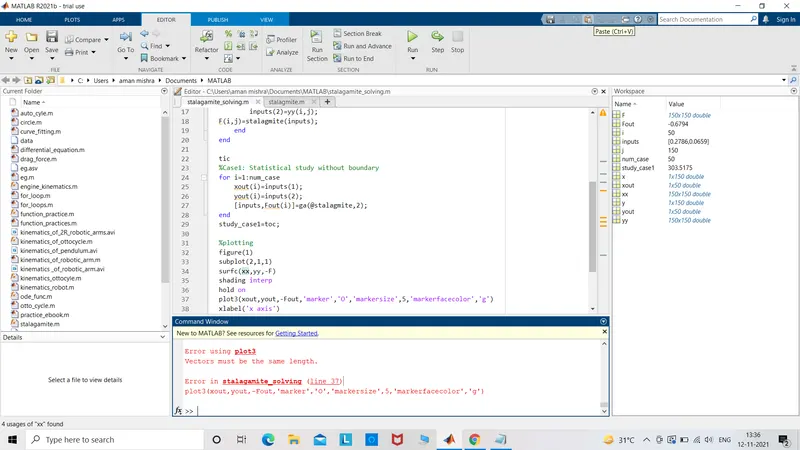
I didn't realize what the mistake was and so I just removed the negative sign once and ran teh program and then again inserted the negative sign which ultimately gave the output desired graph
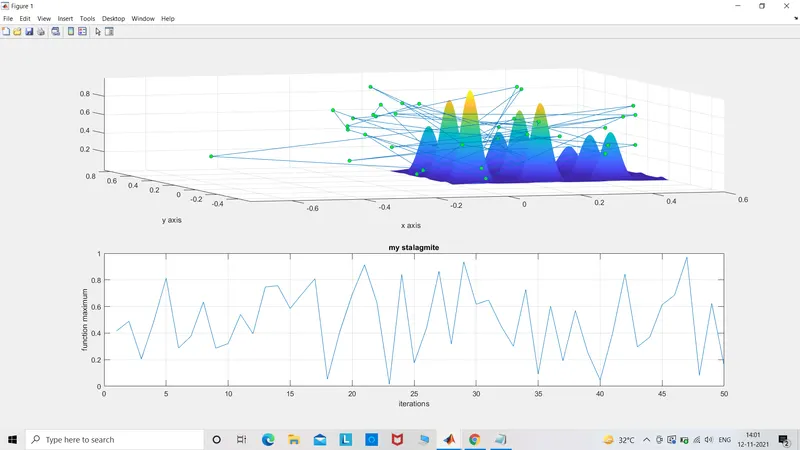
The plot shown above is not much accurate and all the points are lying scattered which does not give a clear idea and lacks accurate optimization of the function.
(Case2: statistical study for bounded region)
In this case,I will give a specific upper and lower limit to the function within this boundary,the function will perform the optimization.This will reduce the search space and time also to give me the output.The result will be more accurate then the earlier one.
8) To distinguish from the earlier program,I have assigned 'j' to the function and replaced all 'i's with 'j's.
*)The only change is that I have inserted boundary conditon in the ga code later to the number of variables inserted in the same code line. Everything else is just a copy paste to save time.
clear
close all
clc

%stalagmite function
%inputs for search space
x=linspace(0,0.6,150);
y=linspace(0,0.6,150);
num_case=50;
%Converting into 2D array
[xx,yy]=meshgrid(x,y);

%solving the function
for i=1:length(xx)
    for j=1:length(yy)
        inputs(1)=xx(i,j);
        inputs(2)=yy(i,j);
F(i,j)=stalagmite(inputs);
    end
end

tic
%Case2: Statistical study with upper and lower boundary
for j=1:num_case
    xout(j)=inputs(1);
    yout(j)=inputs(2);
    [inputs,Fout(j)]=ga(@stalagmite,2,[],[],[],[],[0,0],[1,1]);
end
study_case2=toc;

%plotting
figure(1)
subplot(2,1,1)
surfc(xx,yy,-F)
hold on
shading interp
plot3(xout,yout,-Fout,'marker','O','markersize',5,'markerfacecolor','g')
xlabel('x axis')
ylabel('y axis')
subplot(2,1,2)
plot(-Fout)
colorbar
xlabel('iterations')
ylabel('function maximum')
title('my stalagmite')
grid on
The output plot is as follows-
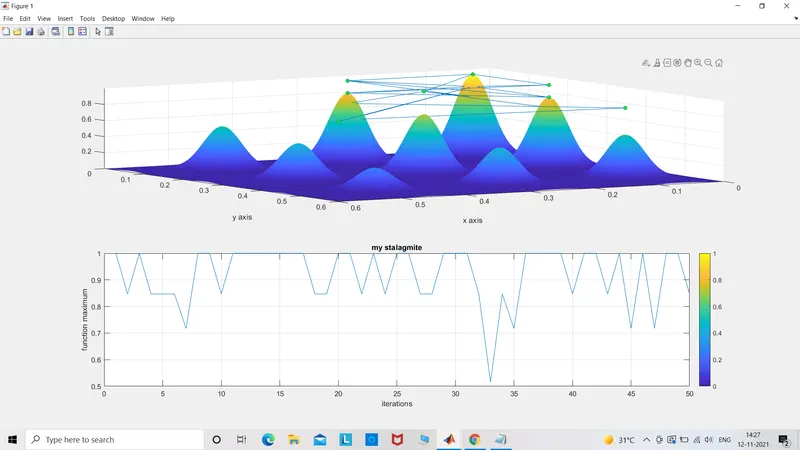
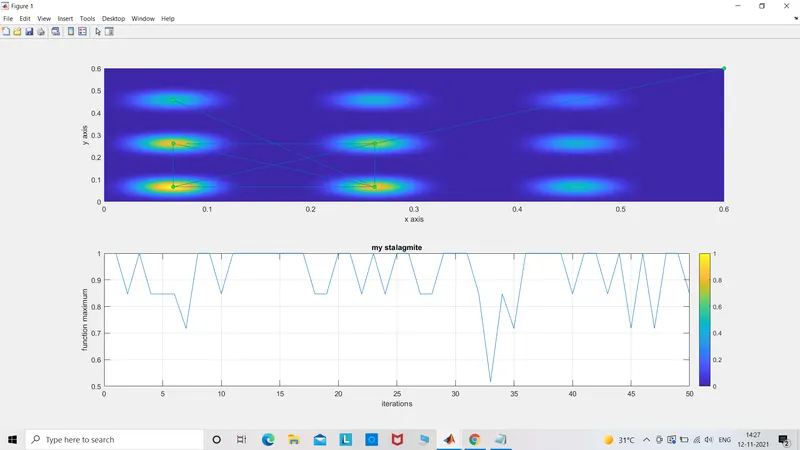
The plot clearly shows that after giving the boundary conditions, the variation of the optimization value of the function has reduced.
(Case3:statistical study with increased population size)
*)Here, I have increases the size of the population which will let in more set of inputs and will increase the possibilities of finding the better fitness of the function.This however increases the time of evaluation.
*)I have used 'optimoptions' to increase the size of the polpulation.The full command 'options=optimoptions('ga','population',300) increases the size of the population with inbulit command ga to 300.
*)the ga function will also have this increase of the population by adding ub and lb with options which is [inputs,Fout(k)]=ga(@stalagmite,2,[],[],[],[],[0;0],[1;1],[],[],options).The command is already explained earlier with all the variables.
clear
close all
clc

%stalagmite function
%inputs for search space
x=linspace(0,0.6,150);
y=linspace(0,0.6,150);
num_case=50;
%Converting into 2D array
[xx,yy]=meshgrid(x,y);

%solving the function
for i=1:length(xx)
    for j=1:length(yy)
        inputs(1)=xx(i,j);
        inputs(2)=yy(i,j);
F(i,j)=stalagmite(inputs);
    end
end

tic
%Case3: Statistical study with increased population size
inputs=optimoptions('ga','populationsize',300)
for k=1:num_case
    xout(k)=inputs(1);
    yout(k)=inputs(2);
    [inputs,Fout(j)]=ga(@stalagmite,2,[],[],[],[],[0;0],[1;1],[],[],inputs);
end
study_case3=toc;

%plotting
figure(1)
subplot(2,1,1)
surfc(xx,yy,-F)
hold on
shading interp
plot3(xout,yout,-Fout,'marker','O','markersize',5,'markerfacecolor','g')
xlabel('x axis')
ylabel('y axis')
subplot(2,1,2)
plot(-Fout)
colorbar
xlabel('iterations')
ylabel('function maximum')
title('my stalagmite')
grid on
The output plot is-
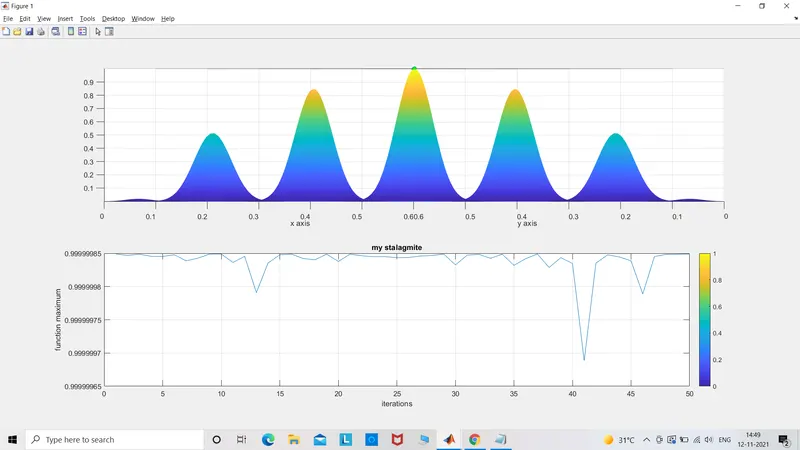
Hence we get a single value which is the global maxima value and hence stalgamite function helps to solve such problems easily with great accuracy in results.
REFERENCES
https://in.mathworks.com/help/gads/what-is-the-genetic-algorithm.html
https://in.mathworks.com/help/gads/ga.html#d120e39545
THANK YOU!