Project 1 - Parsing NASA thermodynamic data
File parsing- File parsing is breaking down the content of a specific file and then convert it into a easy language which can be read by a computer software to carry out variaous functions in that file and later store it.Each line containing words and number is split distinctively and converted it into a easy language which can be easy to read string.
*)In this particular project,I have to open the NASA's thermodynamic data sheet.Then,I have to convert each content of all the lines which could read by MATLAB and in the end I have to perform some functions with the given data of the sheet to calculate the specifics like specific heat,enthalpy,entropy and molecular mass.On the basis of the values found out, I have to plot the graphs and save them in the respected folders.
Formula that will prove handy:-

*)There are 53 elements with 14 coefficients.T is temperature,CP is specific heat,H is enthalpy,S is entropy and R is constant.Temperature for first 7 coefficient will be with respect to local high temperature and the other 7 coefficient will be with respect to local low temperature.
*)For molecular mass equation,the formula is=(number of atom)*(atomic weight) for individual species and I have to calculate for all 53 elements.
The main program with step by step explanation is as follows:-
clear
close all
clc

%file parsing of NASA themodynamic sheet
f1=fopen('THERMO.dat','r')
line1=fgetl(f1)
*)Clear,close all,clc is to erase any data in the workpage,editor page and command page and this is used in order to remove any previous data in any of the aforementioned sheets.
*)fopen is the inbuilt command used to open any external file and it gets extracted into the matlab.Here, it is the thermo.dat file which was already downloaded in the lappy.'r' will help in reading the file in the matlab.I have given the whole input to the output 'f1' to make it a simple code.
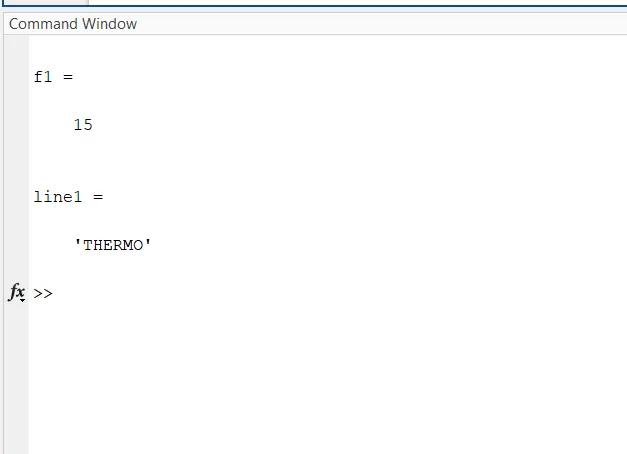
*)The 1st line is read by giving 'fgetl' inbuilt code which opens the thermo.dat sheet's 1st line content and opens it in the command window in matlab.fgetl is the function with input f1 because I have to open the data of that perticular sheet f1 which nothing but the thermo.dat NASA sheet.I have assigned this to output line1.
*)In command window,the output f1 should always be positive.
*)Next,I open the global temperature line and assign an output as line2
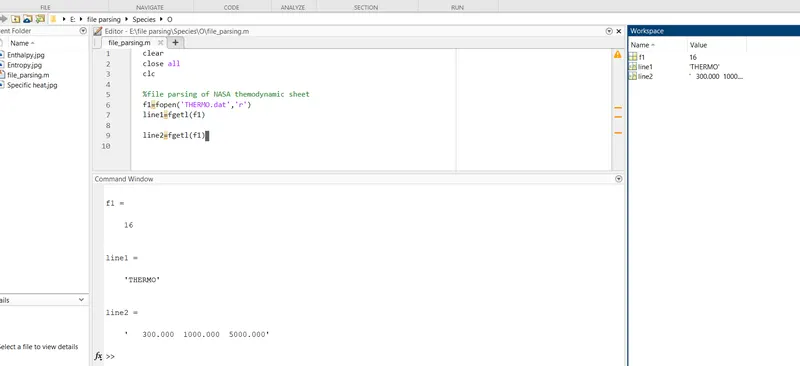
*)Now,I read the next 3 comment lines which are not useful.
%skipping the next comment lines
des_1=fgetl(f1);
des_2=fgetl(f1);
des_3=fgetl(f1);
A=strsplit(line2);
GLOBAL_LOW_TEMPERATURE=str2double(A{2});
GLOBAL_HIGH_TEMPERATURE=str2double(A{3});
GLOBAL_MID_TEMPERATURE=str2double(A{4});
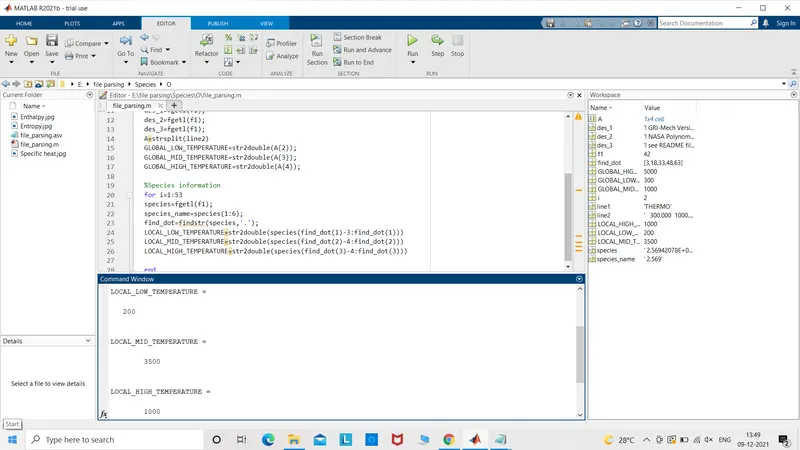
*)Next,I have to extract the global temperature line which is line2 so I have used the inbuilt command strsplit which will split the command into different numbers and then I have named them respectively.
*)The I use a for loop to perform a function for all the 53 elements at a time.Then I extract the local temperture line from the species line.
%Species information
for i=1:53
species=fgetl(f1);
species_name=species(1:6);
find_dot=findstr(species,'.');
LOCAL_LOW_TEMPERATURE=str2double(species(find_dot(1)-3:find_dot(1)))
LOCAL_MID_TEMPERATURE=str2double(species(find_dot(2)-4:find_dot(2)))
LOCAL_HIGH_TEMPERATURE=str2double(species(find_dot(3)-4:find_dot(3)))

end
*)There was dot common in all the temperature values so I located the dot by using inbulit command 'findstr'. 'str2double' is used to covert a statement into a numeral.
%Line1
L1=fgetl(f1);
A=findstr(L1,'E')
a1=str2double(L1(1:(A(1)+3)))
a2=str2double(L1(A(1)+4:A(2)+3))
a3=str2double(L1(A(2)+4:A(3)+3))
a4=str2double(L1(A(3)+4:A(4)+3))
a5=str2double(L1(A(4)+4:A(5)+3))

%Line2
L2=fgetl(f1);
B=findstr(L2,'E')
a6=str2double(L2(1:(B(1)+3)))
a7=str2double(L2(B(1)+4:B(2)+3))
A8=str2double(L2(B(2)+4:B(3)+3))
a9=str2double(L2(B(3)+4:B(4)+3))
a10=str2double(L2(B(4)+4:B(5)+3))


%Line3
L3=fgetl(f1);
C=findstr(L3,'E')
a11=str2double(L3(1:(C(1)+3)))
a12=str2double(L3(C(1)+4:C(2)+3))
a13=str2double(L3(C(2)+4:C(3)+3))
a14=str2double(L3(C(3)+4:C(4)+3))
*)Next I have extracted all the three lines containing the 14 coefficient with the help of same fgetl(f1),findstr,str2double commands.
%creating a directory to store the data
mkdir('F:\file parsing\Species\',species_name)

%Assuming the temperature range for calculation
T=linspace(LOCAL_MID_TEMPERATURE,LOCAL_HIGH_TEMPERATURE,100);

%Input
R=8.314;
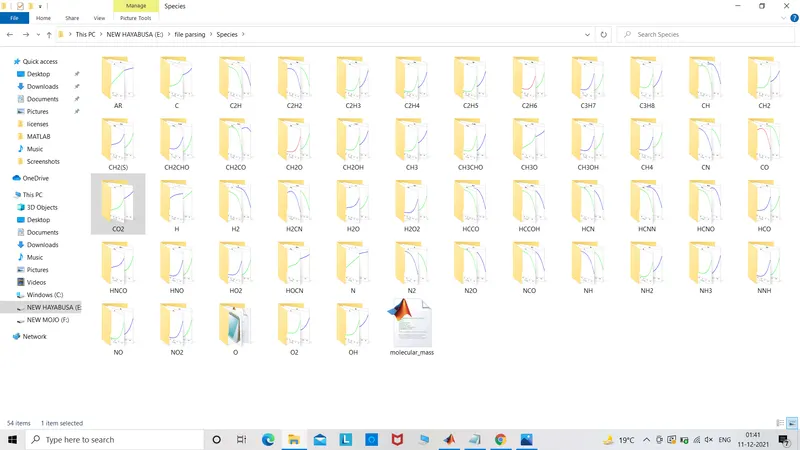
*)I have created a folder by using inbuilt command mkdir which means make directory or create a folder by the name file parsing inside which is species folder and then I have all the 53 elements folder where I will save my later work.Then,I have assumed the temperature range to be used for calculation purpose and later given an 'R' which has a constant value 8.314 as input for the same calculation purpose.
%calculating the entropy,enthapy of all the elements
if T<LOCAL_LOW_TEMPERATURE

Cp=R*(a1+a2*T+a3*T.^2+a4*T.^3+a5*T.^4);
    H=R*(a1+(a2*T)./(3)+(a3*(T.^2)./3)+(a4*(T.^3)./4)+(a5*(T.^4)./5)+(a6./T)).*T;
    S=R*(a1*log(T)+a2*T+(a3*(T.^2)./2)+(a4*(T.^3)./3)+(a5*(T.^4)./4)+a7);
else
    Cp=R*(a8+a9*T+a10*T.^2+a11*T.^3+a12*T.^4);
    H=R*(a8+(a9*T)./(3)+(a10*(T.^2)./3)+(a11*(T.^3)./4)+(a12*(T.^4)./5)+(a13./T)).*T;
    S=R*(a8*log(T)+a9*T+(a10*(T.^2)./2)+(a11*(T.^3)./3)+(a12*(T.^4)./4)+a14);
end
*)I have given a condition as per the given data which says that if T<local mid temp then I will consider the formula containing a1 to a7 and if T>local mid temp then the formula containing a8-a14 will be considered.
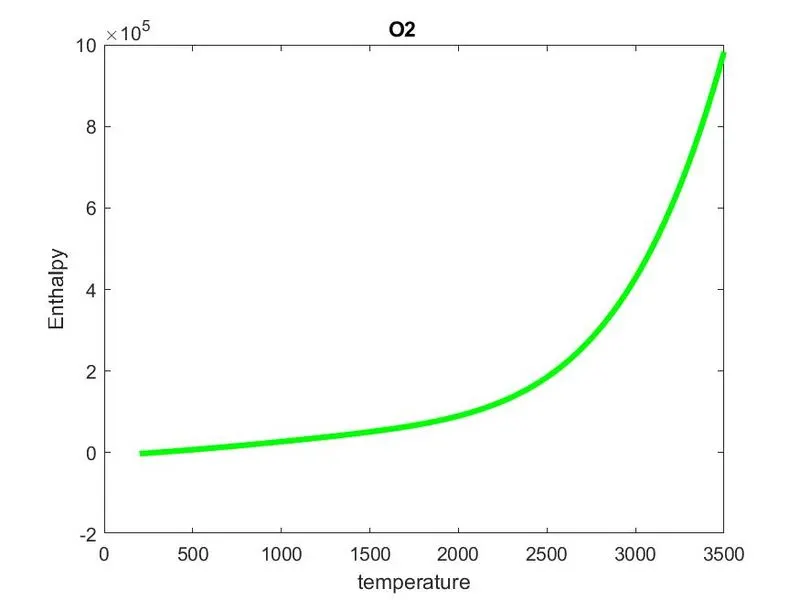
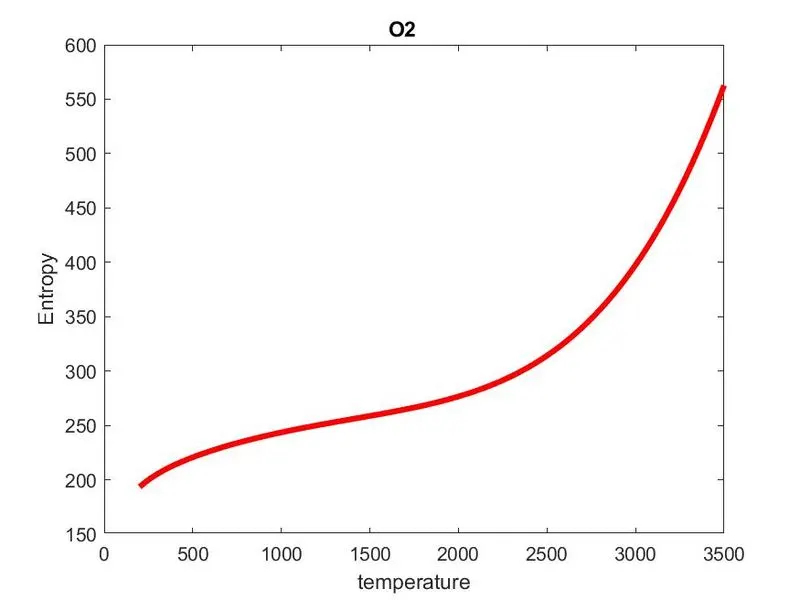
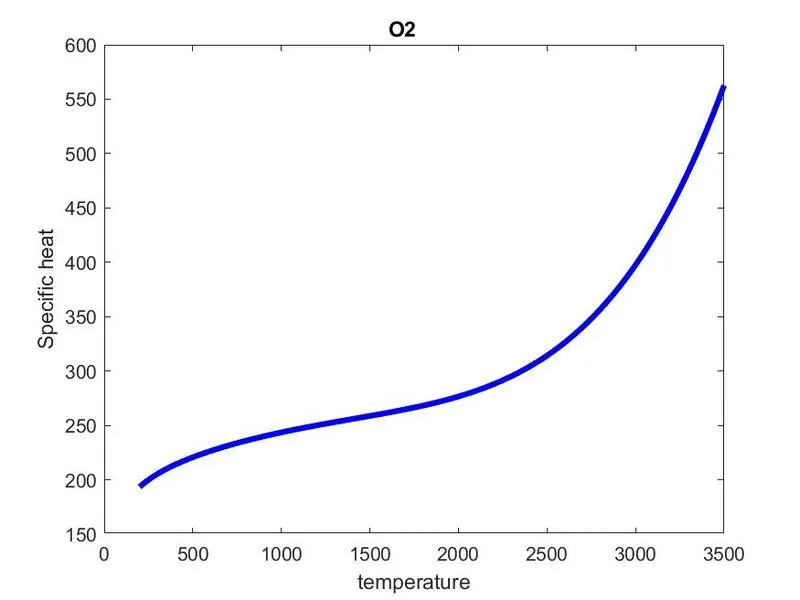
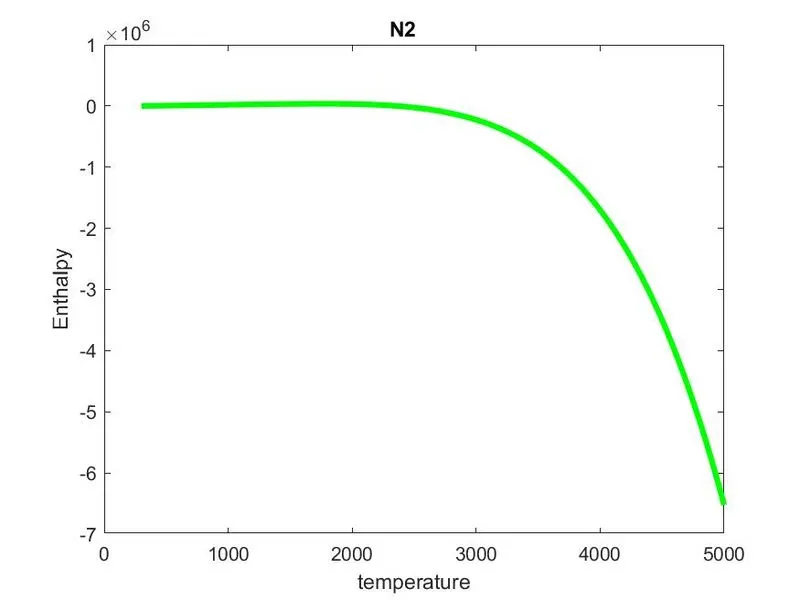
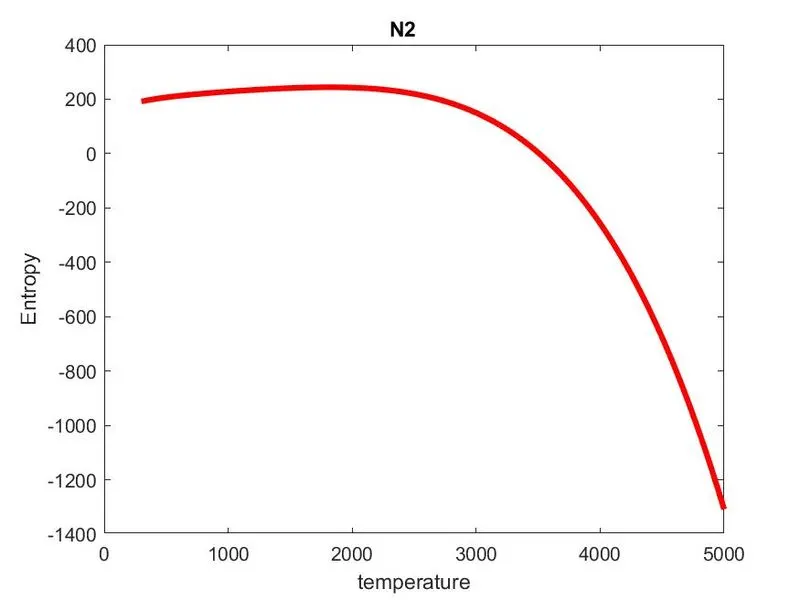
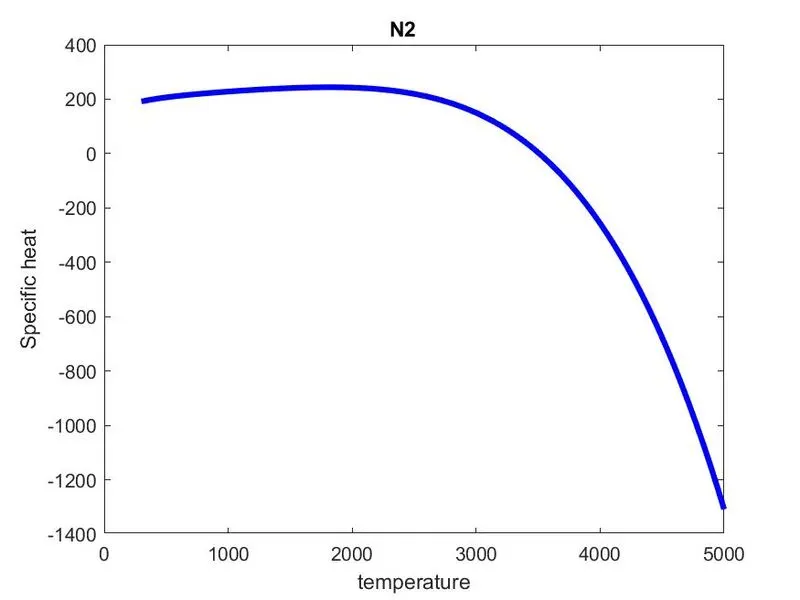
*) I have plotted the graph of enthalpy,entropy and specific heat by the array of values found out by the above formulaes.
%Plotting
%Temperature vs specific heat
figure(1)
plot(T,Cp,'linewidth',3,'color','r')
xlabel('temperature')
ylabel('specific heat')
title(species_name)
%Temperature vs Entropy
figure(2)
plot(T,S,'linewidth',3,'color','g')
xlabel('temperature')
ylabel('Entropy')
title(species_name)
%Temperature vs Enthalpy
figure(3)
plot(T,H,'linewidth',3,'color','b')
xlabel('temperature')
ylabel('Enthalpy')
title(species_name)
*)Now,I have saved the graphs in the respectable folder.directory is created and 'cd ' which means current directory will make the graphs to be saved in their respectable folders.
directory=(['F:\file parsing\Species\',species_name]);
cd(directory)
saveas(1,'Specific Heat.jpg')
saveas(2,'Entropy.jpg')
saveas(3,'Enthalpy.jpg')
cd('F:\file parsing\Species\')
Again by using 'cd' I have again switched back to the thermo file to perform the molecular mass calculations.To find the molecular mass the function comman is used in another tab.
function [MM]=molecular_mass(species_name)
species=upper(species_name)

constituents=['H','C','N','O','A'];
atomic_weight=[1.00794 12.0107 14.0067 15.9994 39.948];
MM=0;
for j=1:length(species)
    for k=1:length(constituents)
    if strcmp(species(j),constituents(k))
    MM=MM+atomic_weight(k);
    position=k;
    end
    end
    n=str2double(species(j));
    if n>1
        MM=MM+atomic_weight(position)*(n-1);
    end
end
end
Full code
clear
close all
clc

%file parsing of NASA themodynamic sheet
f1=fopen('THERMO.dat','r');
line1=fgetl(f1);

line2=fgetl(f1);
%skipping the next comment lines
des_1=fgetl(f1);
des_2=fgetl(f1);
des_3=fgetl(f1);
A=strsplit(line2);
GLOBAL_LOW_TEMPERATURE=str2double(A{2});
GLOBAL_HIGH_TEMPERATURE=str2double(A{3});
GLOBAL_MID_TEMPERATURE=str2double(A{4});

%Species information
for i=1:53
species=fgetl(f1);
species_name=species(1:6);
find_dot=findstr(species,'.');
LOCAL_LOW_TEMPERATURE=str2double(species(find_dot(1)-3:find_dot(1)));
LOCAL_MID_TEMPERATURE=str2double(species(find_dot(2)-4:find_dot(2)));
LOCAL_HIGH_TEMPERATURE=str2double(species(find_dot(3)-4:find_dot(3)));

%Line1
L1=fgetl(f1);
A=findstr(L1,'E');
a1=str2double(L1(1:(A(1)+3)));
a2=str2double(L1(A(1)+4:A(2)+3));
a3=str2double(L1(A(2)+4:A(3)+3));
a4=str2double(L1(A(3)+4:A(4)+3));
a5=str2double(L1(A(4)+4:A(5)+3));

%Line2
L2=fgetl(f1);
B=findstr(L2,'E');
a6=str2double(L2(1:(B(1)+3)));
a7=str2double(L2(B(1)+4:B(2)+3));
a8=str2double(L2(B(2)+4:B(3)+3));
a9=str2double(L2(B(3)+4:B(4)+3));
a10=str2double(L2(B(4)+4:B(5)+3));


%Line3
L3=fgetl(f1);
C=findstr(L3,'E');
a11=str2double(L3(1:(C(1)+3)));
a12=str2double(L3(C(1)+4:C(2)+3));
a13=str2double(L3(C(2)+4:C(3)+3));
a14=str2double(L3(C(3)+4:C(4)+3));

%creating a directory to store the data
mkdir('F:\file parsing\Species\',species_name)

%Assuming the temperature range for calculation
T=linspace(LOCAL_MID_TEMPERATURE,LOCAL_HIGH_TEMPERATURE,100);

%Input
R=8.314;
%calculating the entropy,enthapy of all the elements
if T<LOCAL_LOW_TEMPERATURE

Cp=R*(a1+a2*T+a3*T.^2+a4*T.^3+a5*T.^4);
    H=R*(a1+(a2*T)./(3)+(a3*(T.^2)./3)+(a4*(T.^3)./4)+(a5*(T.^4)./5)+(a6./T)).*T;
    S=R*(a1*log(T)+a2*T+(a3*(T.^2)./2)+(a4*(T.^3)./3)+(a5*(T.^4)./4)+a7);
else
    Cp=R*(a8+a9*T+a10*T.^2+a11*T.^3+a12*T.^4);
    H=R*(a8+(a9*T)./(3)+(a10*(T.^2)./3)+(a11*(T.^3)./4)+(a12*(T.^4)./5)+(a13./T)).*T;
    S=R*(a8*log(T)+a9*T+(a10*(T.^2)./2)+(a11*(T.^3)./3)+(a12*(T.^4)./4)+a14);
end

%Plotting
%Temperature vs specific heat
figure(1)
plot(T,Cp,'linewidth',3,'color','r')
xlabel('temperature')
ylabel('specific heat')
title(species_name)
%Temperature vs Entropy
figure(2)
plot(T,S,'linewidth',3,'color','g')
xlabel('temperature')
ylabel('Entropy')
title(species_name)
%Temperature vs Enthalpy
figure(3)
plot(T,H,'linewidth',3,'color','b')
xlabel('temperature')
ylabel('Enthalpy')
title(species_name)
directory=(['F:\file parsing\Species\',species_name]);
cd(directory)
saveas(1,'Specific Heat.jpg')
saveas(2,'Entropy.jpg')
saveas(3,'Enthalpy.jpg')
cd('F:\file parsing\Species\')

%calculation of molecular mass
[MM]=molecular_mass(species_name)
end
fclose(f1)
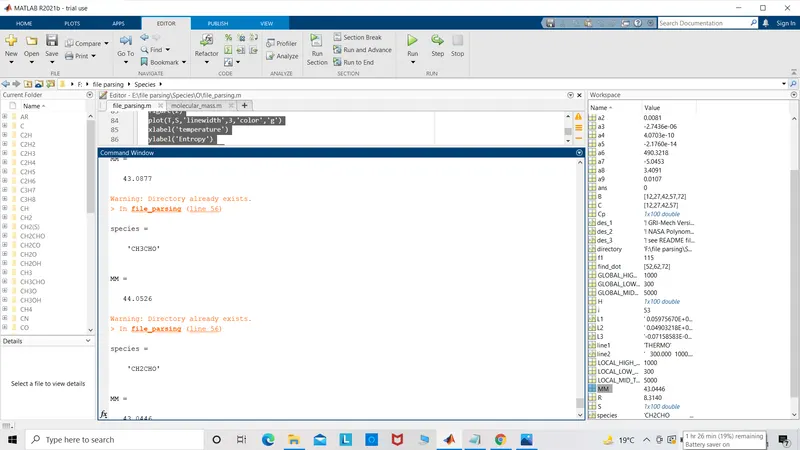
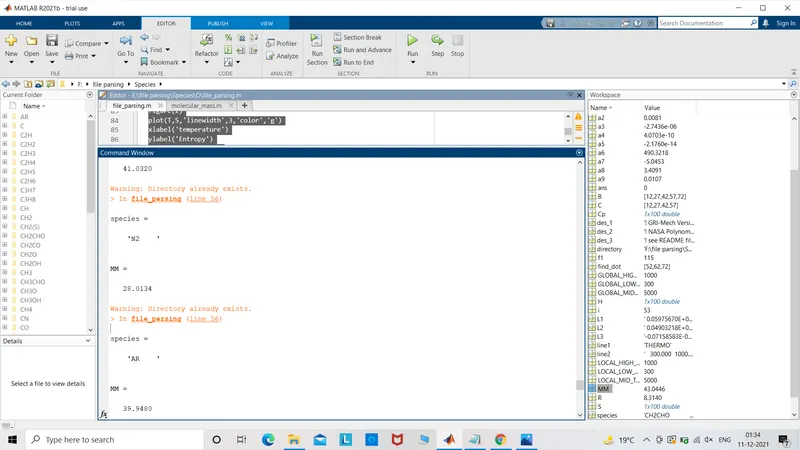
output in command window
Output graphs of CO2
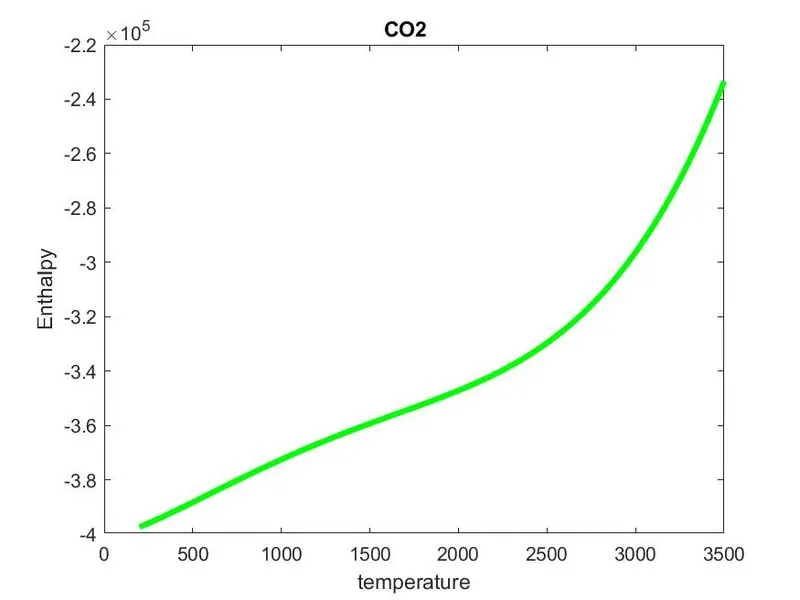
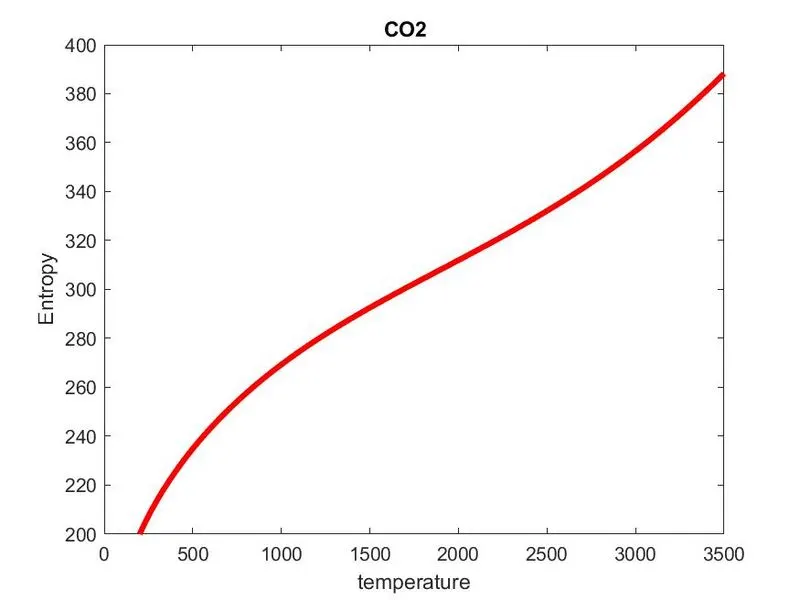
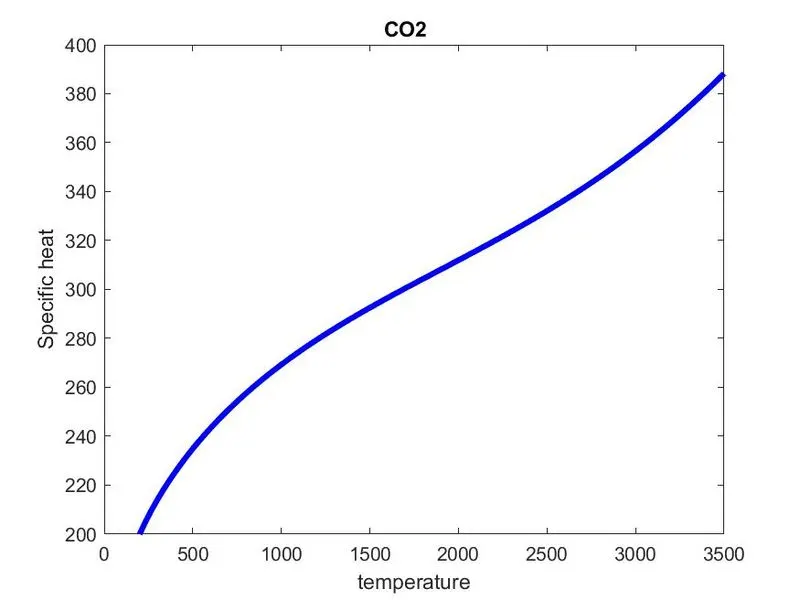
Output graph of O2
Output graph of N2
reference
https://in.mathworks.com/help/matlab/ref/fgetl.html
https://physics.stackexchange.com/questions/153452/why-does-heat-added-to-a-system-at-a-lower-temperature-cause-higher-entropy-incr