Week 3 - Solving second order ODEs
Ans) I am given a 2ODE equation so in order to solve it,I have converted it into two 1st order equation
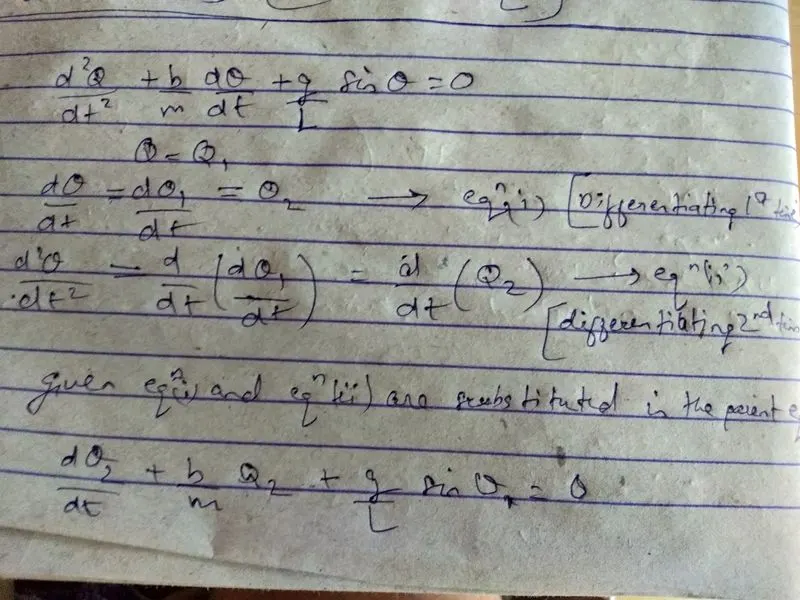
I gave the inputs
%pendulum kinematics
%Inputs

% gravity 'm/s'
g=9.8

% length 'm'
L=1

% mass kg
m=1

% damping coefficient
b=0.05
Initial condition will be'0' for initial displacement and 3 for initial velocity of the pendulum is defined and there are two ODE equations one for displacement and other for velocity so,
%Initial condition
theta_0=[0;3]
To obtain the solution,I will integrate it and for that I need to define the time interval so,
%time points
t_intr=linspace(0,20,500)
I have given initial and final time 0 to 10 sec with 100 values in between.
next,
- in tab 2
ode_func which is defining the function and t,theta,b,g,l,m are the input parameters. And then I have written the initial notebook page content in terms of codes.
function [dtheta_dt] = ode_func(t,theta,b,g,l,m)
theta1=theta(1)
theta2=theta(2)
dtheta1_dt=theta2
dtheta2_dt=-(b/m)*theta2-(g/l)*sin(theta1)
dtheta_dt= [dtheta1_dt;dtheta2_dt]
end
- the above function is copied on tab 1
To solve the ODE,I have used an in build command 'ode45' followed by @(t,theta) means the equation is solved with respect to 't' and 'theta'.I have copied ode_func which is the defined funtion and later t_int and theta_0 are included which means I am integrating the equation with the time array which is 't_intr'.Later the initial conditions are mentioned at the begining of the time which is 'theta_0'.
%Solving the ODE
[t,results]=ode45(@(t,theta)ode_func(t,theta,b,g,L,m),t_intr,theta_0)
I got an error,I had mistakenly used small caps 'l' instead of upper caps 'L'.Replacing 'l' with 'L' everywhere in the program.
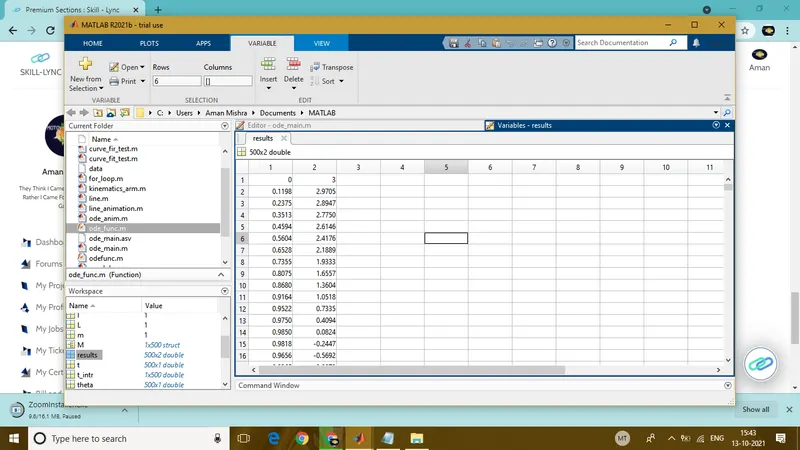
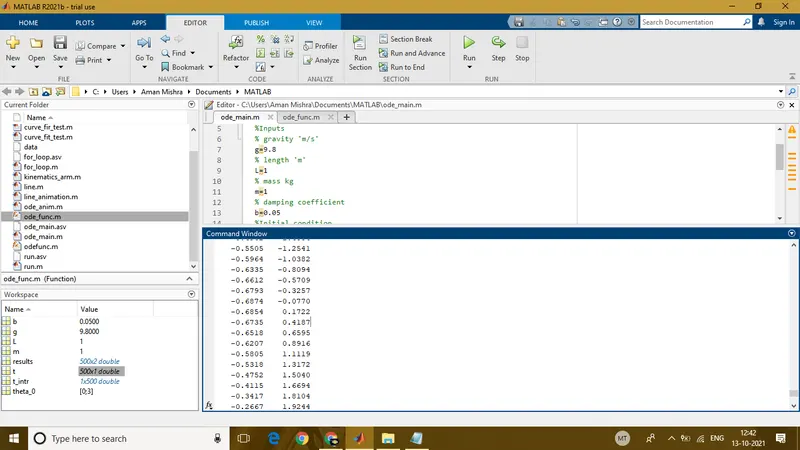
By running the code,I got the values of 'results' with displacement and velocity resp displayed in 2 columns in a from of an array.
- To plot the graph,
plot(t,results(:,1),'linewidth',2)
hold on
plot(t,results(:,2),'linewidth',1)
xlabel('damp')
ylabel('time')
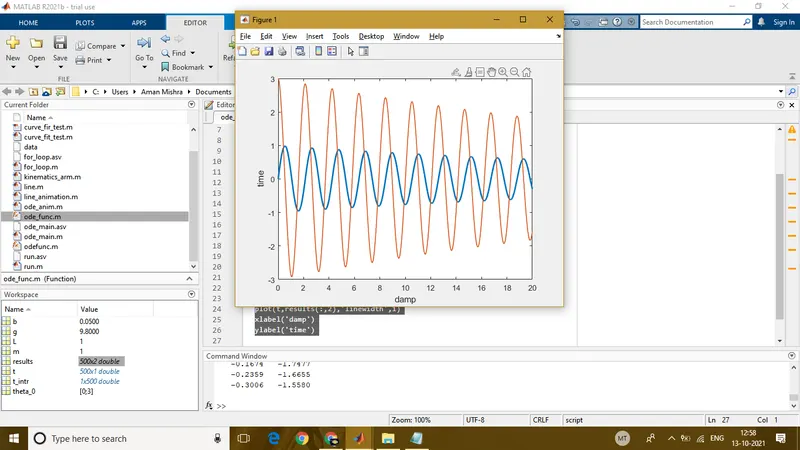
here, as there are 2 columns-1)displacement 2)velocity so we have to provide code for two different graphs.I have labels x axis and y axis later.
We can see the pendulum is getting damping gradually with intial points of displacement and velosity as 0 and 3.
Next is to show this graph with an actual pendulum swing.
The same 'for' command will give the pendulum the motion.Here,y as the pendulum will use the negative portion of the y axis.
%Animation
theta=results(:,1);

for i=1:length(theta)
THETA=theta(i)
%Inputs
l=1

x0=0
y0=0
x1=l*sind(THETA)
y1=-l*cosd(THETA)
end
To plot the lines which will ultimately construct the pendulum,I have used 'plot' command and it will be done step by step.First, I have plotted the ceiling of the pendulum.
%plotting
figure(2)
plot([-1 1],[0 0],'linewidth',3,'color','b')
Next,the arm of the pendulum is constructed. I have to use 'hold on' command to maje the ceiling visible along with the arm.
hold on
plot([x0 x1],[y0 y1],'linewidth',3,'color','r')
Next, I have displayed a bob by using the command 'markers'
plot(x1,y1,'O','MarkerSize',20,'MarkerFaceColor','g')
hold off
grid on
axis([-2 2 -2 2])
The pendulum looks like this
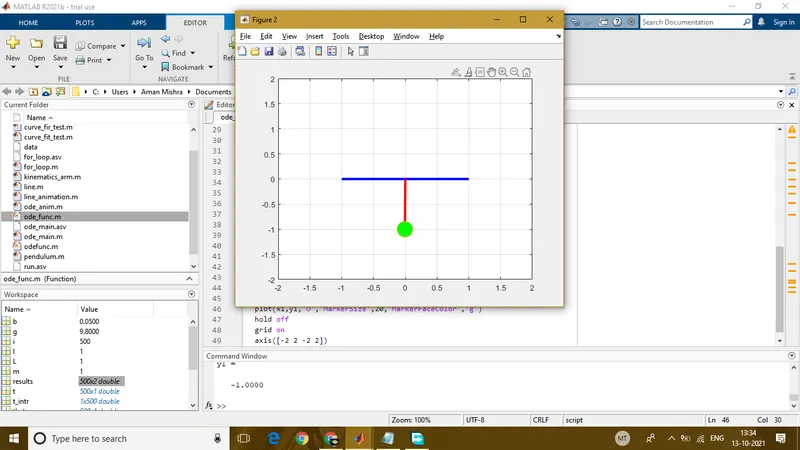
I realized the 'for' command should have all of these commands so I relocated the 'end' command. After running the code I found that the pendulum was swinging but was tough to figure out the motion.I had given the angles in degree but angular displacement is given in radian so I removed the'd' from (sin and cos) theta.
To create the movie of the pendulum swing,
%Animation/Movie
movie(M)
videofile=VideoWriter('swinging_of_pendulum.avi');
open(videofile)
writeVideo(videofile,M)
close(videofile)
Final program
close all
clc
%pendulum kinematics
%Inputs
% gravity 'm/s'
g=9.8;
% length 'm'
L=1;
% mass kg
m=1;
% damping coefficient
b=0.05;
%Initial condition
theta_0=[0;3];
%time points
t_intr=linspace(0,20,500);

%Solving the ODE
[t,results]=ode45(@(t,theta)ode_func(t,theta,b,g,L,m),t_intr,theta_0);
%plotting
plot(t,results(:,1),'linewidth',2)
hold on
plot(t,results(:,2),'linewidth',1)
xlabel('damp')
ylabel('time')

%Animation
theta=results(:,1);
ct=1;
for i=1:length(theta)
THETA=theta(i);
%Inputs
l=1;

x0=0;
y0=0;
x1=l*sin(THETA);
y1=-l*cos(THETA);

%plotting
figure(2)
plot([-1 1],[0 0],'linewidth',3,'color','b')
hold on
plot([x0 x1],[y0 y1],'linewidth',3,'color','r')
plot(x1,y1,'O','MarkerSize',20,'MarkerFaceColor','g')
hold off
grid on
axis([-2 2 -2 2])
pause(0.03)
M(ct)=getframe(gcf);
ct=ct+1;
end

%Animation/Movie
movie(M)
videofile=VideoWriter('swinging_of_pendulum.avi');
open(videofile)
writeVideo(videofile,M)
close(videofile)
YOUTUBE LINK
https://www.youtube.com/watch?v=pddi0x0SKzA
Thankyou.