Project 1 - Parsing NASA thermodynamic data
AIM: Write a code in MATLAB to parse NASA thermodynamic data file for various elements.
OBJECTIVE:
- Write a code that extracts the 14 coefficients and calculates the enthalpy, entropy, and specific heats for all the species in the data file.
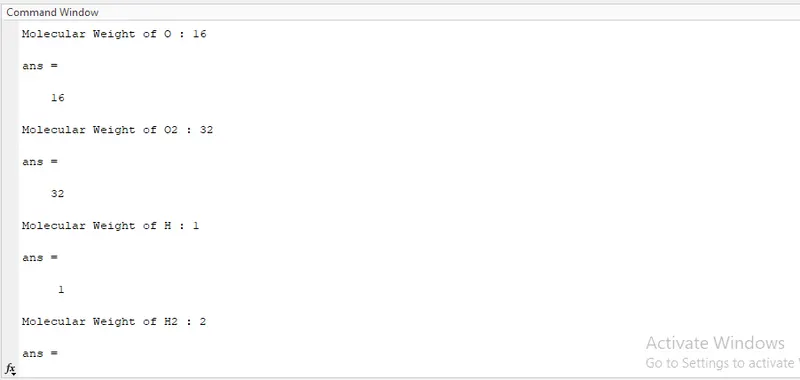
- Calculate the molecular weight of each species and display it in command window.
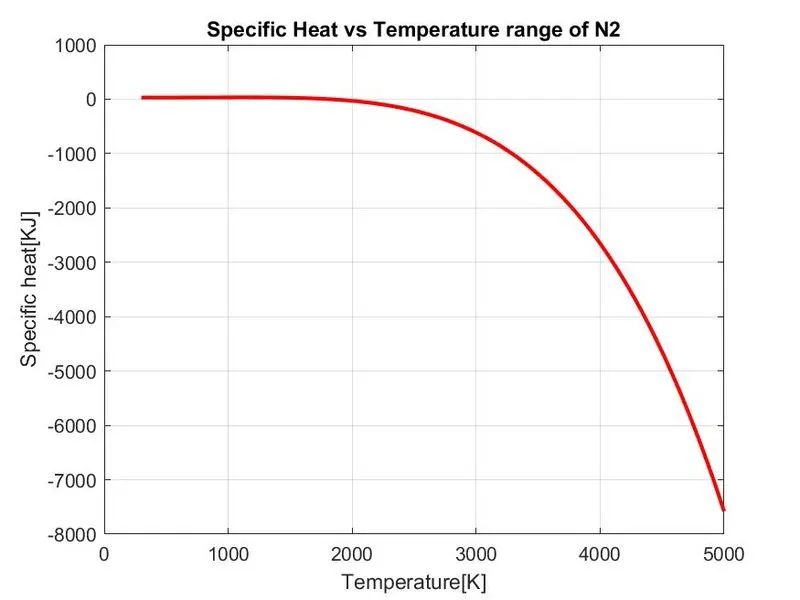
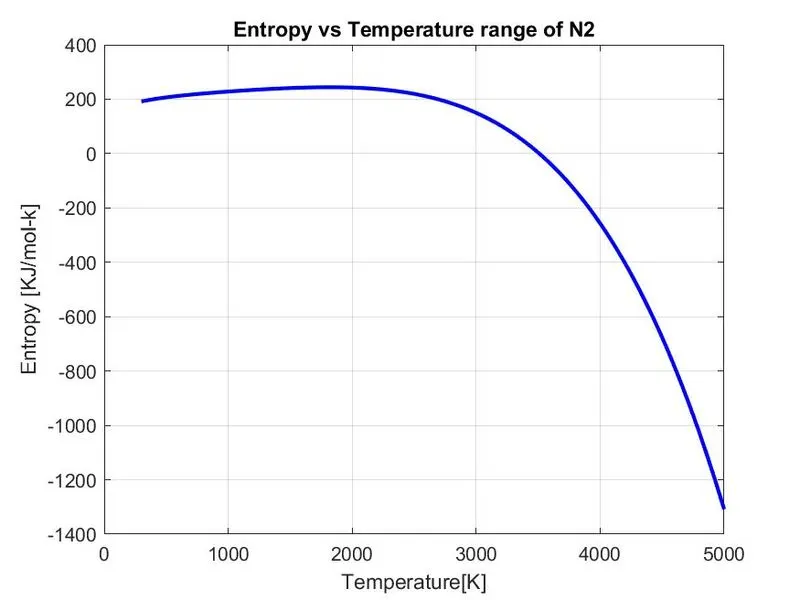
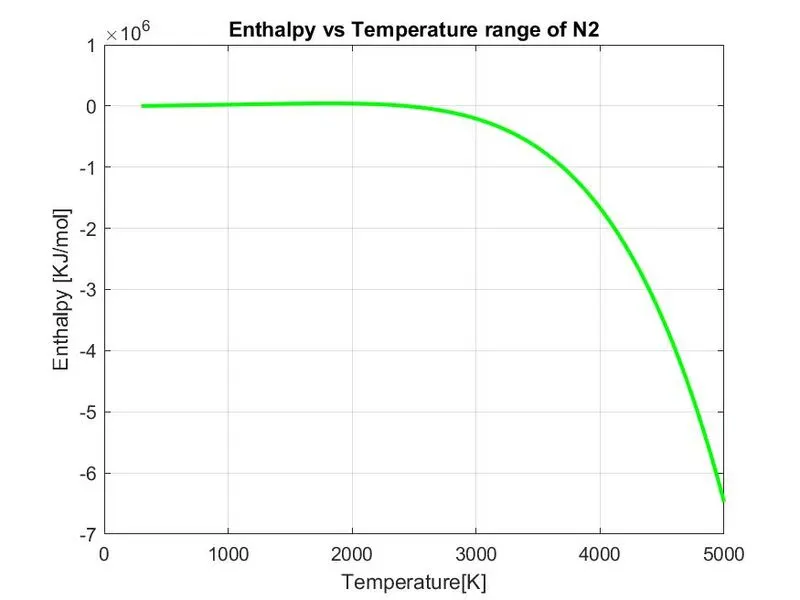
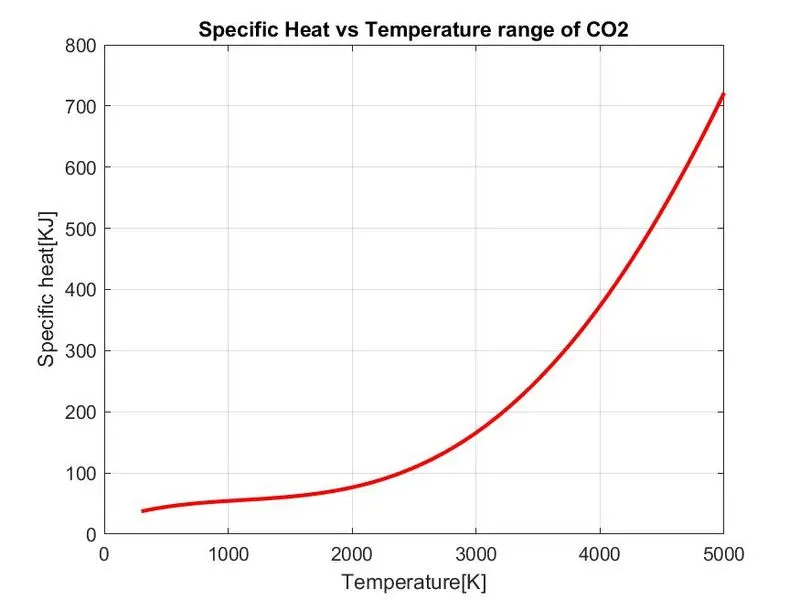
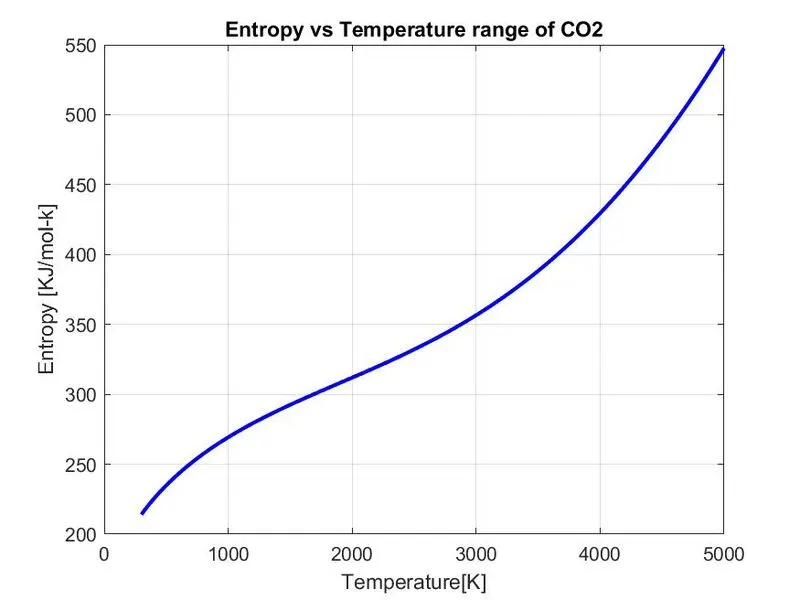
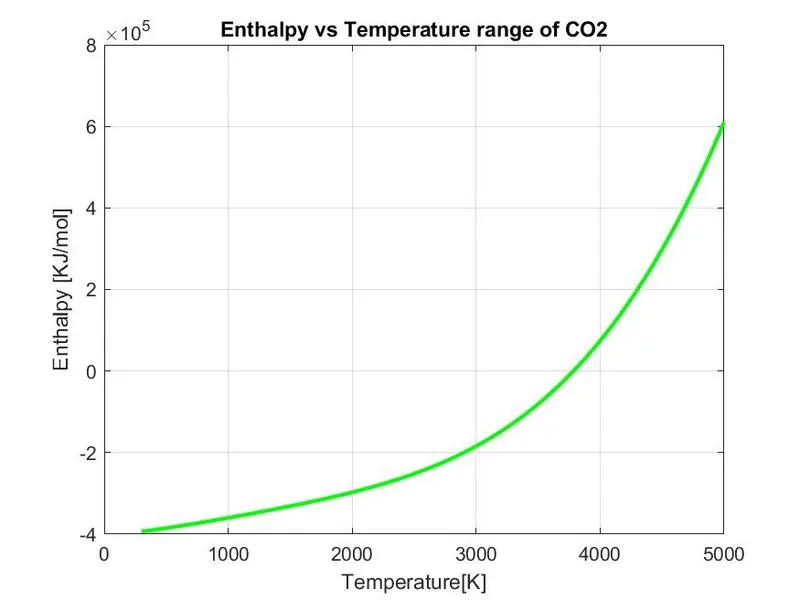
- Plot the specific heat, enthalpy,entropy for the local temperature range(low temperature:high temperature)specific for each species.
- Save the plots as images with appropriate names and dump them in seperate folders for each species with suitable name. All these should be generated automatically.
- Generate CP,Hand S plots.
GOVERNING EQUATIONS:

Where,
Cp is the specific heat
H is enthalpy
S is entropy
R is the universal gas constatnt
T is the temperature range
a1,a2,a3,a4,a5,a6,a7 are the numerical coefficients provided in NASA thermodynamic files.
INPUTS:
NASA thermodynamic data file link.
EXPLANATION:
- Before writing the main program code we have to write several function codes which are essential for the working of the main program.
- Firstly, we will write the code for specific heat function. We will define the function as specific heat and then compare it with the global temperature.If temperature is less than global temperature then minimum coefficients will be considered and if temperature are higher then maximum coefficients will be considered.
- Similarly we will write the code for ENTHALPY,ENTROPY, and the comaprison with the global temperature will be done as done in the previous function program in each of the cases.
- Now the program function for molecular weight will be written. We have to define some elements here like atomic weight, species name for main program. The string will be converted into individual array and is compared if species name matches with the atomic element.Then molecular weight is calculated by using coefficient number and atomic weight of each species by using the FOR LOOP.
- After that we will write code for plotting specific heat,enthalpy,entropy of each species and save them in respective species folder ny using the "mkdir"command. There will be seperate folder for each species name and their plots which is done by MKDIR, cd,pwd command. mkdir makes the new directory, cd command changes the path and pwd identifies the current directory.
- At last we will write our main program which will extract all the 14 elements from all the species for further calculation. For that first we open "thermo.dat" file and will fetch the line from t using "fgetl" command.By this command we will feed the data line by line. The file contains global temperature range which is splitted by using the "strsplit" command into global high,medium and low temperature range.
- In the file next three lines are comments which we can skip by using simple loop. the data after these are important as it contains the name of species and all the 14 coefficients which we want.
- First line contains species name , we will use strsplit to split them.
- Now in the coefficients, first 7 are of high temperature and other are of low we will extract them by suing "fgetl" command. As there coefficients are in string so we will convert them into numbers by using the "str2num" command.
- When all the coefficients are exracted then we will call our function codes to calculate specific heat, enthalpy, entropy and molecular weight.
- At last we will call our plot function so as to make the graphs for all the species.
CODE:
FOR SPECIFIC HEAT,
% Specific Heat function

function [CP] = SpecificHeat(a1,a2,a3,a4,a5,a8,a9,a10,a11,a12,Temp,R,global_mid_temp)

%Comparing with global temperature

%If Less then global it will take minimum coefficients

if Temp <= global_mid_temp
    CP= (a1+a2.*Temp+a3.*Temp.^2+a4.*Temp.^3+a5.*Temp.^4).*R;

    % If temp is more it will take max coefficients

else
    CP= (a8+a9.*Temp+a10.*Temp.^2+a11.*Temp.^3+a12.*Temp.^4).*R;
end
FOR ENTHALPY,
% Enthalpy Function

function [H] = Enthalpy(a1,a2,a3,a4,a5,a6,a8,a9,a10,a11,a12,a13,Temp,R,global_mid_temp)

% Comparing with global temperature

% If less then global then min coefficients will be taken else max

if Temp <= global_mid_temp
    H = (a1.*Temp+(a2.*Temp.^2)./2+(a3.*Temp^3)./3+(a4.*Temp.^4)./4+(a5.*Temp.^5)./5+a6).*R;

else
    H = (a8.*Temp+(a9.*Temp.^2)./2+(a10.*Temp.^3)./3+(a11.*Temp.^4)./4+(a12.*Temp.^5)./5+a13).*R;

end
FOR ENTROPY,
% Entropy function

function [S]= Entropy(a1,a2,a3,a4,a5,a7,a8,a9,a10,a11,a12,a14,Temp,R,global_mid_temp)

%Comparing with global temperature
%If less then global then will take min else max coefficients

if Temp <= global_mid_temp
    S= (a1.*log(Temp)+a2.*Temp+a3.*(Temp.^2)./2+a4.*(Temp.^3)./3+a5.*(Temp.^4)./4+a7).*R;
else
    S= (a8.*log(Temp)+a9.*Temp+a10.*(Temp.^2)./2+a11.*(Temp.^3)./3+a12.*(Temp.^4)./4+a14).*R;

end
FOR MOLECULAR WEIGHT,
% Molecular weight function

function [MW]= Molecular_weight(species_name)
s= { 'H' 'C' 'N' 'O' 'R'};
fprintf('Molecular Weight of ');
fprintf(species_name);
fprintf(' : ');

% Atomic weight of each individual
atomicweight = [ 1 12 14 16 40];
MW=0;

for i= 1:length(species_name)
    for j=1:length(s)
        if strcmp(species_name(i),s(j))
            MW= MW+atomicweight(j);
            %storing position of matched element
            position=j;
        end
    end
    n= str2num(species_name(i));
    if n > 1
        MW= MW+ atomicweight(position)*(n-1);
    end
end
fprintf('%d',MW);
disp(' ');
end
FOR PLOTTING,
% For plotting for each species

function ploting(CP,H,S,Temp,species_name)
cur_dir=pwd;
mkdir(species_name);
cd(species_name);

% Plot 1, Specific Heat(CP) vs Temperature range(Temp)
figure(1)
plot(Temp,CP,'linewidth',2,'color','r');
xlabel('Temperature[K]');
ylabel('Specific heat[KJ]');
title(sprintf('Specific Heat vs Temperature range of %s',species_name));
grid on
saveas(figure(1),'Specific Heat.jpg');

% Plot 2 , Enthalpy(H) vs Temperature range(Temp)
figure(2)
plot(Temp,H,'linewidth',2,'color','g');
xlabel('Temperature[K]');
ylabel('Enthalpy [KJ/mol]');
title(sprintf('Enthalpy vs Temperature range of %s',species_name));
grid on
saveas(figure(2),'Enthalpy.jpg');

%Plot 3 , Entropy (S) vs Temperature range
figure(3)
plot(Temp,S,'linewidth',2,'color','b');
xlabel('Temperature[K]');
ylabel('Entropy [KJ/mol-k]');
title(sprintf('Entropy vs Temperature range of %s',species_name));
grid on
saveas(figure(3),'Entropy.jpg');
cd(cur_dir);
MAIN CODE,
clear all
close all
clc

% Inputs
R= 8.314;

%Reading the file

f1= fopen('THERMO.dat','r');

%Reading Header

gt= fgetl(f1);

%Getting the global maximum,minimum and mid temperature
temp_range= fgetl(f1);

%SPLITTING
A= strsplit(temp_range,' ');

%Converting strings to numbers using str2num command

global_low_temp = str2num(A{2});
global_mid_temp = str2num(A{3});
global_high_temp = str2num(A{4});

%Defining working temperature range
Temp= linspace(global_low_temp,global_high_temp,500);

% Skipping the three comments
for i=1:3
    skip= fgetl(f1);
end

% Running loop for each species
for i=1:53
    % Reading the firstlinewhich tells us name of species
    line0=fgetl(f1);

    %reading the name of species
    species_name= strtok(line0);

    %Reading the three lines which contains coefficients

    line1=fgetl(f1);
    line2=fgetl(f1);
    line3=fgetl(f1);

    %Finding the position of E to locate the coefficients
    a= strfind(line1,'E');
    b= strfind(line2,'E');
    c= strfind(line3,'E');

    %Extracting the high temp coefficients
    a1=str2num(line1(1:a(1)+3));
    a2=str2num(line1(a(1)+4:a(2)+3));
    a3=str2num(line1(a(2)+4:a(3)+3));
    a4=str2num(line1(a(3)+4:a(4)+3));
    a5=str2num(line1(a(4)+4:a(5)+3));
    a6=str2num(line2(1:b(1)+3));
    a7=str2num(line2(b(1)+4:b(2)+3));

    % Extracting low temp coefficients
    a8=str2num(line2(b(2)+4:b(3)+3));
    a9=str2num(line2(b(3)+4:b(4)+3));
    a10=str2num(line2(b(4)+4:b(5)+3));
    a11=str2num(line3(1:c(1)+3));
    a12=str2num(line3(c(1)+4:c(2)+3));
    a13=str2num(line3(c(2)+4:c(3)+3));
    a14=str2num(line3(c(3)+4:c(4)+3));

    % Specific heat calculation
    CP= SpecificHeat(a1,a2,a3,a4,a5,a8,a9,a10,a11,a12,Temp,R,global_mid_temp);

    % Enthalpy Calculation
    H= Enthalpy(a1,a2,a3,a4,a5,a6,a8,a9,a10,a11,a12,a13,Temp,R,global_mid_temp);

    %Entropy calcultion
    S=  Entropy(a1,a2,a3,a4,a5,a7,a8,a9,a10,a11,a12,a14,Temp,R,global_mid_temp);

    %Molecular weight
     Molecular_weight(species_name)

     %plotting
     ploting(CP,H,S,Temp,species_name)


end
RESULTS:
PLOTS:
PLOT FOR O2
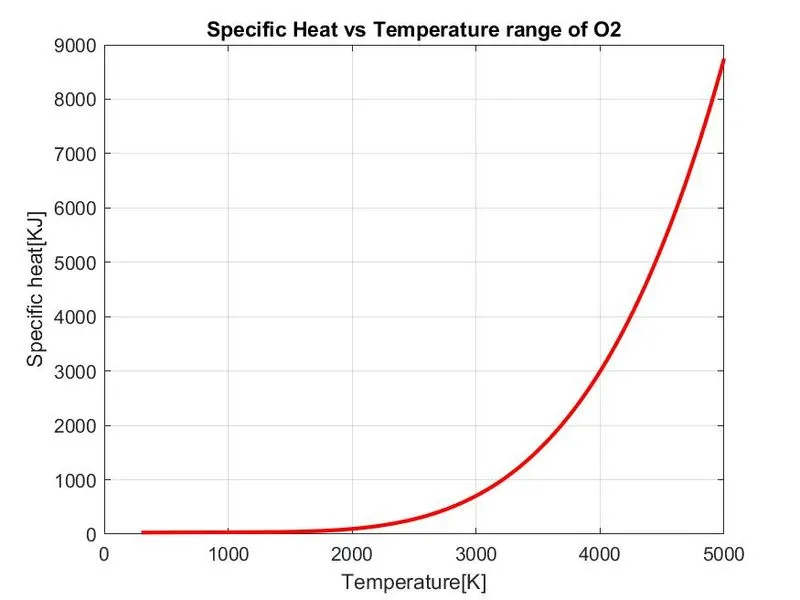
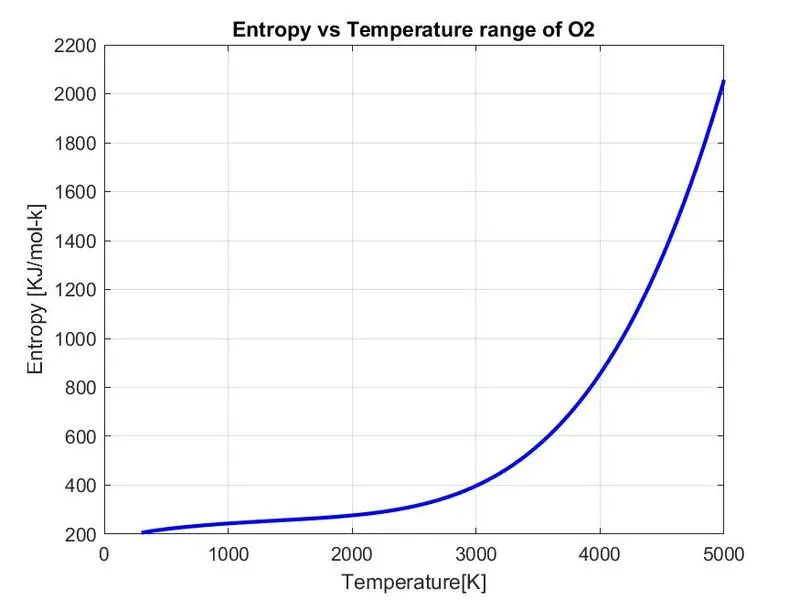
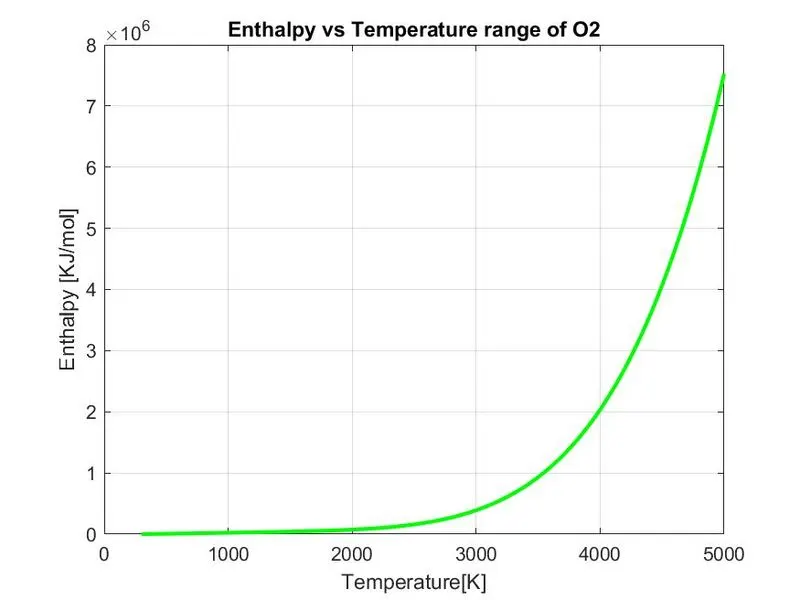
PLOTS FOR N2
PLOTS FOR CO2
COMMAND WINDOW SHOWING MOLECULAR WEIGHT,
SCREEN SHOT FOR ALL PLOTS FOLDER

ERRORS:
- Some silly errors were made during programming as function name is case sensitive so i got the error of that as-
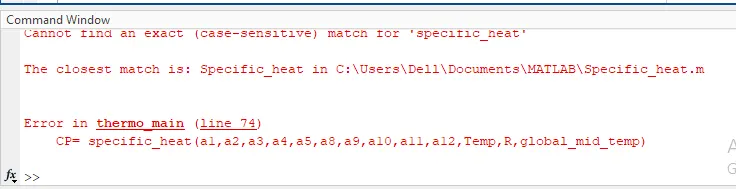
- it is resolved by correctly writing the names of function.
REFERENCES:
https://in.mathworks.com/help/matlab/ref/mkdir.html