Week 4.1 - Genetic Algorithm
1. Aim :- To optimize the stalagmite function and find global maxima using in build command in matlab called "Genetic Algorithm". And plot graphs for different studies such as, unbounded inputs, bounded inputs and bounded inputs with modified population size.
2. Objectives :-
a. To optimize the given stalagmite function.
b. To find global maxima for stalagmite function.
c. To plots graphs for three differernt studies i.e. for bounded inputs, unbounded inputs and bounded inputs modified population size.
3. Theory:-
Stalagmites :-
Stalagmite is nothing but rock formation that rises from cave floor due to accumulation of material deposited on the floors from ceiling dripping. Generally stalagmites are composed of clacium carbonate but may consist of materials like lava, dust, mud, peat, pitch, sand, sinter etc.
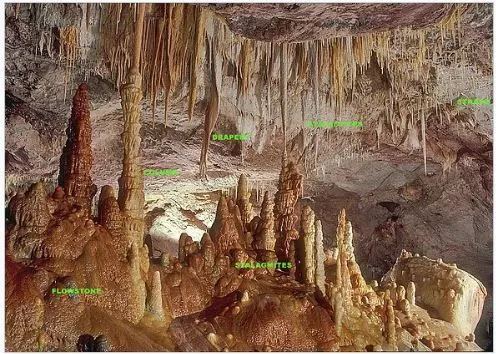
Following are some types of stalagmites,
1. Limestone stalagmites.
2. Lava stalagmites.
3. Ice stalagmites.
4. Concrete derived stalagmites.
Genetic Algorithm :-
Genetic algorithm(Ga) is metaheuristic inspired by process of natural selection that belongs to larger class of evolutionary algorithm(Ea). Genetic algorithm are generally used to generate high quality solution to optimization and research problems by relying on biologically inspired operators such as mutation, crossover and selection. Some Ga examples includes, optimizing decision trees, solving SuDKU puzzle, hyperparameters optimization.
Genetic algorithm consist of following five phases.
a. Initialization.
b. Fitness function.
c. Selection.
d. Crossover.
e. Mutation.
A. Intialization :-
1. The process begins with set of individual variables called "Population". Each variable is a solution of problem that you want to solve.
2. An individual is characterized by set of parameters known as "Genes". Genes are then joint into string to form chromosome.
3. In genetic algorithm, the set of genes of an individual represented as string in terms of an alphabet. Generally binary values are used.
B. Fitness function :-
Fitness function determines how an individual is fit. It gives fitness score to each individual. The probability that an individual is selected for reproduction in depends upon its fitness score.
C. Selection :-
The idea of selection phase is to select the fittest individual and let them pass their genes to next generation. Two pairs of individuals(Parents) are selected based on their fitness score. Individuals with higher score have more chanses to get selected for reproduction.
D. Crossover:-
Crossover is a very important phase in genetic algorithm. As pair of parents to be mated, a crossover point is choosen at random from the genes.
E. Mutation :-
In certain new offsprins are formed, some of their genes can be subjected to muatation wiith low random probability.This implies the bits in the bit string can be flipped.
3. Governing Equations :-
`f(x,y) = f1x, f2x,f1y,f2y`
where,
`f1x=[sin(5.1*3.14*x+0.5)]^6`
`f2x = exp[-4*ln(2)(x-0.0667)^2/0.64]`
`f1y=[sin(5.1*3.14*y+0.5)]^6`
`f2y = exp[-4*ln(2)*(y-0.0667)^2/0.64]`
`f = -(f1x*f2x*f1y*f2y)`
4. Code Explanation :-
First a random values of x and y where created and corresponding 2D arrays was obtained by using meshgrid command. A nested loop was used to assign value from this array to array called name input_vector. An input vector is input for stalagmite function. The stalagmite function code written seperatly. Minus sign is given to output so that we get proper output as per our requirement i.e. global maxima.
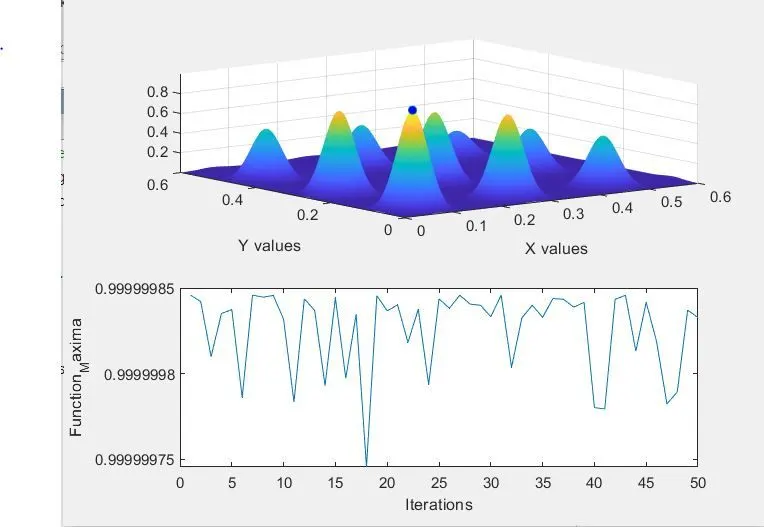
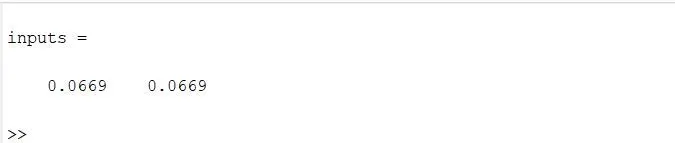
tic, toc command are used to evaluate each case time. In the first case, bounds are not defined are plot were made hence random solutions are obtained. Negative sign is given to f value inside the surface function to get stalagmite in upword direction. In second case bounding are given, so that no of solutions approaches more accuracy. Population size were increased in another case and results were plotted. The requied solution i.e. global maxima was found in last case that is nothing but bounded inputs with modified population size. The x and y value which the function has maximum value is also diplayed at last. The were decreased to such value so that results didn't vary and program consumed minimum time to execute.
Stalagmite Function Code.
%Function
function [f] = stalagmite(input_vector)
%Inputs,
x = input_vector(1);
y = input_vector(2);
%Function used as mentioned above.
f1 = (sin(5.1*3.14*x+0.5)).^6;
f2 = exp (-4*log(2)*((x-0.067).^2/.0.64);
f3 = (sin(5.1*3.14*y+0.5)).^6;
f4 = exp (-4*log(2)*((y-0.067).^2/.0.64);
f = -(f1*f2*f3*f4);
end
%Evaluating the stalagmite function.
%Input Variables
x =linspace(0,0.6,150);
y =linspace(0,0.6,150);
%Matrix Creation
[xx yy] = meshgrid(x,y); %.....................Creating Matrix from x and y values.
count = 50; %.....................Giving the count/number of iteration.
tic %.....................TIC start the clock time
for i= 1:length(xx)
for j=1:length(yy)
input_vector(1) = xx(i,j);
input_vector(2) = yy(i,j);
f(i,j) = stalagmite(input_vector); %...........Calling function
end
end
study_time = toc %.......................................Stop the timer
figure(1)
surfc(xx,yy,-f) %.......................................Creating surface from xx,yy and f values.
shading interp %......................................Shading the surface to make it look appeal.
xlabel('X-Label'); %......................................Labeling x-axis
ylabel('Y-Label'); %......................................Labeling y-axis
legend('X-values','Y-values'); %..............................Differentiate the x values and y values in graph.
%Code for Unbounded inputs
tic %.........................Start the timer
for i=1:count
[inputs,fopt(i)] = ga(@stalagmite,2)
xopt(i) = inputs(1);
yopt(i) = inputs(2);
end
study_time1 = toc; %......................stop the timer
figure(2)
surfc(x,y,-f) %......................creating surface from x,y,-f values
shading interp %......................shading the surface to make look appealing
xlabel('X value');
ylabel('Y value');
hold on
plot3(xopt,yopt,-fopt,'marker','o','markersize',5,'markerfacecolor','r')
subplot(2,1,2)
plot(-fopt)
xlabel('Iterations');
ylabel('Function_Maxima');
%Code for bounded inputs.
tic %...........................start clock time
for i = 1:count
[inputs, fopt(i)] = ga(@stalagmite,2,[],[],[],[],[0,0],[0.6,0.6]);
xopt(i) = inputs(1);
yopt(i) = inputs(2);
end
study_time2 = toc %............................stop clock time
figure(3)
subplot(2,1,1)
surfc(x,y,-f)
shading interp
xlabel('X values') %............................Labeling X-axis
ylabel('Y values') %............................Labeling Y-axis
hold on
plot3(xopt,yopt,-fopt,'marker','o','markersize',5,'markerfacecolor','EDB1')
subplot(2,1,2)
plot(-fopt)
xlabel('Iterations');
ylabel('Function Maxima');
%writing code for bounded surface with modified population size.
options = optimoptions(@ga);
options = optimoptions(options,'populationsize',170);
tic %...........................start clock time
for i = 1:count
[inputs, fopt(i)] = ga(@stalagmite,2,[],[],[],[],[0,0],[0.6,0.6]);
xopt(i) = inputs(1);
yopt(i) = inputs(2);
end
study_time3 = toc %............................stop clock time
figure(4)
subplot(2,1,1)
surfc(x,y,-f)
shading interp
xlabel('X values') %...............................Labeling X-axis
ylabel('Y values') %...............................Labeling Y-axis
hold on
plot3(xopt,yopt,-fopt,'marker','o','markersize',5,'markerfacecolor','b')
subplot(2,1,2)
plot(-fopt)
xlabel('Iterations');
ylabel('Function_Maxima');
Global_maxima = -fopt;
Display (inputs) %............................Displaying inputs which function has max. value.
5. Terms Explanation :-
1. Surfc :-
surf command is used to contuors the plot under the surface plot. surfc(x,y,z) creates a three dimentional surface plot with contuor plot underneath. surface plot is a three dimentinal that has solid edge colors and solid face colors. The function plots value in matrix z above a grid in x-y plane defined by x and y. The color of surfce varies according to heights as specified by z.
2. Shading :-
The shading command controls the color of surface and patch graphics objects, make it appealing. Shading flat each mesh line segment and face has a constant color determined by the color value at end point of the segment or the corner of the face that has the smallest index.
Shading interp varies the color in each line segment and face by interpolating the colormap index or true color value across the line or face.
shading applies the shading type to the object in the axes specified by axes handle instaed of current axes.
3. Plot3 command :-
Plot3 command plot the three dimentional co-ordinates in 3D space. To plot a set of co-ordinates connected by line segment, specify x,y and z as vector of same length.
To plot multiple set of co-ordinates on the same set of axes, specify at least one of x,y and z as a matrix and other as vectors.
4. Optimoptions :-
options = optimoptions(solvername) returns a set of default options for the solvername solver.
options = optimoptions(oldoptions,name,value) returns a copy of old options with the named parameters altered with specified values.
5. tic toc :-
tic works with the toc function to evaluate elapsed time. tic function records the current time and toc function used that recorded value to calculate elapsed time.
toc reads the elapsed time since the stop watch timer by calling function tic function.
Matlab read the internal time at the execution of toc function and display the elapsed time since the toc function being called without an output. The elapsed time is expressed in seconds.
6. Results :-
Results for execution after stalagmite function.
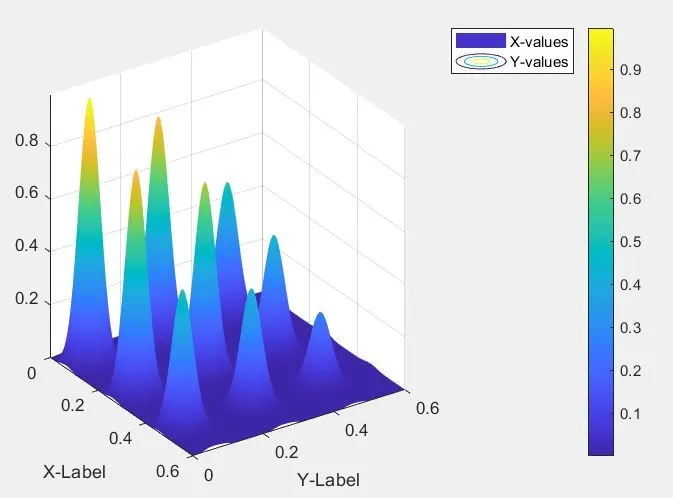
Result for Unbounded inputs.
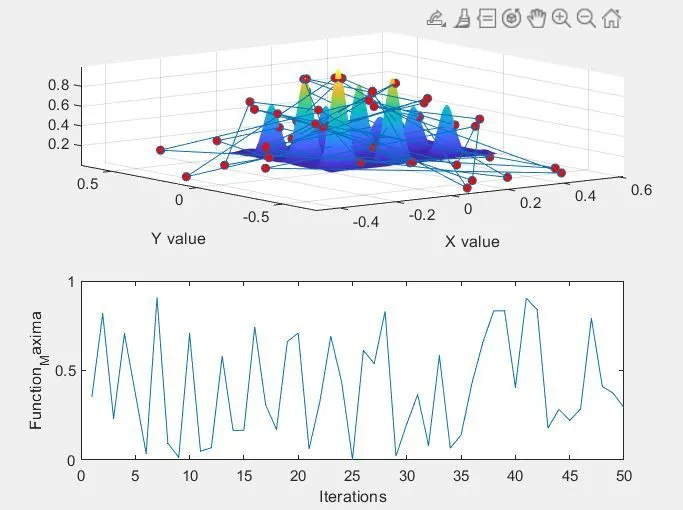
Result for bounded inputs.
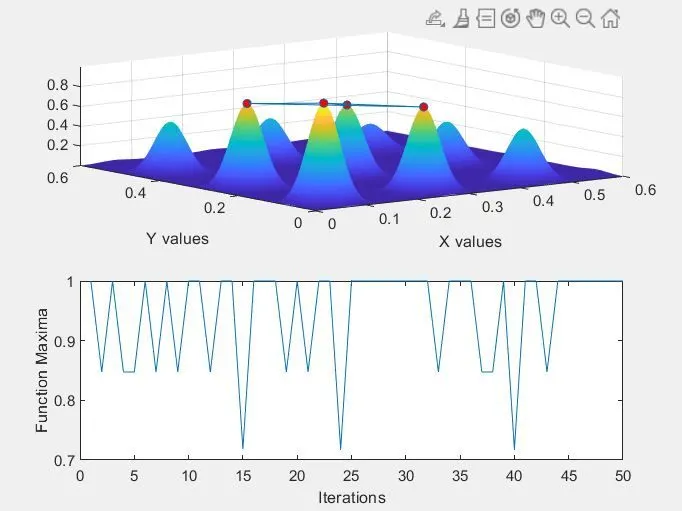
Result for bounded inputs with modified population size.
Values of x and y having maximum value.
Above results shows that the last image i.e. of bounded surface with modified population size have an accurate results/solution. It is because of code shoes random samples which can be start and end at random points.To solve this problem, bounded method is used to provide higher and lower values. It gives an output with different local maxima with bounded inputs. Abd to overcome this issue we need to increase the population size as it has max probability to cover global maxima. The global maxima function can be found by inverting the function. Find the minimum value of inverted function, the negative value of minimum will give the global maxima.