Week 3 - Solving second order ODEs
AIM:
To solve a 2nd order differential equation using programming and to stimulate the motion of a pendulum and create an animation of the output.
ABOUT:
ODE =
`((d^2theta)/dt^2) + (b/m)*((d theta)/dt) + (g/l)*sin(theta) = 0`
Higher order ODE is broken into set of 1st order ODE.In this case there are two 1st order ODE's
1) For Velocity
2) For Displacement
ode45(in built solver is matlab) is used in the programme.
The values for b , m ,g ,L are given. and the intial condition is given.
The time span is set.
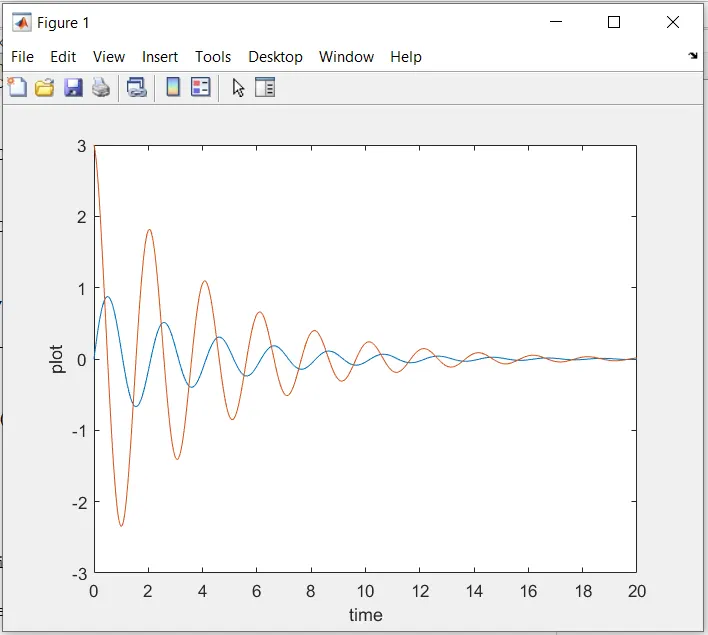
The ODE is solved and represented graphically.
For loop function is used to create animation of the moving pendulam.
The base which the pendulam is hanged are assigned.
The string of the pendulam is assigned.
markers function is used to define the round end of the pendulam.
markerfacecolor is used to color the round end of the pendulam.
The axis is assigned.
ct command is used which represents each frame.
An animation is created on running the programme.
A movie of the result is generated with all the frames.(AVI format)
MAIN FUNCTION:
clear all
close all
clc

b = 0.05;
g = 9.81;
l = 1;
m = 0.1;

% initial condition
theta_0 = [0;3];

% time span
t_span = linspace(0,20,500);

%solve ODE
[t , results] = ode45(@(t,theta) ode_func(t,theta,b,g,l,m),t_span,theta_0);

plot(t,results(:,1))
hold on
plot(t,results(:,2))
ylabel('plot')
xlabel('time')

ct = 1;
for i = 1:length(results(:,1))

    x0 = 0;
    y0 = 0;

    x1 = 1*sin(results(i,1));
    y1 = -1*cos(results(i,1));

    figure(2)
    plot([-1 1],[0 0],'linewidth',4,'color','k')
    hold on

    line([x0 x1],[y0 y1],'linewidth',2,'color','r')
    hold on;

    plot(x1,y1,'-o','markers',20,'markerfacecolor','r');

    axis([-1.5 1.5 -1.5 1])
    pause(0.0003);
    hold off
    M(ct)= getframe(gcf);
    ct=ct+1;

end

movie(M)
videofile = VideoWriter('ode_main.avi','uncompressed AVI')
open(videofile)
writeVideo(videofile,M)
close(videofile)
SUB FUNCTION:
function [dtheta_dt] = ode_func(t,theta,b,g,l,m)

    theta1 = theta(1)
    theta2 = theta(2)
    dtheta1_dt = theta2;
    dtheta2_dt = -(b/m)*theta2 - (g/l)*sin(theta1);
    dtheta_dt = [dtheta1_dt;dtheta2_dt];
end
RESULT:
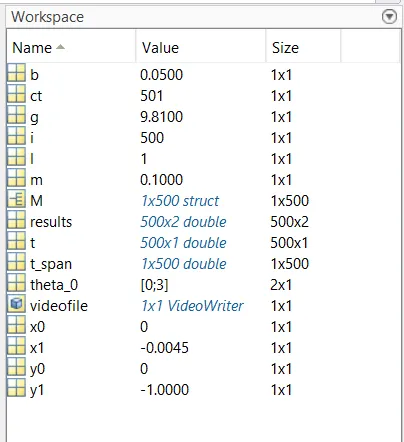
WORKSPACE:
GRAPHICAL REPRESENTATION:
ERROR OBTAINED:
Only the animation was shown after running the programme.
I didn't enter figure 2 in the for loop function , so after entering the same both figure 1 (graphical representation) and figure 2(animation) are shown as a result.
ANIMATION: