Project 1 - Parsing NASA thermodynamic data
AIM
To write a code in MATLAB for parsing NASA data file and to evaluvate thermodynamic properties of the species in the given data file.
ABOUT
File parsing is a method of splitting the file or input into a peice of data that can be easily stored or manupulated .Here we are splitting strings into parts then recognizing the parts to convert into something simpler nthan string.
Formulas used to calculate enthalpy,entropy and specific heat:

cp = specific heat
H = Enthalpy
S = Entropy
R = Universal gas constand(8.314)
T = Temperature
Molecular weightis a measure of sum of atomic weight values of the atoms in a molecule.
CODE
fopen command is used to open the file.
fgetl command is used to read the file line by line.
After we use fopen command we will be assigning to the variable f1.
strsplit command is used to split the string
str2num converts a character array or string scalar to a numeric matrix.
Next 3 lines are skipped.
loop command is used for all the gas species.
strfind command is used to find out species which we are going to locate the string,which is present in after the species name.
Each coefficient has an E character in it.Using this the coefficients can be extracted as a string and can be converted into an integer.
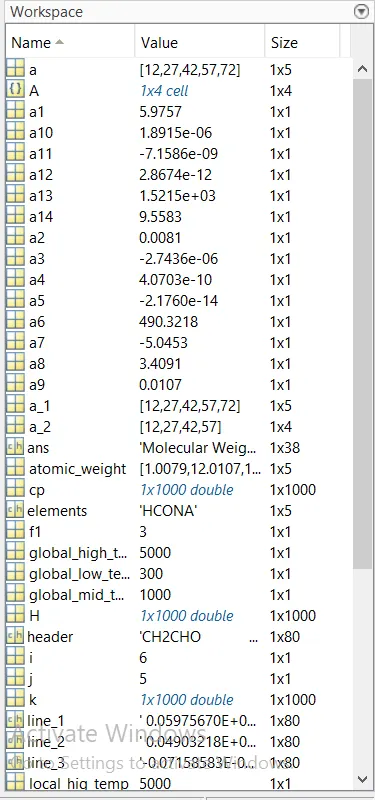
Values of 14 coeffients are stored in different variables.
Location to be stored is specified.
if command is used to create file for each species.if the folder existit will simply save or else it will create a folder to save the plot.
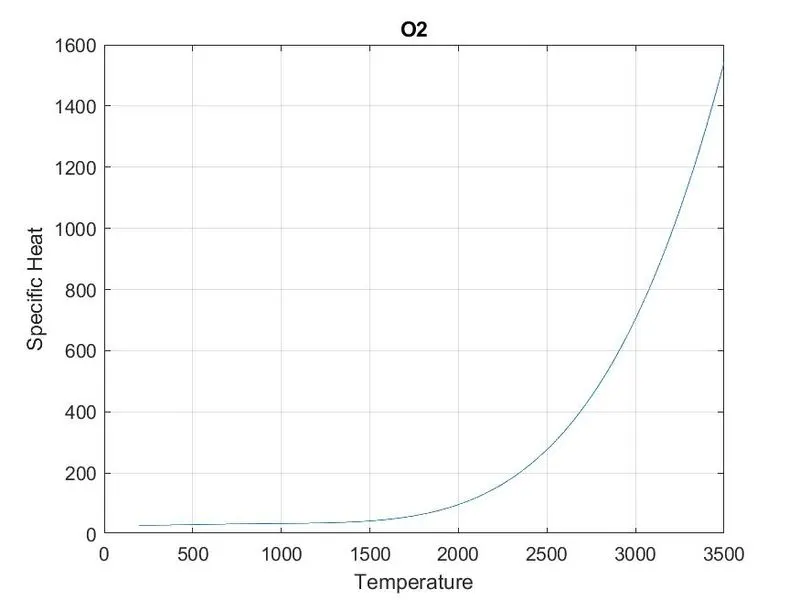
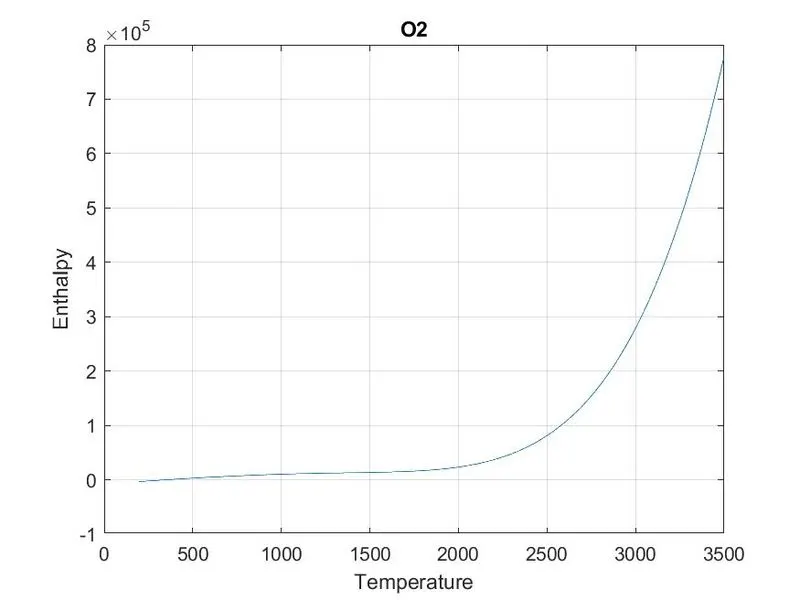
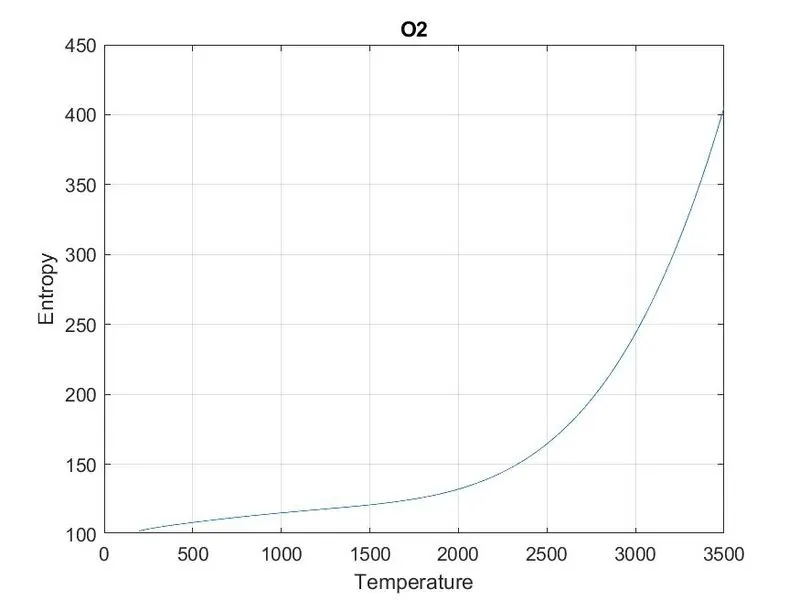
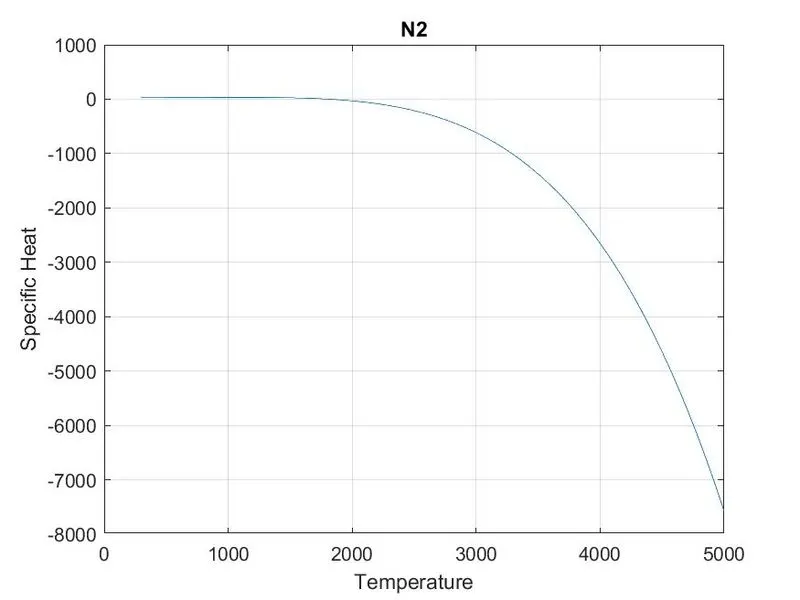
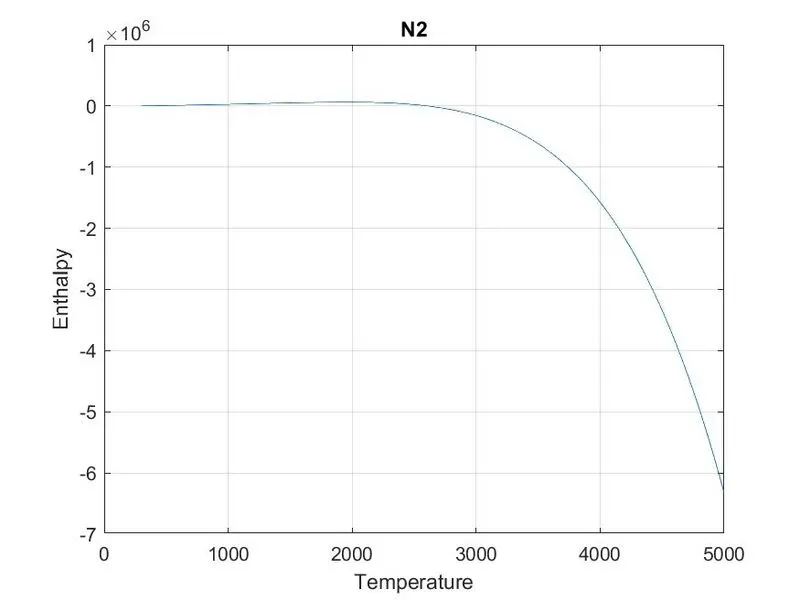
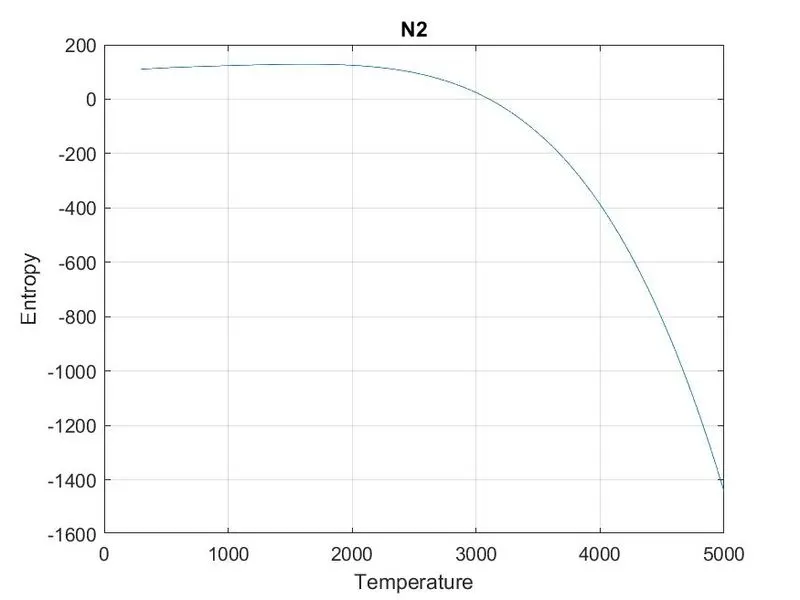
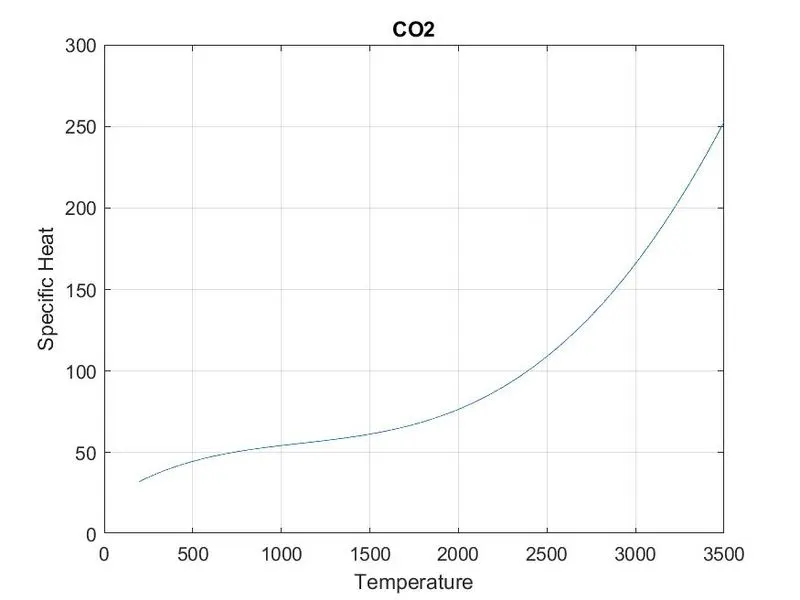
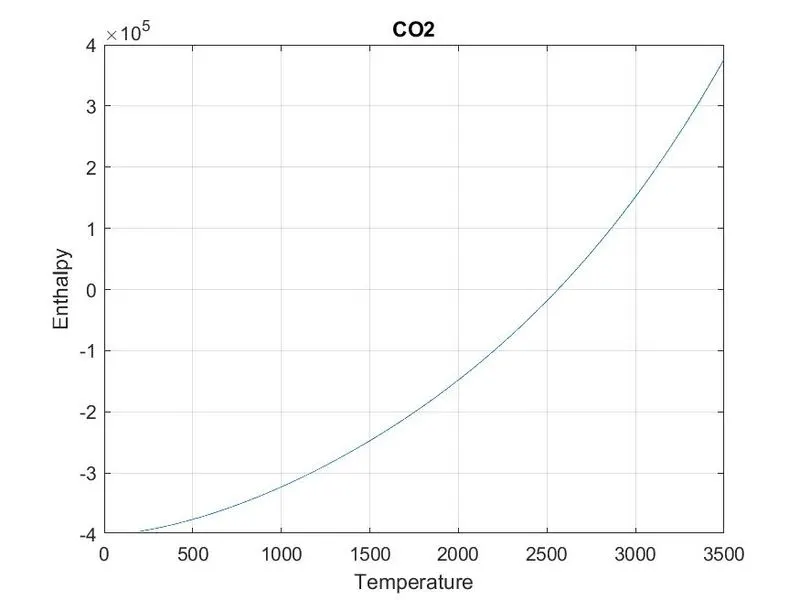
The specific heat, enthalpy, entropy function is calculated and gets plotted.
cd commant is used to change the directory.
figures are saved.
molecular weight is taken as zero.
loop command is used to see detect if there are more tha one species in the variable species_name and respective values of gas species are found out.
strcmp command is used to compare two strings.
species_name which is now a number greated than 1,molecular mass is again calculated having the atomic mass for the current species n-1.
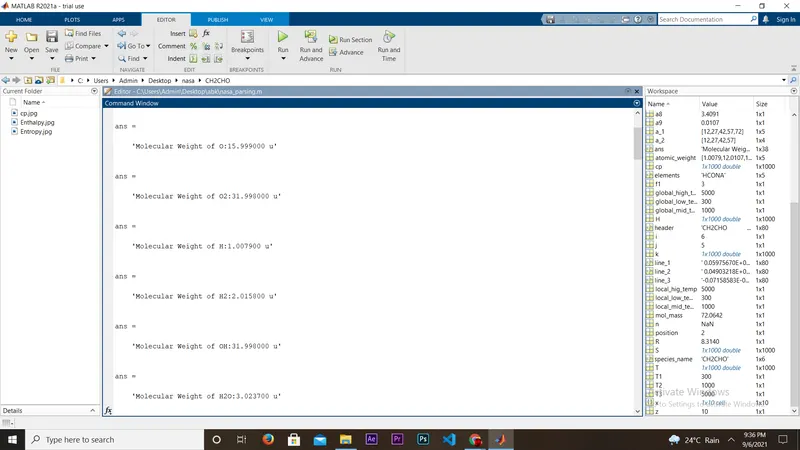
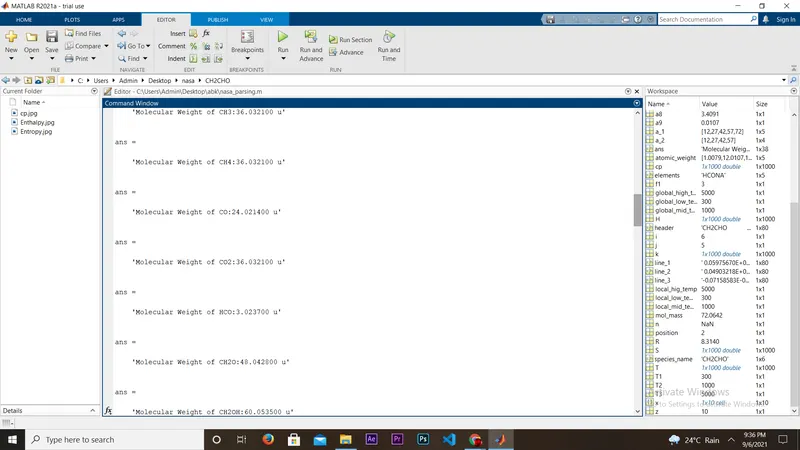
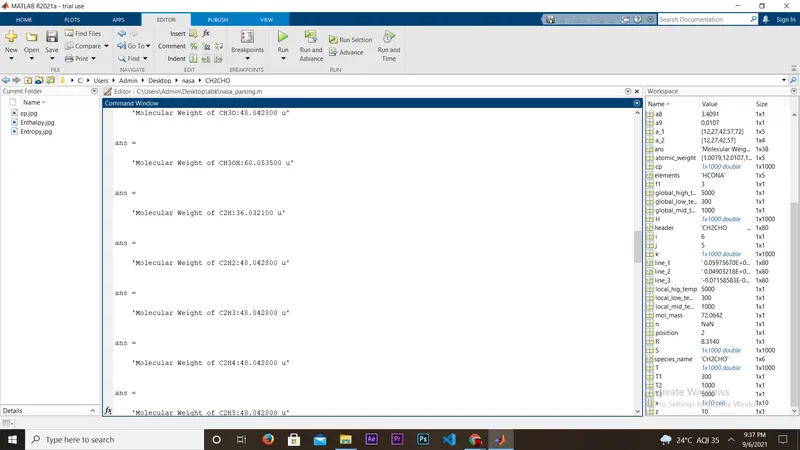
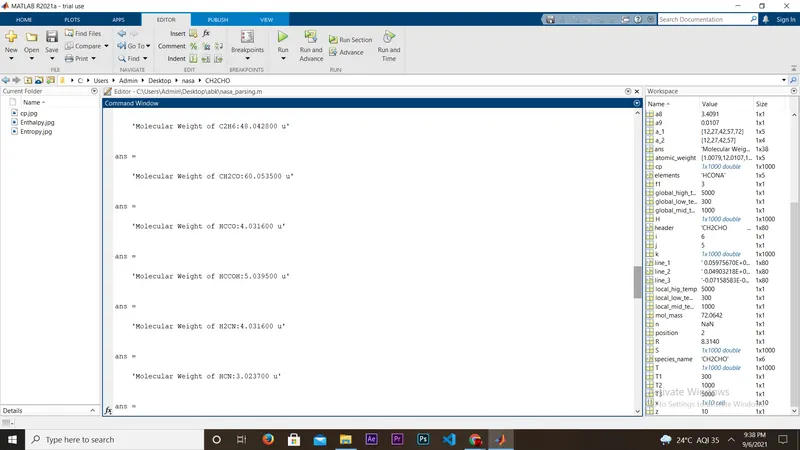
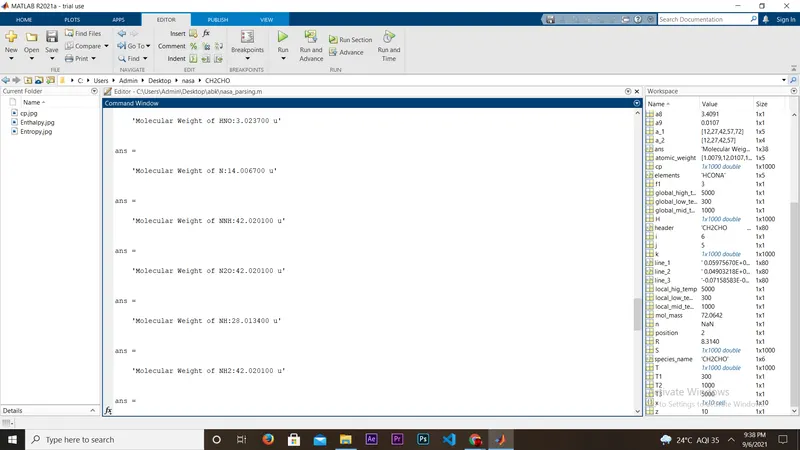
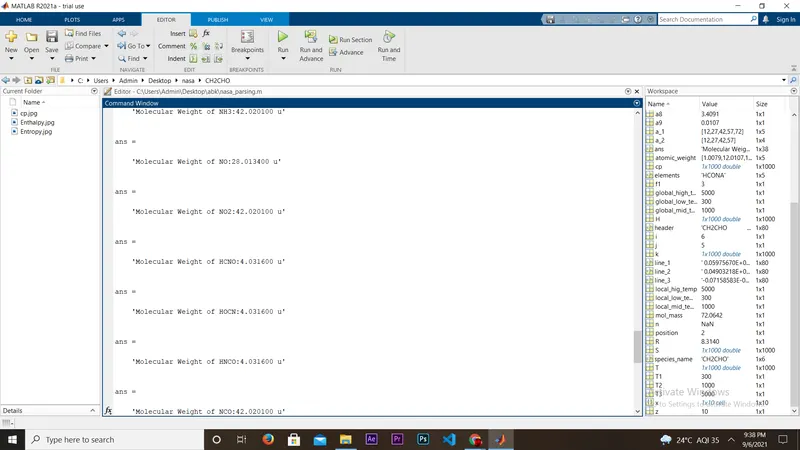
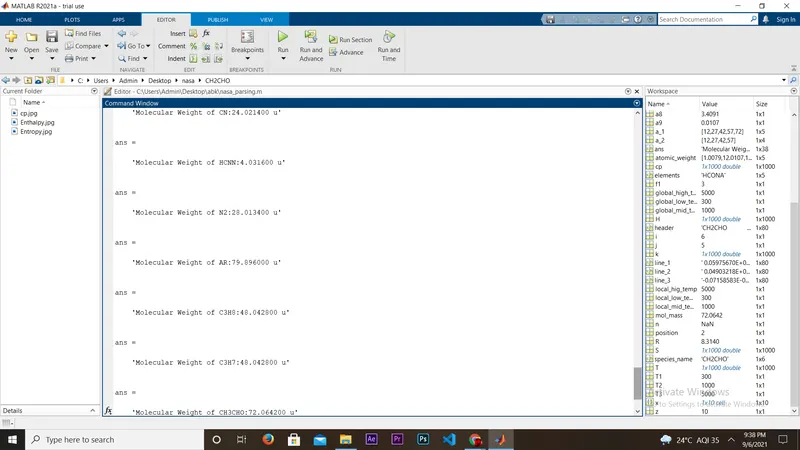
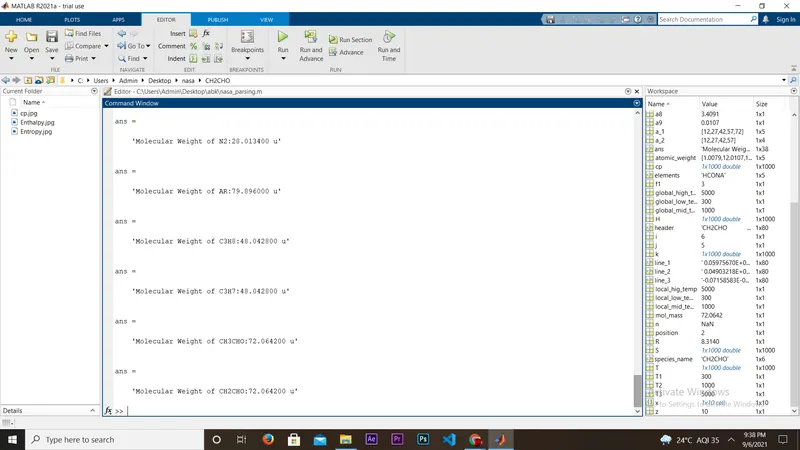
The molecular weight is calculated and displayedin the command window.
clear all
close all
clc

% reading data file
f1 = fopen('THERMO.dat','r')
fgetl(f1)
A=fgetl(f1);
A=strsplit(A,' ');
global_low_temp=str2num(A{2});
global_mid_temp=str2num(A{3});
global_high_temp=str2num(A{4});

%skipping next three lines
for i=1:3
    fgetl(f1);
end

%reading species
for i = 1:53

    header = fgetl(f1);
    x = strsplit(header,' ');
    species_name = (x{1});
    z = length(x);

    local_low_temp = str2double(x{z-3});
    local_mid_temp = str2double(x{z-1});
    local_hig_temp = str2double(x{z-2});

    T1 = local_low_temp;
    T2 = local_mid_temp;
    T3 = local_hig_temp;

    %getting coefficients of first line
    line_1 = fgetl(f1);

    a = strfind(line_1,'E');
    a1 = str2double(line_1(1:a(1)+3));
    a2 = str2double(line_1(a(1)+4:a(2)+3));
    a3 = str2double(line_1(a(2)+4:a(3)+3));
    a4 = str2double(line_1(a(3)+4:a(4)+3));
    a5 = str2double(line_1(a(4)+4:a(5)+3));

    %getting coefficients of second line
    line_2 = fgetl(f1);
    a_1 = strfind(line_2,'E');
    a6 = str2double(line_2(1:a_1(1)+3));
    a7 = str2double(line_2(a(1)+4:a(2)+3));
    a8 = str2double(line_2(a(2)+4:a(3)+3));
    a9 = str2double(line_2(a(3)+4:a(4)+3));
    a10 = str2double(line_2(a(4)+4:a(5)+3));

    %getting coeffiecients of third line
    line_3 = fgetl(f1);
    a_2 = strfind(line_3,'E');
    a11 = str2double(line_3(1:a_2(1)+3));
    a12 = str2double(line_3(a(1)+4:a(2)+3));
    a13 = str2double(line_3(a(2)+4:a(3)+3));
    a14 = str2double(line_3(a(3)+4:a(4)+4));

    T =linspace(T1,T3,1000);
    R=8.314;
    %to get array of specific heat, enthalpy and entropy
    k = 1:length(T);

    %location to be stored
    mkdir(['C:\Users\Admin\Desktop\nasa\',species_name])

    % comparing the species  temperature to assign the coeffeceints
    %a1-a7 (high temperature coeffeceints), a8-a14(low temperature coeffecients)
    if T(k)>T2

        %high temperature coeffeceints
        cp = (a1 + a2.*T + a3.*T.^2 + a4.*T.^3 + a5.*T.^4).*R;
        H = (a1 + a2.*T + a3.*T.^2/3 + a4.*T.^3/4 + a5.*T.^4/5 + a6/T).*R.*T;
        S = (a1 + log(T) + a2.*T +a3.*T.^2/2 + a4.*T.^3/3 + a5.*T.^4/4+a7).*R;

    else

        %low temperature coeffecients
        cp = (a8 + a9.*T + a10.*T.^2 + a11.*T.^3 + a12.*T.^4).*R;
        H = (a8 + a9.*T + a10.*T.^2./3 + a11.*T.^3./4 + a12.*T.^4./5 + a13./T).*R.*T;
        S = (a8 + log(T) + a9.*T +a10.*T.^2/2 + a11.*T.^3/3 + a12.*T.^4/4+ a14).*R;
    end

    %plotting graphs
    figure(1);
    plot(T,cp);
    grid on;
    title(species_name);
    xlabel('Temperature');
    ylabel('Specific Heat');

    figure(2);
    plot(T,H);
    grid on;
    title(species_name);
    xlabel('Temperature');
    ylabel('Enthalpy');

    figure(3);
    plot(T,S);
    grid on;
    title(species_name);
    xlabel('Temperature');
    ylabel('Entropy');

    cd(['C:\Users\Admin\Desktop\nasa\',species_name]);
    saveas(figure(1),'cp.jpg')
    saveas(figure(2),'Enthalpy.jpg')
    saveas(figure(3),'Entropy.jpg')

%molecular calculation
elements = ['H','C','O','N','A'];
atomic_weight = [1.0079 12.0107 15.999 14.0067 39.948];
mol_mass = 0;

for i = 1:length(species_name)
    for j = 1:length(atomic_weight)
        if strcmp(species_name(1),elements(j))
            mol_mass = mol_mass + atomic_weight(j);
            position = j;
        end
    end

n = str2double(species_name(1));

if n>1
    mol_mass = mol_mass + atomic_weight(position)*(j-1);

end
end

sprintf('Molecular Weight of %s:%f u',species_name,mol_mass)


end
RESULT:
PLOT:
O2:
N2:
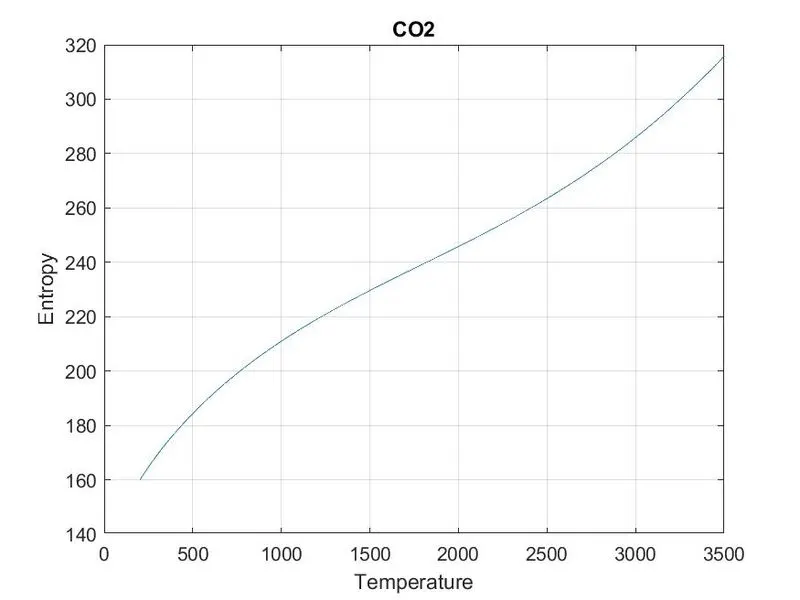
CO2:
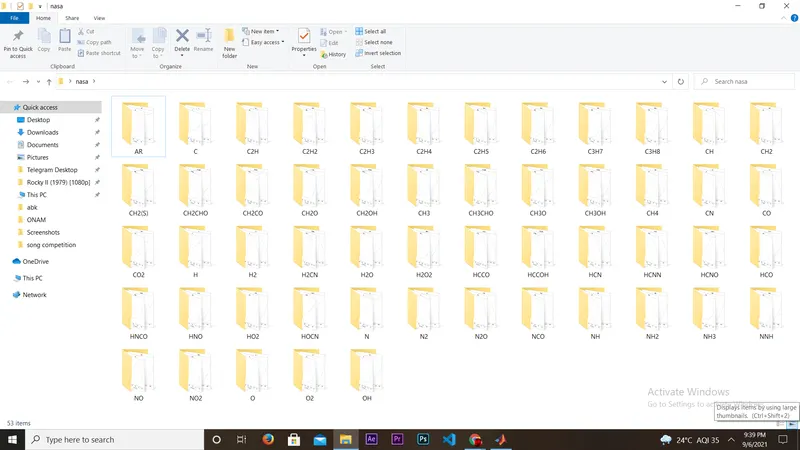
Folders Containing All Species Name:
Molecular Weight Of All Species In Command Window:
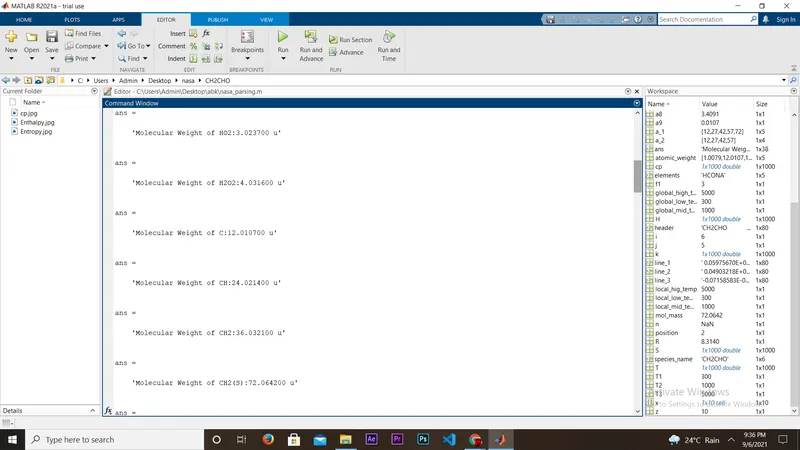
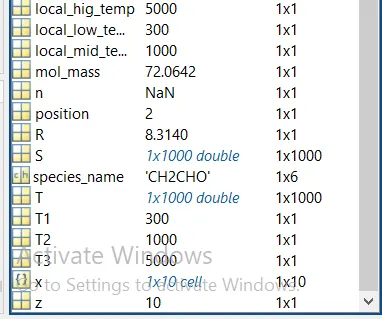
WORKSPACE:
ERRORS OCCURED:
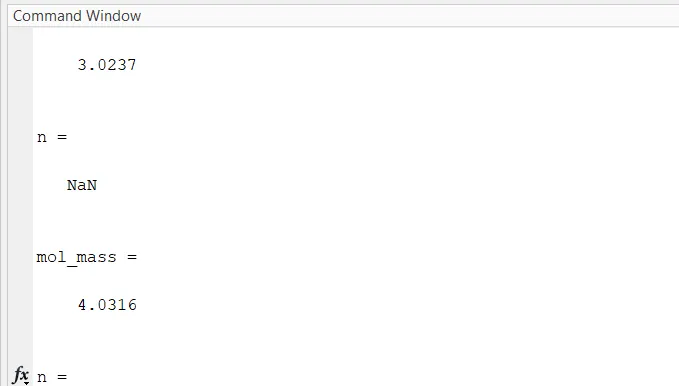
Did not put semicolon at some lines.