Week 3 - Solving second order ODEs
Aim : To create the Pendulum animation using MATLAB.
Objective : To solve the differential equation using ode45 command and plot the animation.
- b = damping = 0.05
- m = mass of ball = 1 kg
- L = length of the pendulum = 1m
- g = acceleration due to gravity = 9.81 m/sec^2
- initial dipslacement 0
- initial velocity = 3
- timespan = 0 to 20 in 500 steps
Main program:
I have converted second order differerential equation into two single order differential equation by taking theta = theta1 and d^2t/dt^2 = d(theta2)/dt.
now my aim is to find the solution for two single order differential function and which is easily done in matlab using ode45 command.
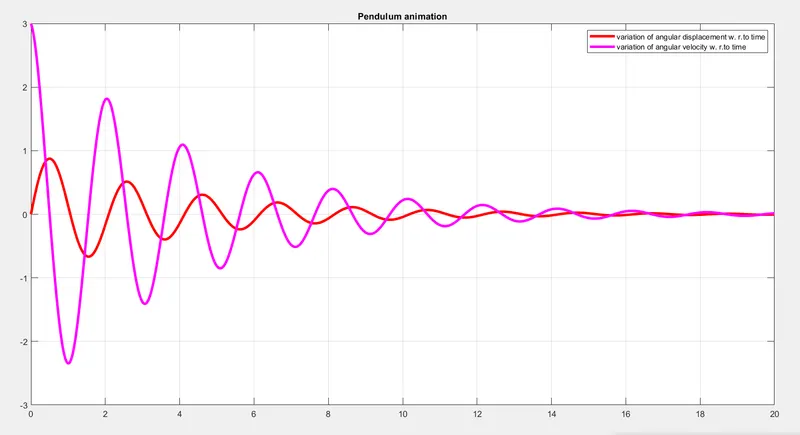
i have created one function file in matlab and inserted in ode45 command in the timpespan of 0 to 20 in 500 steps. After solving ode45 i have got different values of angular displacement and angular velocity.
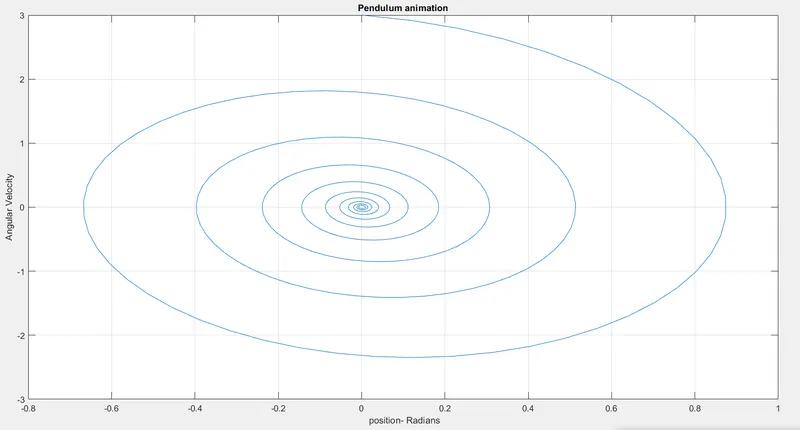
using this vlaue i have created a plot as follows
- time Vs angluar displacement
- time Vs angular velocity
- angular displacement Vs angular velocity.
Now for creating the animation i need to apply or loop and find out the angular position of pendulul as follows
x0 ,y0= 0 = initial position
x1 = L*sin(results(:,1)), y1 = L*cos(results(:,2))
using plot command i plotted the graph.
and finally made the movie using movie command
code:
%% Animation of simple pendulum using matalab
%% Submitted by Ashutosh Bangre

%%
close all;
clear all;
clc;
%% given inputs

b = 0.05;
g = 9.81
m = 0.1;
l = 1;
ct = 1;

%% initial conditions
theta = [0;3];   % 0 is the initial displacement and 3 is the initial velocity

%% time points

t_span = linspace(0,20,500)

%% solve ODE
[t, results] = ode45(@(t,theta) ode_func(t,theta,b,g,l,m),t_span, theta);

%% plotting the graph
figure(1)
plot(t,results(:,1), 'linewidth',3,'color','r')
hold on
plot(t,results(:,2),'linewidth',3,'color','m')
legend('variation of angular displacement w. r.to time','variation of angular velocity w. r.to time')
hold off
figure(2)
plot(results(:,1),results(:,2))
xlabel(' position- Radians')
ylabel('Angular Velocity')
grid on

%% Creating the animation using for loop
for i = 1:length(results(:,1))
    x0 = 0;
    y0 = 0;
    x1 = l*sin(results(i,1))
    y1 = l*cos(results(i,1))

    figure(3)
    plot([-1 1],[0 0],'linewidth',5,'color','k')
    hold on
    plot([x0 -x1],[-y0 -y1],'linewidth',3,'color','b')
    hold on
    plot(-x1,-y1,'-o','markerfacecolor','r','markersize',20)
    axis([-1.5 1.5 -1.5 1.5])
    pause(0.3)
    title('Pendulum animation')
    grid on
    hold off

    M(ct) = getframe(gcf)
    ct = ct + 1;

end

%% Creating movie

movie(M)
videofile = VideoWriter('Pendulum Animation.avi','uncompressed AVI');
open(videofile)
writeVideo(videofile,M)
close(videofile)

%% End of program  %%
Graph:
Animation Link:
https://drive.google.com/file/d/1HWYKNqOl6tIEPS0nk2IISMCfkpz4v4tB/view?usp=sharing