Project 1 - Parsing NASA thermodynamic data
Aim:
To extract data from THERMO file and plot the variation of specific heat, enthlpy and entropy with respect to temperature.
Main program:
first using fopen command i read all the data from THERMO file and then using for loop data for each species is extracted.
using plot command i plot the variation of cp, H and S w.r.to Temperature.
then i saved the plot for each species in different folder.
Code :
clear all;
close all;
clc;


f1 = fopen('THERMO.dat','r');
heading = fgetl(f1);
tline = fgetl(f1);
A = strsplit(tline, ' ');   % strsplit is use to split the string
% in demiliter i have given space because in tline space separates the
% string element i.e '300 1000 5000'
global_low_temp = str2num(A{2});
global_mid_temp = str2num(A{3});
global_high_temp = str2num(A{4});


%% comments line in THERMO file
Headerfile1 = fgetl(f1);
Headerfile2 = fgetl(f1);
Headerfile3 = fgetl(f1);


%%

for i=1:53

o   = fgetl(f1);
o_1 = fgetl(f1);
o_2 = fgetl(f1);
o_3 = fgetl(f1);
Species_name = char(o(1:7))

local_temp_low = str2num(o(45+4:52));
local_temp_high = str2num(o(52+5:61));
local_temp_med  = str2num(o(66:71));


T = linspace(local_temp_low,local_temp_high,100);


b = findstr(o_1,'E');
c = findstr(o_2,'E');
d = findstr(o_3,'E');

a1 = str2num(o_1(1:b(1)+3));
a2 =  str2num(o_1(b(1)+4:b(2)+3));
a3 =  str2num(o_1(b(2)+4:b(3)+3)) ;
a4 = str2num(o_1(b(3)+4:b(4)+3));
a5 = str2num(o_1(b(4)+4:b(5)+3));
a6 = str2num(o_2(1:c(1)+3));
a7 = str2num(o_2(c(1)+4:c(2)+3));
a8 =  str2num(o_2(c(2)+4:c(3)+3));
a9 = str2num(o_2(c(3)+4:c(4)+3));
a10 = str2num(o_2(c(4)+4:c(5)+3));
a11 =str2num(o_3(1:d(1)+3));
a12 =  str2num(o_3(d(1)+4:d(2)+3));
a13 = str2num(o_3(d(2)+4:d(3)+3));
a14 = str2num(o_3(d(3)+4:d(4)+3));

%% CAlling the fuction

Mol_Weight = molecular_weight(Species_name);
sprintf('Molecular weight of %s = %d',Species_name,Mol_Weight)


%% Calulating Cp, H, and S
R = 8.314;   % universal gas constant

if T > local_temp_med
% specific heat
c_p  = R.*(a1 + a2.*T + a3.*T.^2 + a4.*T.^3 + a5.*T.^4);
% enthalpy
H = R.*(a1 + (a2.*T/2) + (a3.*(T.^2)/3) + (a4.*(T.^3)/4) + (a5.*(T.^4)/5) + a6./T);
% entropy
S = R.*((a1.*log(T)) + (a2.*T) + (a3.*(T.^2)/2) + (a4.*(T.^3)./3) + (a5.*(T.^4)./4) + a7 );

else
    % specific heat
c_p  = R.*(a8 + a9.*T + a10.*T.^2 + a11.*T.^3 + a12.*T.^4);
% enthalpy
H = R.*(a8 + (a9.*T/2) + (a10.*(T.^2)/3) + (a11.*(T.^3)/4) + (a12.*(T.^4)/5) + a13./T);
% entropy
S = R.*((a8.*log(T)) + (a9.*T) + (a10.*(T.^2)/2) + (a11.*(T.^3)./3) + (a12.*(T.^4)./4) + a14 );
end

t=sprintf('%s',Species_name);
mkdir(t)

cd(t)
% plot
figure(1)
plot(T , c_p ,'color','r','linewidth',3)
saveas(1,'c_p.jpeg')
xlabel('Temperature')
ylabel('specific heat')
grid on

figure(2)
plot(T , H, 'color','k','linewidth',3)
saveas(2,'H.jpeg')
xlabel('Temperature')
ylabel('Enthalpy')
grid on


figure(3)
plot(T , S, 'color','m','linewidth',3)
saveas(3,'S.jpeg')
xlabel('Temperature')
ylabel('Entropy')
grid on


 cd ..

end
Function for molecular weight:
function [Mw] = molecular_weight(Species_name)

E = ['C','O','H','N','R'];
Aw = [12,16,1,14,40];
Mw = 0;

for i = 1:length(Species_name)
    for j = 1:length(E)
        if strcmp(Species_name(i), E(j));
            Mw = Mw + Aw(j);
            p = j;
        end
    end

    n = str2num(Species_name(i));
    if n >1
        Mw = Mw + Aw(p)*(n-1);
    end
end

end
Screenshot of all the graphs:

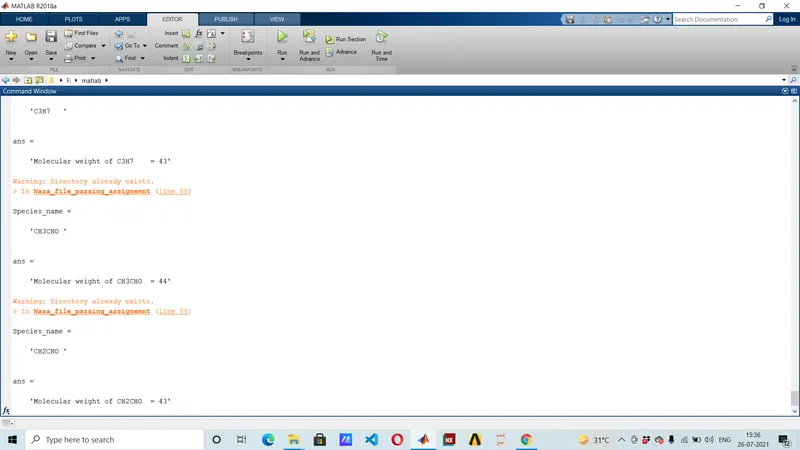
Molecular weight: