Week 3 - Solving second order ODEs
AIM
To write a program in Matlab that solves the following ODE and create an animation video file.
This ODE represents the equation of motion of a simple pendulum with damping
In the above equation,
g = gravity in m/s^2,
L = length of the pendulum in m,
m = mass of the ball in kg,
b=damping coefficient.
SIMPLE PENDULUM
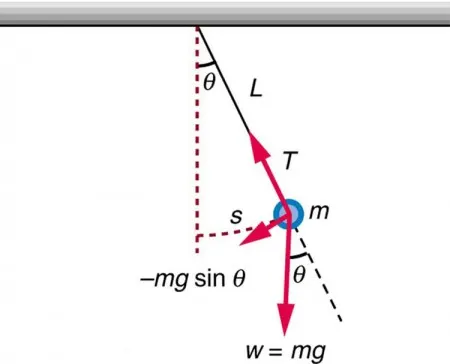
A mass m suspended by a wire of length L is a simple pendulum and undergoes simple harmonic motion. One end of the pendulum is fixed. The other end moves according to the solution of the ODE.
MATLAB PROGRAM :
1. ODE FUNCTION PROGRAM
% ode function of a simple pendulum


function [dtheta_dt] = pendulum_func(t,theta,b,g,L,m)

         theta1 = theta(1);
         theta2 = theta(2);
         dtheta1_dt = theta2;
         dtheta2_dt = (-(b/m)*theta2) -((g/L)*sin(theta1));
         dtheta_dt = [dtheta1_dt; dtheta2_dt];
end
2. PROGRAM CODE
%Program for Simple Pendulum

% Input values

 L = 1;          % Length of the string (m)
 m = 1;          % Mass of the bob (kg)
 g = 9.81;       % Acceleration due to gravity (m/s^2)
 b = 0.05;       % Damping coefficient
 k = 1;         % counter variable


% Initial condition

    dis_v = [0;3];      %angular displacement and angular velocity

    t_span = linspace(0,20,1000);       % Time


% Ode function calling

   [t,results] = ode45(@(t,theta) pendulum_func(t,theta,b,g,L,m), t_span, dis_v) ;

   %Plotting

    figure(1)
    hold on
    plot(t,results(:,1),'color','r')
    plot(t,results(:,2),'color','g')
    axis([0 20 -5 5])
    xlabel('time(s)')
    ylabel('y-axis')
    grid on
    title('variation of angular displacement and angular velocity with respect to time', 'color','b')


% assigning values of column 1 of results to angle_

    angle_ = results(:,1);

for i = 1:length(angle_);

    angle_x = angle_(i);           % angle_x keeps changing w.r.t time

%fixed position of Pendulum is x0,y0
    x0= 0;
    y0= 0;

%variable position of the pendulum

    x1 = L*sin(angle_x);
    y1 = -L*cos(angle_x);


    %plotting the pendulum
    figure(2)
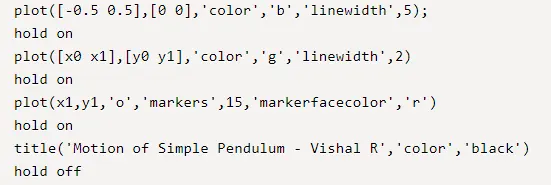
    plot([-0.5 0.5],[0 0],'color','b','linewidth',5);
    hold on
    plot([x0 x1],[y0 y1],'color','g','linewidth',2)
    hold on
    plot(x1,y1,'o','markers',15,'markerfacecolor','r')
    hold on
    title('Motion of Simple Pendulum - Vishal R','color','black')
    hold off
    grid on
    axis([-1.8 1.5 -2 0.5]);
    pause(0.002)
    M(k) = getframe(gcf);
    k=k+1;
end

movie(M)
videofile = VideoWriter('pendulum.avi','Uncompressed avi');
open(videofile)
writeVideo(videofile,M)
close(videofile)
CODE EXPLANATION:-
In order to solve this, firstly the 2nd order ODE is converted into first order which can then be used in the function.
Then, in program code. Starting with a comment - program for a simple pendulum.
Giving Input values
L = 1; Length of the string (m)
m = 1; Mass of the bob (kg)
g = 9.81; Acceleration due to gravity (m/s^2)
b = 0.05; Damping coefficient
k = 1; counter variable
Initial condition
dis_v = [0;3]; giving angular displacement =0 and angular velocity = 3
t_span = linspace(0,20,1000); Time . [linspace(x1,x2, n) generates n points between the x1 and x2 points with equal spacing. ]
then,
calling the Ode function(pendulum_func) for solving the Second order ode
[t,results] = ode45(@(t,theta) pendulum_func(t,theta,b,g,L,m), t_span, dis_v) ;
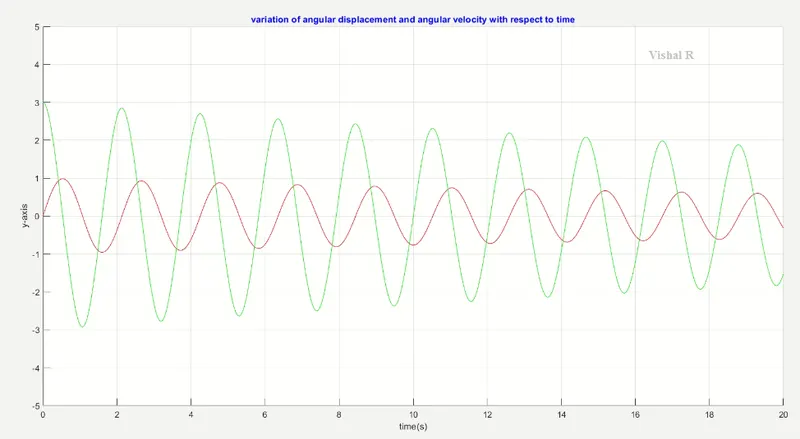
GRAPH 1
Plotting the variation of angular displacement and angular velocity with respect to time.
x-label = time(s)
y-label = y-axis
The red color line gives the variation of angular displacement with time.
The green color line gives the variation of angular velocity with time.
To create an animation video for the simple pendulum motion.
Assigning values of column 1 of results to angle_
angle_ = results(:,1);
Using For loop for repeating the output for the length of angle_
for i = 1:length(angle_);
angle_x = angle_(i); angle_x keeps changing w.r.t time
giving initial values for stationary position of the string.
x0= 0;
y0= 0;
calculating the variable position of the string by
x1 = L*sin(angle_x);
y1 = -L*cos(angle_x);
PLOTTING:-
plotting the pendulum motion
Then collecting the different frames and combining them as Video file.
ERRORS FACED AND RESOLVED:-
Got an error in Video. The frames were overlapping. Then used hold on for resolving the error.
OUTPUT :
figure1:
Video:-
The motion of Simple Pendulum
https://www.youtube.com/watch?v=b6waMJ4AbvM
Thanks,
Vishal R