Project 1 - Parsing NASA thermodynamic data
AIM:
1. To write a function that extracts the 14 coefficients and calculates the enthalpy, entropy, and specific heats for all the species in the data file.
2. Calculate the molecular weight of each species.
3. Plot the Cp, Enthalpy, and Entropy for the local temperature range (low temperature: high temperature) specific for each species.
4. Save the plots as images with appropriate names and dump them in separate folders for each species with a suitable name.
Given: The formula for calculation(high-temperature range)
The FIRST 7 coefficients (a1 to a7)are HIGH-temperature coefficients and the SECOND 7 coefficients(a8 to a14) are LOW-temperature coefficients.
MATLAB CODE
Function code:
1. To get coefficients
% getting coefficients

function [a] = get_coeff(thermo)

            i = (1:5:15); % counter

            for j = 1:3
                coeff_line = fgetl(thermo);
                find_E = strfind(coeff_line,'E');

                k = i(j);    % coefficient position
                a(k) = str2num(coeff_line(1:find_E(1)+3));
                a(k+1) = str2num(coeff_line(find_E(1)+4:find_E(2)+3));
                a(k+2) = str2num(coeff_line(find_E(2)+4:find_E(3)+3));
                a(k+3) = str2num(coeff_line(find_E(3)+4:find_E(4)+3));

                if j == 3
                    %skip
                else
                    a(k+4) = str2num(coeff_line(find_E(4)+4:find_E(5)+3));
                end
            end
end
2. To Calculate Entropy, Enthalpy, and Specific Heat
% function for calculating cp,H,S values

function [cp,H,S] = calc_cp_H_S(R,a,low_temp_range,high_temp_range,low_to_high_temp_range)


    % for lower temperature
    for i = 1 : length(low_temp_range)
        T = low_temp_range(i);
        cp(i) = R*((a(8)) + (a(9))*T+ (a(10))*(T^2) + (a(11))*(T^3) + (a(12))*(T^4));
        H(i) = (R*T)*((a(8)) + (a(9))*(T/2) + (a(10))*((T^2)/3) + (a(11))*((T^3)/4) + (a(12))*((T^4)/5) + (a(13))/T );
        S(i) = R*(((a(8))*(log(T))) + (a(9))*T + (a(10))*((T^2)/2) + (a(11))*((T^3)/3) + (a(12))*((T^4)/4) + (a(14)));
    end
    % for higher temperature values
    for i =  length(high_temp_range)+1 : length(low_to_high_temp_range)
        k = i-100;
        T = high_temp_range(k);
        cp(i) = R*((a(1)) + (a(2))*T+ (a(3))*(T^2) + (a(4))*(T^3) + (a(5))*(T^4));
        H(i) = (R*T)*((a(1)) + (a(2))*(T/2) + (a(3))*((T^2)/3) + (a(4))*((T^3)/4) + (a(5))*((T^4)/5) + (a(6))/T );
        S(i) = R*(((a(1))*(log(T))) + (a(2))*T + (a(3))*((T^2)/2) + (a(4))*((T^3)/3) + (a(5))*((T^4)/4) + (a(7)));
    end
end
3. To Calculate Element Weight
% function for Element weight

function [EW] = elements_weight(element_name)

    elements = ['H','C','O','N','A','S']; %  common element
    elements_weight = [1.00784 12.0107 15.999 14.0067 39.948 32.065]; % Atomic weight of above elements

    EW = 0 ; %initial value

    for q = 1:length(element_name)
        for j = 1:length(elements)
            if strcmp(element_name(q),elements(j))
                EW = EW + elements_weight(j);
                hold_j = j ;
            end
        end

       %if number is present
        n = str2double(element_name(q));
        if n > 1
            EW = EW + elements_weight(hold_j)*(n-1);
        else
            % skip
        end
    end
    %displaying Element weight in command window
    fprintf('Weight of element %s is %f g/mol',element_name,EW)
    fprintf('\n')
Main Code
clear variables
close all
clc


thermo = fopen('THERMO.dat','r');    % reading the file

for i = 1 :5
    intro_data = fgetl(thermo);
     %skip
end

for i = 1:53 %53 elements

    line1 = fgetl(thermo);
    split = strsplit(line1,' ');
    element_name = split{1};
    local_low_temp = str2num(split{length(split)-3});
    local_mid_temp = str2num(split{length(split)-1});
    local_high_temp = str2num(split{length(split)-2});

    low_temp_range = linspace(local_low_temp,local_mid_temp);
    high_temp_range = linspace(local_mid_temp + 1,local_high_temp);
    low_to_high_temp_range = [low_temp_range, high_temp_range];

    R= 8.314; %ideal gas constant

    %getting coeffecients
    [a] = get_coeff(thermo);

    %calulating specific heat. entalphy, entropy
    [cp,H,S] = calc_cp_H_S(R,a,low_temp_range,high_temp_range,low_to_high_temp_range);

    %element weight
   [EW]= elements_weight(element_name);


    %getting file location
       file_location = pwd;


      %changing directory
       [~,~] = mkdir(element_name);  %creating new folder
        cd (pwd + "\"+ element_name)


    %plotting
          figure(i);

     %subplots
            % plotting Specific heat vs Temperature
            subplot(1,3,1);
            plot(low_to_high_temp_range,cp);
            xlabel('Temperature (K)');
            ylabel('Specific heat[Cp] (J/mol.K)');
            title(element_name + ":- Cp vs T");

            % plotting Enthalphy vs Temperature
            subplot(1,3,2);
            plot(low_to_high_temp_range,H);
            xlabel('Temperature (K)');
            ylabel('Enthalpy [H] (J)');
            title(element_name + ":- H vs T");

            % plotting Entropy vs Temperature
            subplot(1,3,3);
            plot(low_to_high_temp_range,S);
            xlabel('Temperature (K)');
            ylabel('Entropy[S] (J/K)');
            title(element_name + ":- S vs T");


            %saving figure
            saveas(figure(i),element_name +".jpg") ;
            close(figure(i));


            %changing directory to the default location
            cd (file_location);

end

%closing the data file

fclose(thermo);
Explanation:
We need to extract data from the file and do the necessary calculation and plot the graph and save them in a specific folder in their name.
Explanation Code 1.
Function code for getting the coefficients that follow a specific structure.
firstly, function [a] = get_coeff(thermo)
inserting a counter variable (i) to get the coefficient number
using another counter (j) as the file follows a structure of three lines
fgetl(thermo) to gets the line from thermo file
finding 'E' in the line
Then getting the coefficient values for the first 2 lines
if j = 3
we skip getting the 5th coefficient because there is no such.
else we perform the function, convert them to numbers and get the coefficients.
i = (1:5:15);
for j = 1:3
coeff_line = fgetl(thermo);
find_E = strfind(coeff_line,'E');
k = i(j); % coefficient position
a(k) = str2num(coeff_line(1:find_E(1)+3));
a(k+1) = str2num(coeff_line(find_E(1)+4:find_E(2)+3));
a(k+2) = str2num(coeff_line(find_E(2)+4:find_E(3)+3));
a(k+3) = str2num(coeff_line(find_E(3)+4:find_E(4)+3));
if j == 3
%skip
else
a(k+4) = str2num(coeff_line(find_E(4)+4:find_E(5)+3));
a(1) to a(7) high-temperature coefficients
a(8) to a(14) low-temperature coefficients
Explanation Code 2.
Function code for calculating the Specific heat, Enthalpy and Entropy
function [cp,H,S] = calc_cp_H_S(R,a,low_temp_range,high_temp_range,low_to_high_temp_range)
after getting the coefficient values from function code 1, we perform calcuation of Specific heat, Enthalpy and Entropy.
we know, the formula for calculation for two temperature ranges(i.e) low to mid temperature range and mid to high temperature range.
The formula for mid to high range temperature
similarly calculating for low to the mid-temperature range.
Explanation Code 3.
Function code for calculating the Element weight
Funtion [EW] = elements_weight(element_name)
Initially, creating a vector and respective element weight for all the basic elements in the same order of the element.
elements = ['H','C','O','N','A','S']
elements_weight = [1.00784 12.0107 15.999 14.0067 39.948 32.065]
then, getting the element name from the data and comparing it with the elements. If the comparison is matched then adding the element weight. "A" is used for Argon.
strcmp(element_name(q),elements(j))
EW = elements_weight(j)
In the case of number present after the element, then converting the string to a number and multiplying previous element weight with a number less than the number(i.e) n-1
n = str2double(element_name(q));
if n > 1
EW = EW + elements_weight(j_value)*(n-1);
fprintf command is used to display the element weight value
fprintf('Weight of element %s Element is = %f g/mol',element_name,EW)
Main code:
This code reads the data file, extracts the data as required, plotting the graphs, and creating a new folder for the storage of plots.
before using this code we need to save all the function codes so that they can be used in this main code.
thermo = fopen('THERMO.dat','r') reading the thermo.dat file
skipping the first 5 introduction lines in the data file.
for i = 1:53 as 53 elements are present in the data file
using fgetl command getting the data from the file and then splitting up them as required.
line1 = fgetl(thermo)
split = strsplit(line1,' ')
after splitting, we get the required element name, local low-temperature, local mid-temperature, local high-temperature values.
Then, giving range from low temperature to mid-temperature and from mid-temperature to high temperature
R= 8.314; ideal gas constant
getting the coefficients using the function code 1 [a] = get_coeff(thermo)
calculating the Entropy(S); Enthalpy(H) and Specific Heat(Cp) using the function code 2
[cp,H,S] = calc_cp_H_S(R,a,low_temp_range,high_temp_range,low_to_high_temp_range)
then, getting the element weight using funtion code 3
[EW]= element_weight(element_name);
After this, we code for creating a folder for storing the plots that are going to be plotted in a specific folder with the element name.
starting with getting the file location then, using the mkdir command which creates a new folder, and finally changing the directory
file_location = pwd;
%changing directory
[~,~] = mkdir(element_name);
cd (pwd + "\"+ element_name)
Plotting
Then creating plots for Specific heat [Cp]vs Temperature[T]; Enthalpy[H] vs Temperature[T] ; and Entropy[S] vs Temperature[T]
Plot for Specific heat [Cp]vs Temperature[T]
subplot(1,3,1);
plot(low_to_high_temp_range,cp);
xlabel('Temperature (K)');
ylabel('Specific heat[Cp] (J/mol.K)');
title(element_name + ":- Cp vs T");
similarly, plotting for Enthalpy[H] vs Temperature[T] and Entropy[S] vs Temperature[T].
then, saving figure with the element name and type of file as jpg
saveas(figure(i),element_name +".jpg") ;
close(figure(i));
again getting the back the to the orginal directory (i.e) changing directory to the default location
cd (file_location);
then,closing the for loop and also closing the data file
end
fclose(thermo)
OUTPUT DISPLAY IN COMMAND WINDOW
It displays the element weight
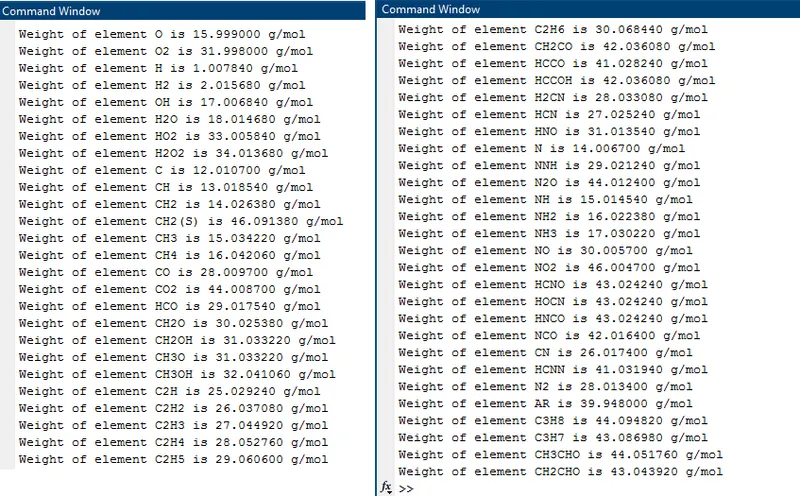
Weight of element O2 is 31.998000 g/mol
Weight of element N2 is 28.013400 g/mol
Weight of element CO2 is 44.008700 g/mol
Errors and difficulties faced
1. Faced errors and difficulty while calculating element weight when there is a compound elements line CO2, O2, H2O, etc where there are numbers present in between. Corrected it by converting the string to a number and then using the logic to calculate the element weight
n = str2double(element_name(q));
if n > 1
EW = EW + elements_weight(j_value)*(n-1);
2. output printing of the element weight was also coming in a single line; hence used newline command
fprintf('\n')

Thanks,
Vishal R