Week 3 - Solving second order ODEs
AIM
Write a program in Matlab\Octave that will simulate the pendulum motion
THEORY
In Engineering, ODE is used to describe the transient behavior of a system. A simple example is a pendulum
The way the pendulum moves depends on the Newtons second law. When this law is written down, we get a second order Ordinary Differential Equation that describes the position of the "ball" w.r.t time.
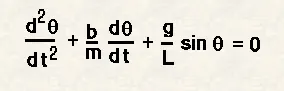
This ODE represents the equation of motion of a simple pendulum with damping.
In the above equation,
g = gravity in m/s2,
L = length of the pendulum in m,
m = mass of the ball in kg,
b=damping coefficient
Given,
L=1 metre,
m=1 kg,
b=0.05.
g=9.81 m/s2.
Function Code
function[dtheta_dt]=odefun_pendulum(t,theta,b,m,l,g);
theta_dot=zeros(2,1);
theta_dot(1)=theta(1);
theta_dot(2) = theta(2);
dtheta1_dt=theta_dot(2); %first ODE
dtheta2_dt=-(b/m)*theta_dot(2)-(g/l)*sin(theta_dot(1)); %second ODE
dtheta_dt=[dtheta1_dt;dtheta2_dt]; %combining both of ODEs into an array

end
Main code
clear all
close all
clc

%solving second order ode

b=0.05;
g=9.81;
l=1;
m=1;

%initial conditions
%t=linspace(0,20,200);
t_span=linspace(0,20,300);
theta_0=[0;3];

% [t,x]=ode45(@(t,theta)odefun_theta(t,theta,b,m,l,g),t,theta_0);
[t,x]=ode45(@(t,theta)odefun_pendulum(t,theta,b,m,l,g),t_span,theta_0);

%creating plots
figure(1)
plot(t,x(:,1))
hold on
plot(t,x(:,2))
legend('time vs displacement','time vs velocity')

%creating animation
figure(2)
ct=1;
for i=1:length(t)
    x0=0;
    y0=0;
    x1=1*sin(x(i,1));
    y1=-1*cos(x(i,1));
    plot([x0,x1],[y0,y1],'r');
    axis([-1 1 -1.5 0.5]);
    grid on
    hold on
    plot(x1,y1,'b','marker','o','markersize',40);
    M(ct)=getframe(gcf);%capture current figure using getframe command
    hold off
    ct=ct+1;%loop counter
end

movie(M);%stitching all the frames in the M array to create an animation
videofile=VideoWriter('pendulum.avi','Uncompressed AVI');
open(videofile);
writeVideo(videofile,M);
close(videofile);
Code explanation
To solve the seond order ode , we have to break the second order ode into two first order ode's.
The function dtheta_dt consist of two elements, the two first order odes are assigned to these two.Thus function code is created.
In the main code the input values and initial condtions are mentioned. The ode45 solver is used to solve the ode. From the results time vs displacement and time vs velocity graph is plotted.
the next step is creating the animation. For loop is used for creating animation. For the pendulum, the upper point is fixed and the point where the bob is attached moves. So the point (x0,y0) is fixed as mentioned in the code. For creating bob, marker command is used. The pendulum moves as the value of theta changes. Then movie is created from the obtained frames.
RESULTS
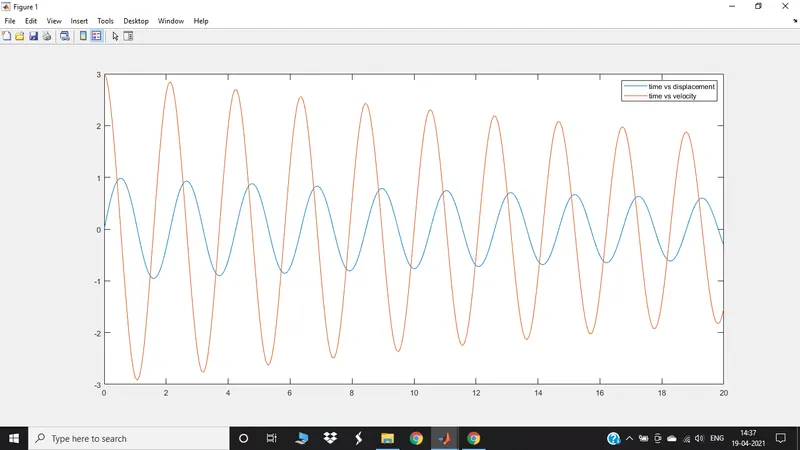
The blue curve shows time vs displacement and the red curve shows time vs velocity. The amplitude of both the curve decreases due to damping.
Click the link given below to watch the animation
https://drive.google.com/file/d/17NaTA987B2klkaxhR9SB3ICQdWGOOywG/view?usp=sharing
Errors faced while programming
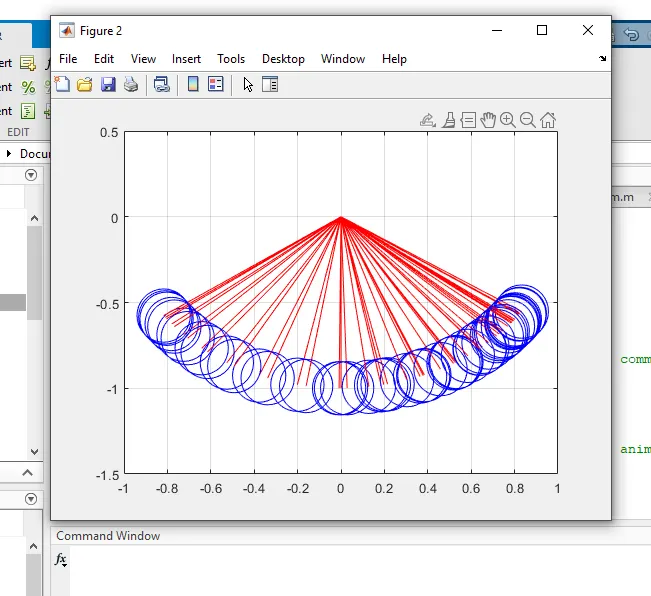
The above figure shows the animation that i got after running the program.
Hold off command was not used which resulted in the above error.