Project 1 - Parsing NASA thermodynamic data
AIM
- Write a function that extracts the 14 co-efficients and calculates the enthalpy, entropy and specific heats for all the species in the data file
- Calculate the molecular weight of each species and display it in the command window
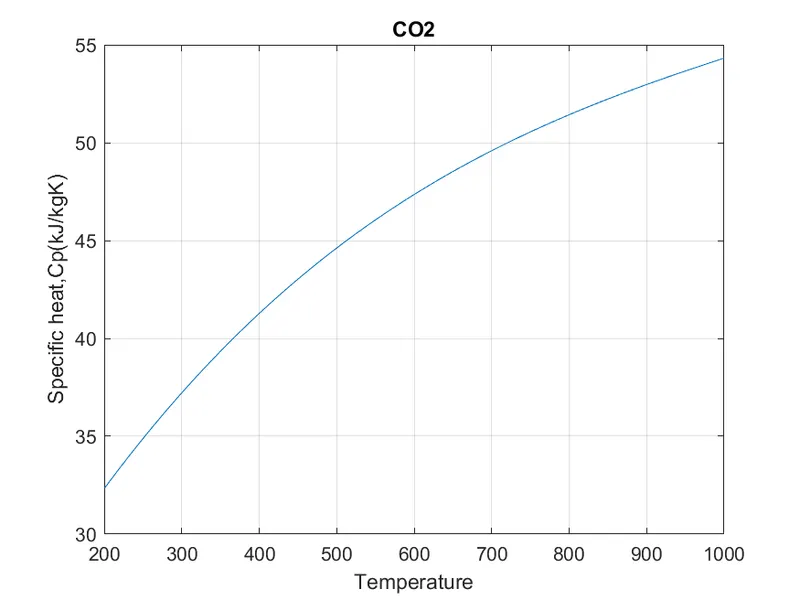
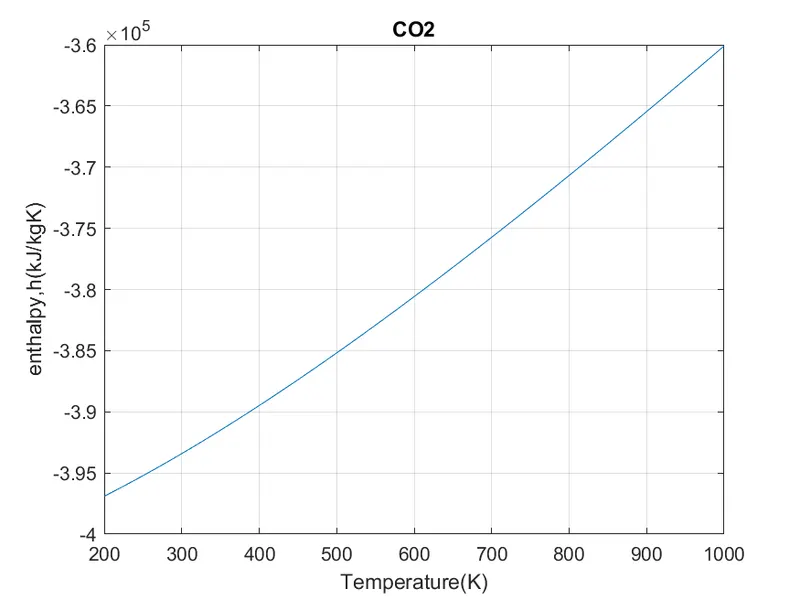
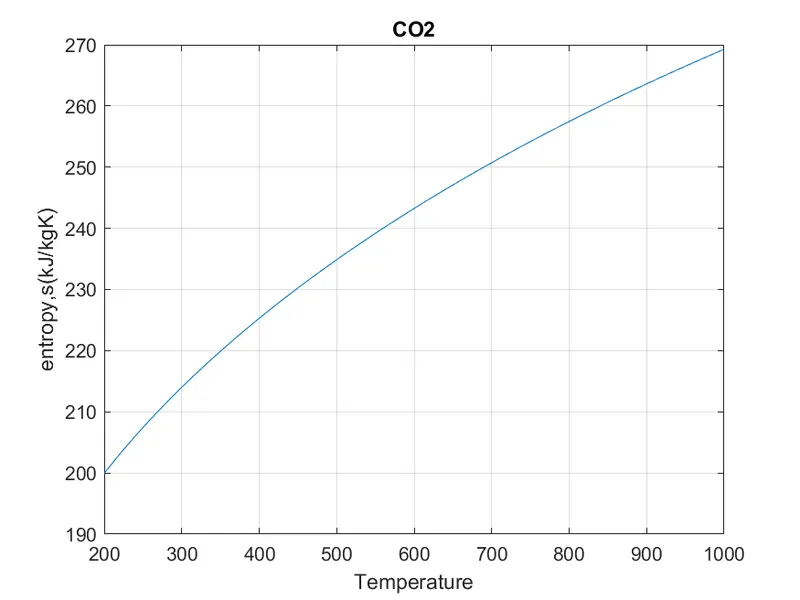
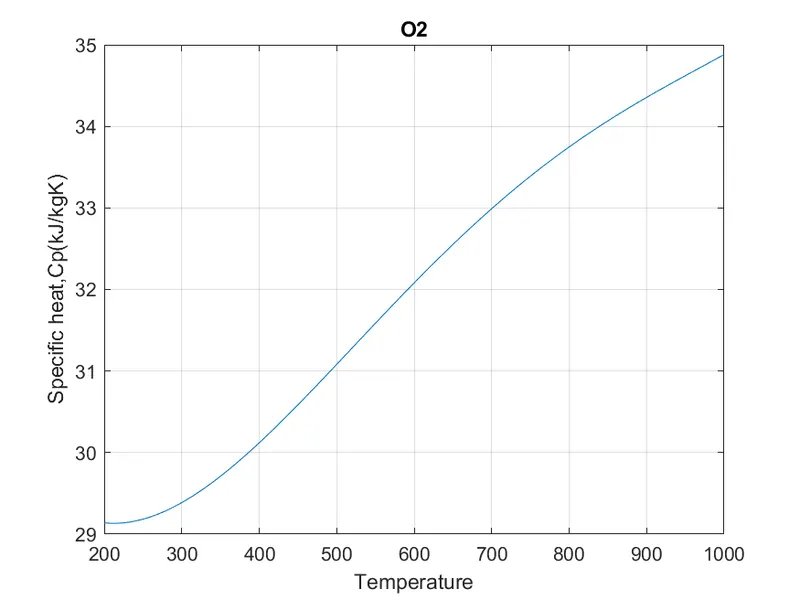
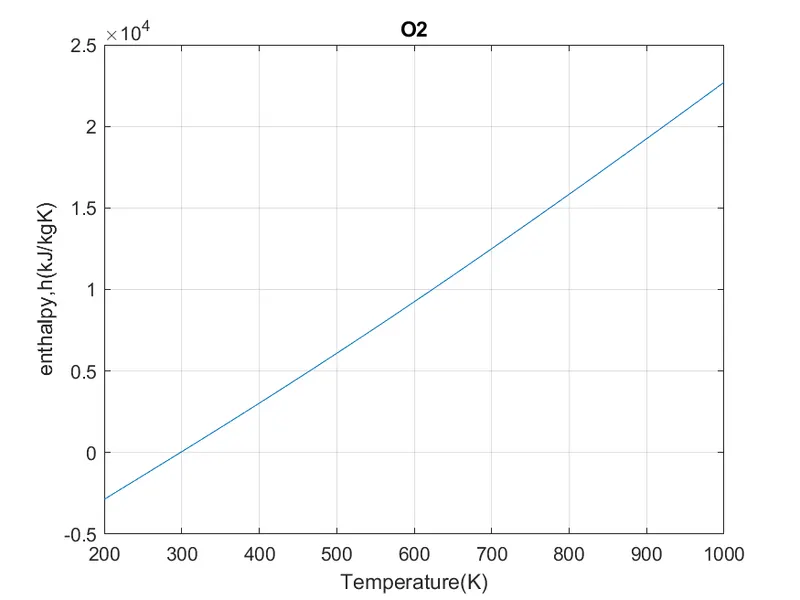
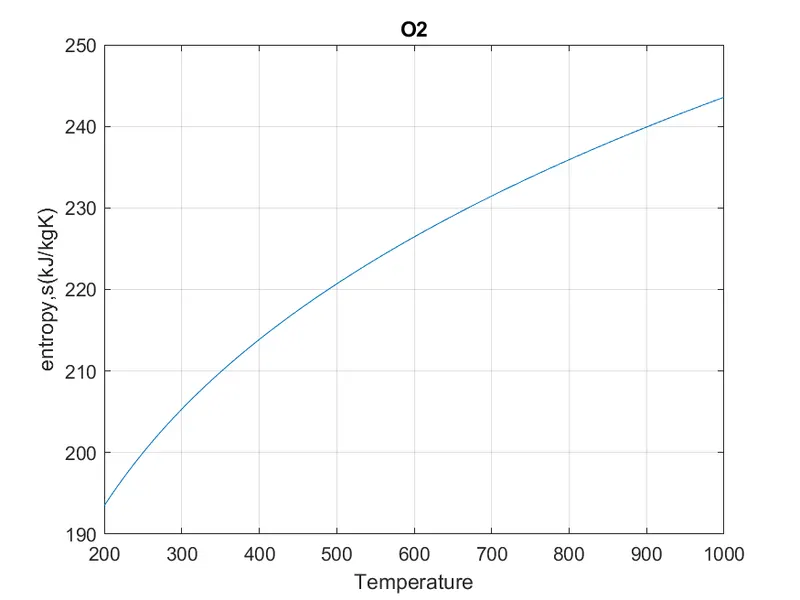
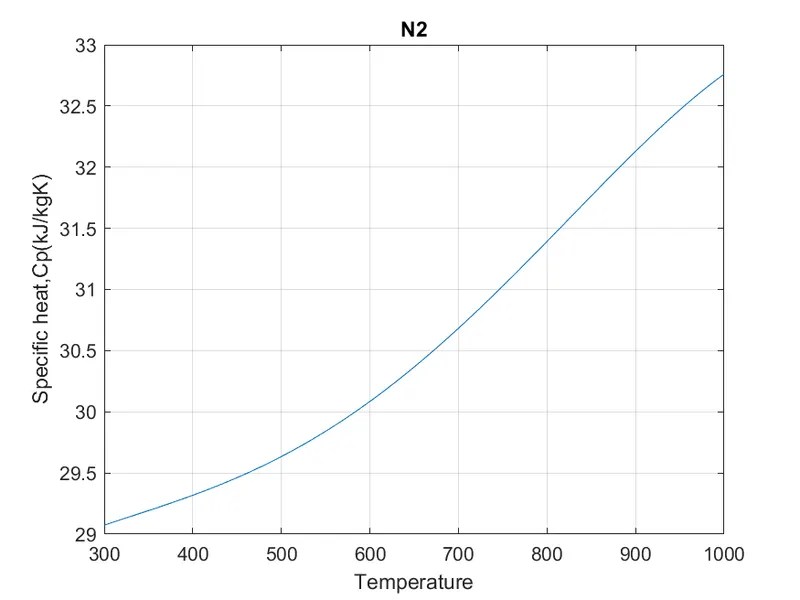
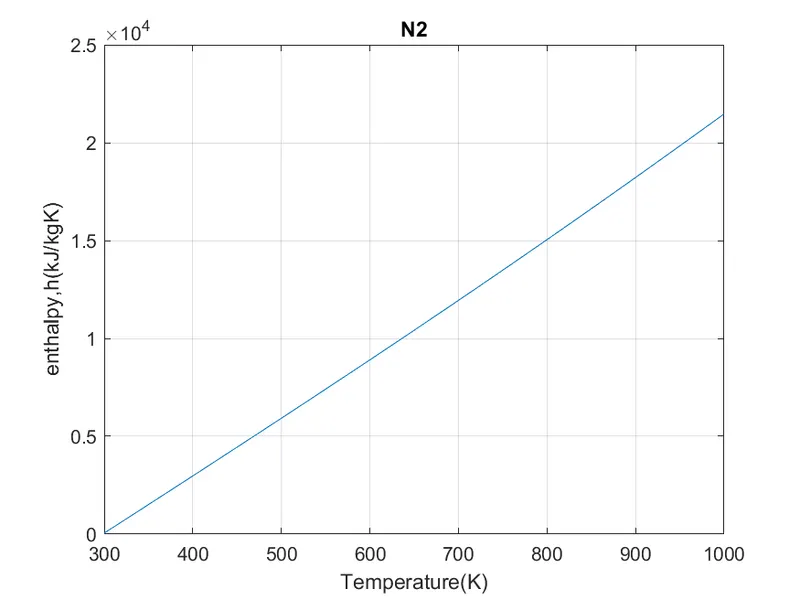
- Plot the Cp, Enthalpy and Entropy for the local temperature range (low temperature : high temperature) specific for each species
THEORY
File parsing : Parsing in computer languages refers to syntactic analysis of the input data normally from a file into its components parts in order to facilitate the writing of compilers and interpreters. It can be used to describe split or separation.
One of the most common tasks in research is analyzing data. Many computational chemistry programs output text files that include a large amount of information including text and data that you need to analyze. Often, you need to sort through the output file and identify particular pieces of information that are most important to you. In general, this is called file parsing.
NASA came up with polynomials that can be used to evaluate thermodynamic properties such as Cp, H and S. They have also documented the co-efficients that are required to evaluate these polynomials for 1000+ species.
The formula used for finding specific heat, enthalpy, entropy is given below:
where Cp = specific heat
H = enthalpy
S = entropy
R = universal gas constant
T = temperature
a1, a2, a3, a4, a5, a6, a7 are the coeffecients required to evaluate these polynomials
The programming is done in matlab.
Code:
clear all
close all
clc

%file parsing
f1 = fopen('THERMO.dat','r');
fgetl(f1);

tline=fgetl(f1);
a=strsplit(tline,' ');

%global_temperatures
global_low_temp=str2num(a{1});
global_mid_temp=str2num(a{2});
global_high_temp=str2num(a{3});

%skipping next three lines
fgetl(f1);
fgetl(f1);
fgetl(f1);

%speciesblock
for i=1:53
    %getting the first line of a species as a string
tline1=fgetl(f1);
b=strsplit(tline1,' ');
name_of_species=(b{1});
z=length(b);
local_low_temp=str2double(b{z-3}); %storing the temp values as numbers
local_mid_temp=str2double(b{z-2});
local_high_temp=str2double(b{z-1});
% c=strfind(tline1,'G');
% local_temp=tline1(c+4:length(tline1));
% d=strsplit(local_temp,' ');


%line1_co-effecients
tline2=fgetl(f1);
e=strfind(tline2,'E');

e1=tline2(1:e(1)+3);
e1=str2num(e1);  %1st co-effecient

e2=tline2(e(1)+3:e(2)+3);
e2=str2num(e2);  %2nd co-effecient

e3=tline2(e(2)+4:e(3)+3);
e3=str2num(e3);  %3rd co-effecient

e4=tline2(e(3)+4:e(4)+3);
e4=str2num(e4);  %4th co-effecient

e5=tline2(e(4)+4:e(5)+3);
e5=str2num(e5);  %5th co-effecient

%line2
tline3=fgetl(f1);
k=strfind(tline3,'E');

e6=tline3(1:k(1)+3);
e6=str2num(e6);  %6th co-effecient

e7=tline3(k(1)+4:k(2)+3);
e7=str2num(e7);  %7th co-effecient

e8=tline3(k(2)+4:k(3)+3);
e8=str2num(e8);  %8th co-effecient

e9=tline3(k(3)+4:k(4)+3);
e9=str2num(e9);  %9th co-effecient

e10=tline3(k(4)+4:k(5)+3);
e10=str2num(e10);  %10th co-effecient

%line3
tline4=fgetl(f1);
p=strfind(tline4,'E');

e11=tline4(1:p(1)+3);
e11=str2num(e11); %11th co-effecient

e12=tline4(p(1)+4:p(2)+3);
e12=str2num(e12); %12th co-effecient

e13=tline4(p(2)+4:p(3)+3);
e13=str2num(e13); %13th co-effecient

e14=tline4(p(3)+4:p(4)+3);
e14=str2num(e14); %14th co-effecient


T=linspace(local_low_temp,local_high_temp,100);

R=8.314;

mkdir(name_of_species)
cd(name_of_species)
for j=1:length(T)
    % e1-e7 ---> high temp coeff
    if T(j)>local_mid_temp  %comparison with mid temp

    Cp(j)=(e1+e2.*T(j)+e3.*T(j).^2+e4.*T(j).^3+e5.*T(j).^4)*R;     % calc of Cp, h and s
    h(j)=(e1+(e2.*T(j))/2+(e3.*T(j).^2)/3+(e4.*T(j).^3)/4+(e5.*T(j).^4)/5+(e6./T(j)))*R.*T(j);
    s(j)=(e1.*log(T(j))+e2.*T(j)+(e3.*T(j).^2)/2+(e4.*T(j).^3)/3+(e5.*T(j).^4)/4+e7)*R;

    else  % low temp coeff
        Cp(j)=(e8+e9.*T(j)+e10.*T(j).^2+e11.*T(j).^3+e12.*T(j).^4)*R;     % calc of Cp, h and s
    h(j)=(e8+(e9.*T(j))/2+(e10.*T(j).^2)/3+(e11.*T(j).^3)/4+(e12.*T(j).^4)/5+(e13./T(j)))*R.*T(j);
    s(j)=(e8.*log(T(j))+e9.*T(j)+(e10.*T(j).^2)/2+(e11.*T(j).^3)/3+(e12.*T(j).^4)/4+e14)*R;
    end

end


%plotting the 3 graphs
    figure(1)   %spc heat vs Temp
    plot(T,Cp);
    grid on
    title(name_of_species);
    ylabel('Specific heat,Cp(kJ/kgK)');
    xlabel('Temperature');
    saveas(1,'TvsCp.png')

    figure(2)
    plot(T,h);
    grid on
    title(name_of_species);
    ylabel('enthalpy,h(kJ/kgK)');  % enthalpy vs Temp
    xlabel('Temperature(K)');
    saveas(2,'Tvsh.png')

    figure(3)
    plot(T,s); %entropy vs temp
    grid on
    title(name_of_species);
    ylabel('entropy,s(kJ/kgK)');
    xlabel('Temperature');
    saveas(3,'Tvss.png')
    cd ..


    %mol wt calc
    elements=['H','C','O','N','A']; % element names for comparison
    atomic_wt=[1 12 16 14 40]; % weight assigned for each element
    mol_wt=0;
    for k=1:length(name_of_species)
        for l=1:length(elements)
            if strcmp(name_of_species(k),elements(l))
%comparison of the characters, and proceed if yes
                mol_wt=mol_wt+atomic_wt(l);
                position=l; %storing the position for reference outside loop
            end
        end


    n=str2double(name_of_species(k));
    if n>1
        mol_wt= mol_wt+atomic_wt(position)*(n-1); % adding the extra atoms' weights
    end
    end

   mol=sprintf('Molecular weight of %s: %f ',name_of_species,mol_wt)
end
  % to display all the molecular weights in cammand window
Screenshot of the window where all the folders are saved

Plots of O2
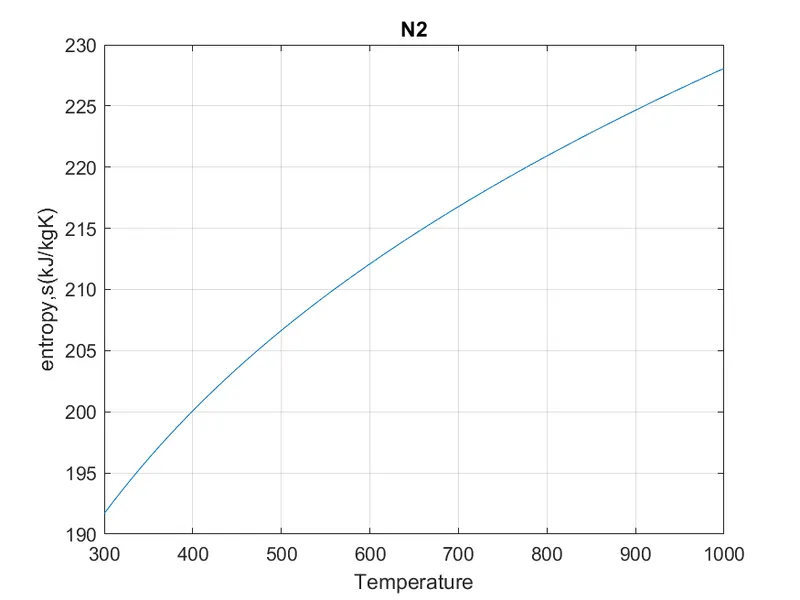
Plots for N2
Plots for CO2