Week 3 - Solving second order ODEs
Code - To solve second order differential equation using python.
#program to solve 2nd order differential equation
import math
import matplotlib.pyplot as plt
import numpy as np
from scipy.integrate import odeint
import os
import imageio.v2 as imageio
def model1(theta,t,b,g,l,m):
theta1=theta[0]
theta2=theta[1]
dtheta1_dt=theta2
dtheta2_dt=(b/m)*theta2-(g/l)*math.sin(theta1)
dtheta_dt=[dtheta1_dt,dtheta2_dt]
return dtheta_dt
#damping coefficient (b) = 0.05, length of string (l) = 1 m, mass of ball (m) = 1 kg, gravity = 9.81 m/s2
b = 0.05
l = 1
m = 1
g = 9.81
#initial conditions
theta_0 = [0,3]
#time points
t = np.linspace(0,20,150)
#solve ODE
theta = odeint(model1,theta_0,t,args=(b,g,l,m))
plt.plot(t,theta[:,0],'b-',label=r'$\frac{d\theta_1}{dt}=\theta2$')
plt.plot(t,theta[:,1],'r--',label=r'$\frac{d\theta2}{dt}=-\frac{b}{m}\theta_2-\frac{g}{l}sin\theta_1$')
plt.xlabel('Time')
plt.ylabel('Plot')
plt.legend(loc='best')
plt.show()
#Pendulam animation
count = 1
for Theta in theta[:,0]:
x0 = 0
y0 = 0
x1 = l*math.sin(Theta)
y1 = -l*math.cos(Theta)
filename = '%03d.png'%count
plt.figure()
plt.plot([x0,x1],[y0,y1],"blue",linewidth = 3)
plt.plot(x0,y0,'*', color = "black", markersize = 10)
plt.plot(x1,y1,'o', color = "red", markersize = 18)
plt.xlim([-1.5,1.5])
plt.ylim([-1.5,1.5])
plt.savefig(filename)
count = count + 1
# Create a list of filenames in sorted order
filenames = ['%03d.png' % i for i in range(1, count)]
# Create a GIF animation
with imageio.get_writer('pendulum_animation.gif', mode='I', duration=0.05) as writer:
for filename in filenames:
image = imageio.imread(filename)
writer.append_data(image)
print("Animation saved as pendulum_animation.gif")
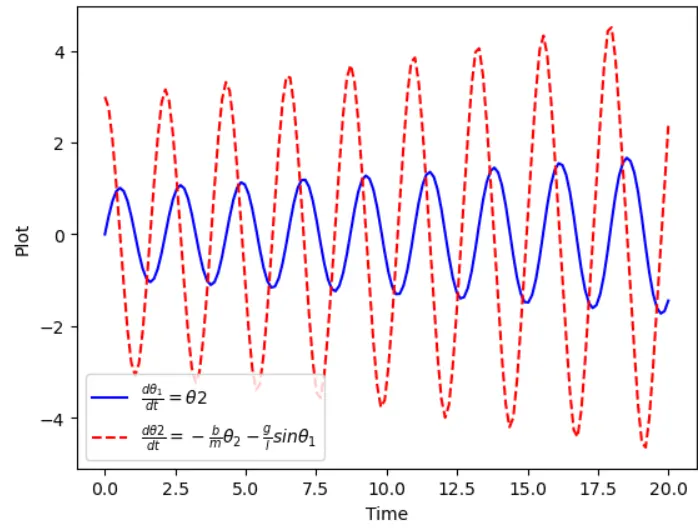
Image of oscillation in waves:
Explanation:
Importing necessary libraries:
math: Provides mathematical functions like sin() and cos().
matplotlib.pyplot: For plotting graphs and visualizing the pendulum.
numpy: Used for array handling and numerical operations.
scipy.integrate.odeint: Solves systems of ordinary differential equations (ODEs).
os: For file operations (used later for cleanup).
imageio.v2: Reads and writes image files; used to create GIF animations.
Defining function to solve 2nd order differential equation:
This function represents the system of 2 first-order differential equations derived from the second-order equation for a damped pendulum:
-
θ'' = (b/m) * θ' - (g/l) * sin(θ) -
It's rewritten as two first-order ODEs to be solved using odeint.
Later defining damping coefficient, length of string, mass of ball, gravity values, angular velocity from 0 - 3 rad/sec for 20 sec with 150 instance.
Further function is called and 2ODE is solved for given inputs as mentioned above.
All plot statements plots angular velocity over a period of time in which
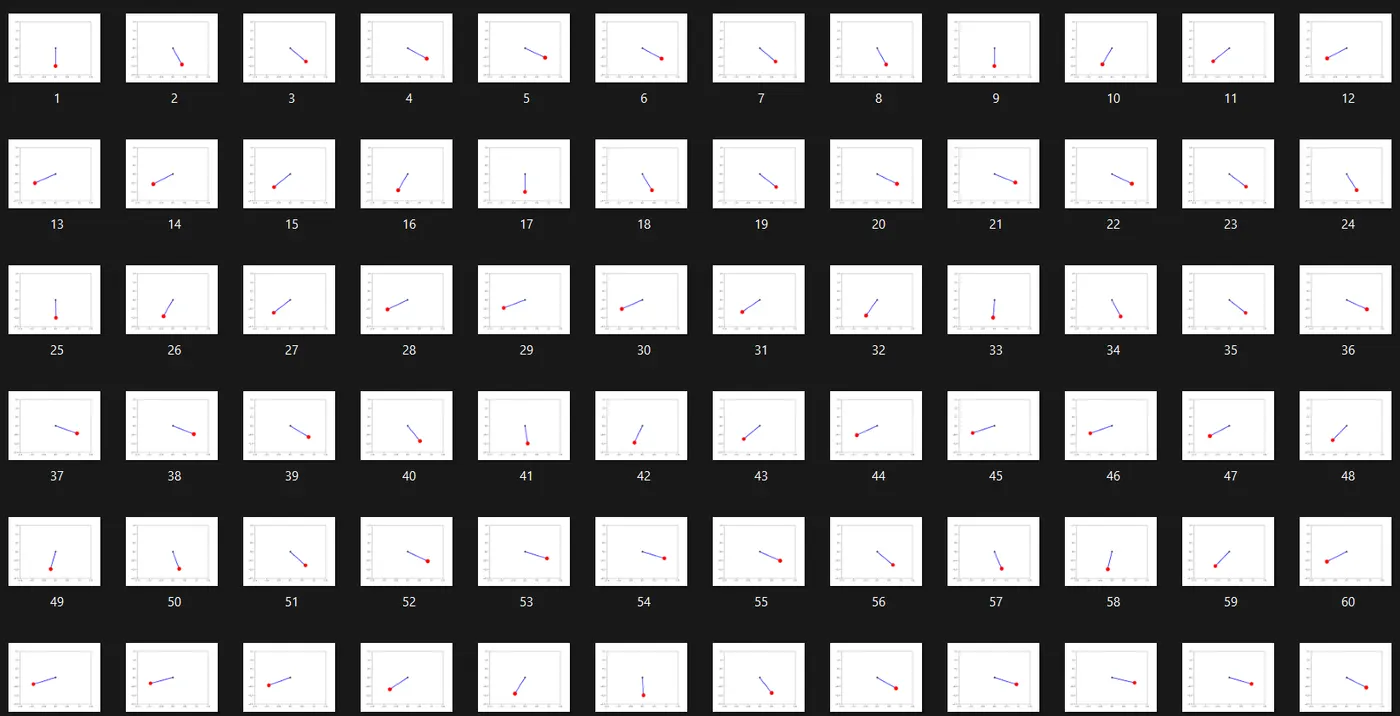
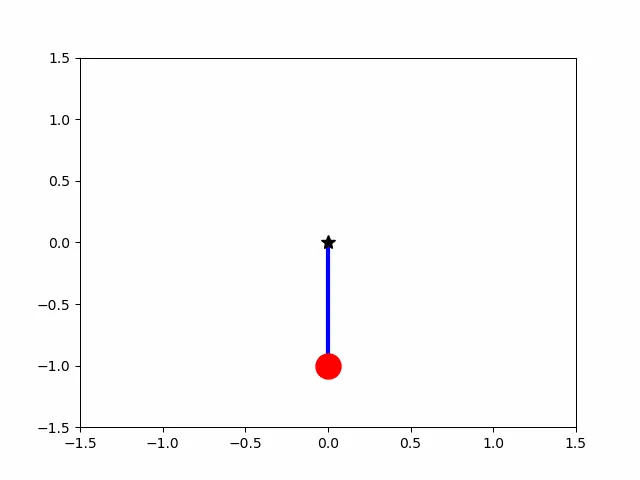
To create animation of pendulum variable "count" with initial value 1 is defined, then for each value of angle pendulum second end (x1, y1) position is computed as first end (x0, y0) remains fixed.
Declaring variable "filename" to give name with max 3 digit with ".png" extension to each image created for different position of pendulum.
Further
plt.figure() - to create fresh image for each position
plt.plot([x0,x1],[y0,y1],"blue",linewidth = 3) - plots string position with line color as blue and its width.
plt.plot(x0,y0,'*', color = "black", markersize = 10) - "*" shape defined for fixed end with black color and size 10.
plt.plot(x1,y1,'o', color = "red", markersize = 18) - "o" shape defined for rotating end with red color and size 18.
plt.xlim([-1.5,1.5]) - limits of graph
plt.ylim([-1.5,1.5])
plt.savefig(filename) - saving each image
count = count + 1 - increasing count after each image is created.
Now sorting/arranging images from 1 to 150 and with
imageio.get.writer - creates a writer object for saving the animation to a file (pendulum_animation.gif).
mode = I - means you are creating a multi-image (animated) files
duration = 0.05 - specifies the time between each frame in seconds (i.e., 20 frames per second).
imageio.imread(filename) - reads each saved .png image.
writer.append_data(image) - adds each image as a frame in the final GIF.
In the end just printing statement to notify animation has been saved.
Animation: attached gif file.
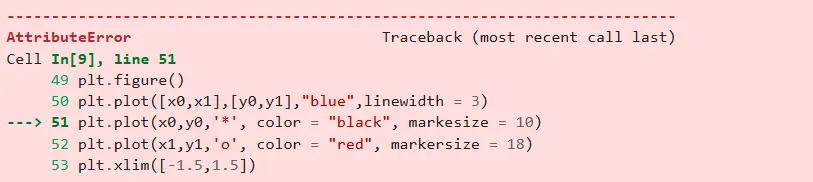
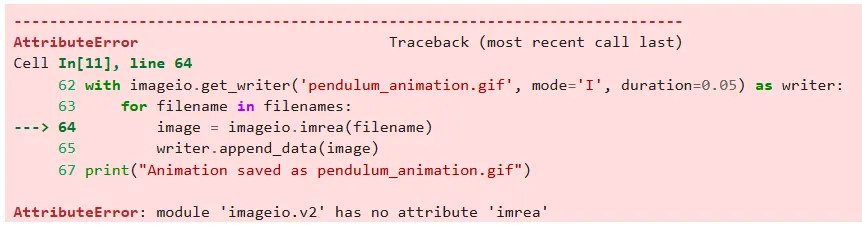
Errors occurred:
Mostly it were typing error which were corrected after reading error prompts.