Project 1 - Parsing NASA thermodynamic data
Matlab code to read data from file THERMO.dat and find molecular weight of each species and ploting enthalpy, entropy, specific heat vs temperature for each species.
1) Matlab code
clear all
close all
clc

%reading data from given file
f1 = fopen('Thermo.dat','r');
fgetl(f1)

%reading the header line
tline = fgetl(f1);
A = strsplit(tline,' ');
global_low_temp = str2num(A{2});
global_mid_temp = str2num(A{3});
global_high_temp = str2num(A{4});

%skipping next 3 lines
for i=1:3
    fgetl(f1);
end

%reading the species data
for i=1:53

    header=fgetl(f1);
    x=strsplit(header,' ');

    species_name=(x{1});
    z=length(x);

    %reading low, mid, high temperatures from given file
    local_low_temp=str2double(x{z-3});
    local_high_temp=str2double(x{z-2});
    local_mid_temp=str2double(x{z-1});

    %assigning these temperature to t1, t2, t3 for simplicity
    t1=local_low_temp;
    t2=local_mid_temp;
    t3=local_high_temp;

      %reading first line of coefficients
      line_1=fgetl(f1);

      a=strfind(line_1,'E');
      a1=str2double(line_1(1:a(1)+3));
      a2=str2double(line_1(a(1)+4:a(2)+3));
      a3=str2double(line_1(a(2)+4:a(3)+3));
      a4=str2double(line_1(a(3)+4:a(4)+3));
      a5=str2double(line_1(a(4)+4:a(5)+3));

      %reading second line of coefficient
      line_2=fgetl(f1);

      a_1=strfind(line_2,'E');
      a6=str2num(line_2(1:a_1(1)+3));
      a7=str2double(line_2(a_1(1)+4:a_1(2)+3));
      a8=str2double(line_2(a_1(2)+4:a_1(3)+3));
      a9=str2double(line_2(a_1(3)+4:a_1(4)+3));
      a10=str2double(line_2(a_1(4)+4:a_1(5)+3));

      %reading third line of coefficient
      line_3=fgetl(f1);

      a_2=strfind(line_3,'E');
      a11=str2double(line_3(1:a_2(1)+3));
      a12=str2double(line_3(a_2(1)+4:a_1(2)+3));
      a13=str2double(line_3(a_2(2)+4:a_1(3)+3));
      a14=str2double(line_3(a_2(3)+4:a_1(4)+3));

      %creating folder
      mkdir(['D:\Users\Basit\Desktop\NASA\images\',species_name]);

      T=linspace(t1,t3,100);
      R= 8.314;

      %to get Cp,H,E
      for k=1:length(T)
          if T(k)>t2

        %high temperature coefficients
        Cp= (a1 + a2.*T + a3.*T.^2 + a4.*T.^3 +a5.*T.^4).*R;
        H= (a1 + (a2.*T)./2 + (a3.*T.^2)./3 + (a4.*T.^3)./4 +( a5.*T.^4)./5+ (a6./T)).*T.*R;
        S= (a1.*log(T) + (a2.*T) + (a3.*T.^2)./2 + (a4.*T.^3)./3 +( a5.*T.^4)./4+ a7).*R;

    else
        %low temperature coefficients
        Cp= (a8 + a9.*T + a10.*T.^2 + a11.*T.^3 +a12.*T.^4).*R;
        H= (a8 + (a9.*T)./2 + (a10.*T.^2)./3 + (a11.*T.^3)./4 +( a12.*T.^4)./5+ (a13./T)).*T.*R;
        S= (a8.*log(T) + (a9.*T) + (a10.*T.^2)./2 + (a11.*T.^3)./3 +( a12.*T.^4)./4+ a14).*R;

          end
      end

      %ploting
      color = [rand rand rand]
      figure(1)
      plot(T,Cp,'color',color);
      title(species_name)
      xlabel('Temperature')
      ylabel('Specific heat')

      figure(2)
      plot(T,H,'color',color);
      title(species_name)
      xlabel('Temperature')
      ylabel('Enthalpy')

      figure(3)
      plot(T,S,'color',color);
      title(species_name)
      xlabel('Temperature')
      ylabel('Entropy')

      %changing the directory and saving file
      save = (['D:\Users\Basit\Desktop\NASA\images\',species_name]);
      cd(save)

      saveas(1,'specific heat','jpg')
      saveas(2,'enthalpy','jpg')
      saveas(3,'entropy','jpg')

      %molecular weight calculation

      elements = ['H','C','O','N','A','S'];
      atomic_wt = [1.00794 12.0107 15.999 14.0067 39.948 32.065];

      molecular_wt_calculation = 0;

  for l=1:length(species_name)
    for m=1:length(elements)
        if strcmp(species_name(l),elements(m))
            molecular_wt_calculation = molecular_wt_calculation + atomic_wt(m);
            a=m;
        end
    end

    n= str2num(species_name(l));
    if n>3
        molecular_wt_calculation = molecular_wt_calculation(a)*(n-1);
    end
  end
  sprintf('Molecular weight of %s:%f u',species_name,molecular_wt_calculation)
end
fclose(f1)
2) Step wise explanation of code.
- Starting with basic comments close all, clear all, clc, using "fopen()" to open "THERMO.dat" file from the directory next "fgetl()" reads first line from the file.
- To read header line in which three temperatures low medium and high "tline()" is used which is in string form, to separate it "strsplit()" is used and assigned to respective variables.
- There are three comment lines which are skipped/ just read by using "for" loop.
- To read species data form file again in "for" loop, from 1 to 53 row "fgetl()" assigned to variable "header" is used to separate string"strsplit()" and assigned to variable "x". Each "x" value i.e. species name is saved in variable "species_name". Now for each species its low, mid, high temperature is taken by "str2double({})" and assigned to respective variables. Further to keep code simple these values are assigned to t1, t2, t3 respectively.
- Now for each lines below first finding "E" by "strfind()" is used further keeping it as a datum point other coefficients are extracted by "str2double()" and assigned to respectively variable from a1 to a14.
- Creating a folder in which all plots will be saved by using "mkdir()".
- Next "T" having 100 values between t1 and t3, gas constant (R).
- To calculate Cp, H, S for each value of T writing formulas given in question.
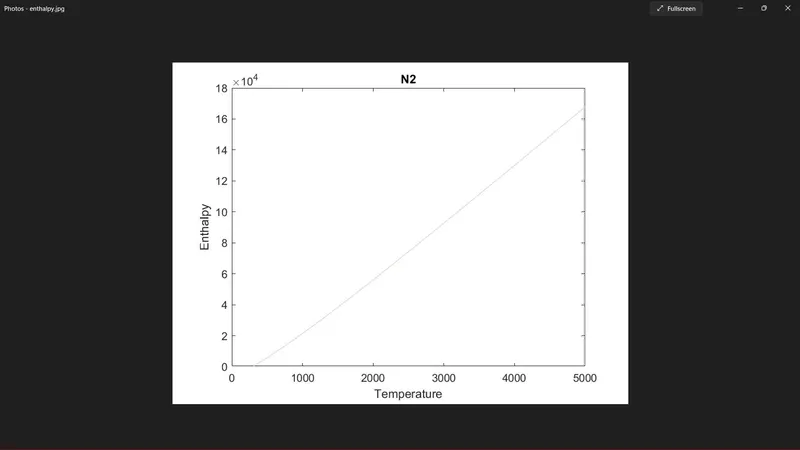
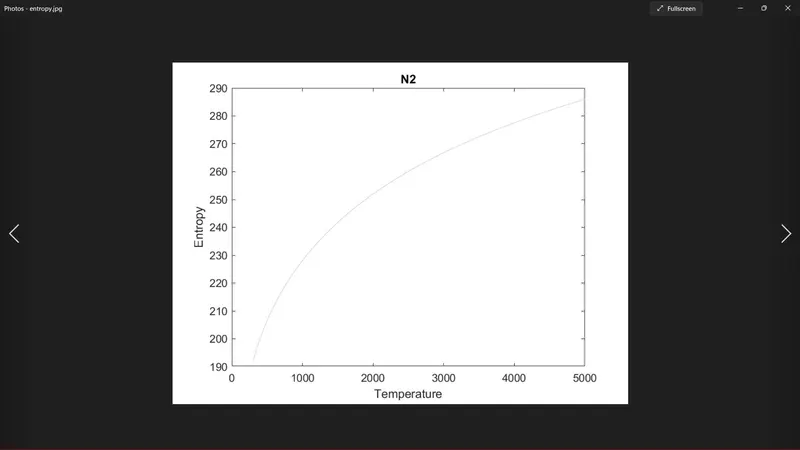
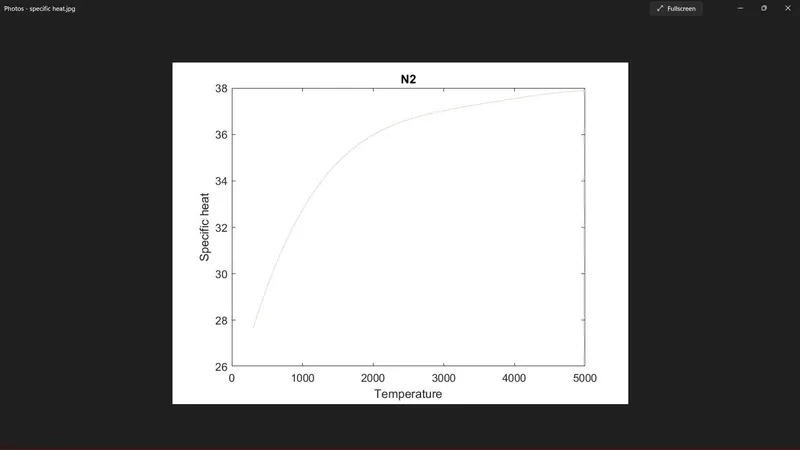
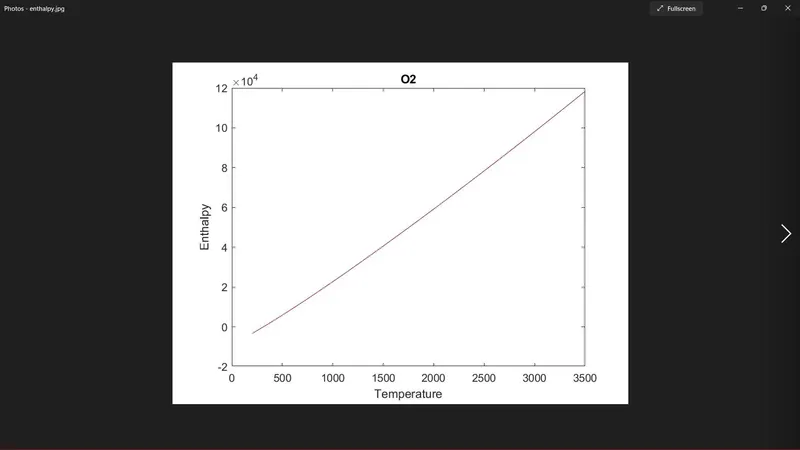
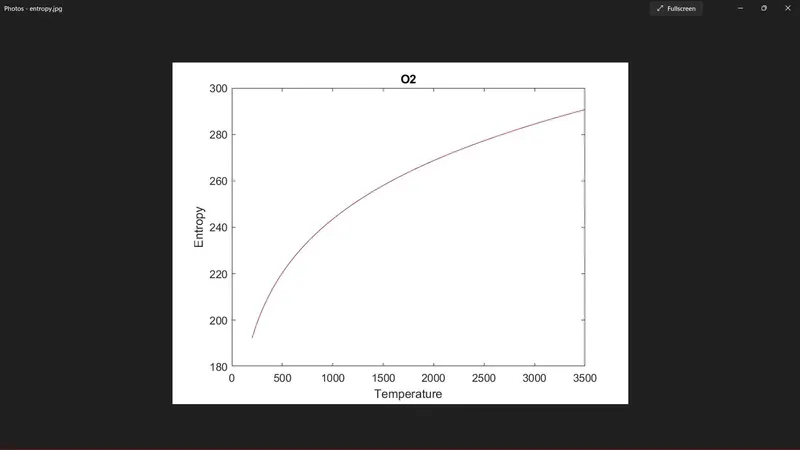
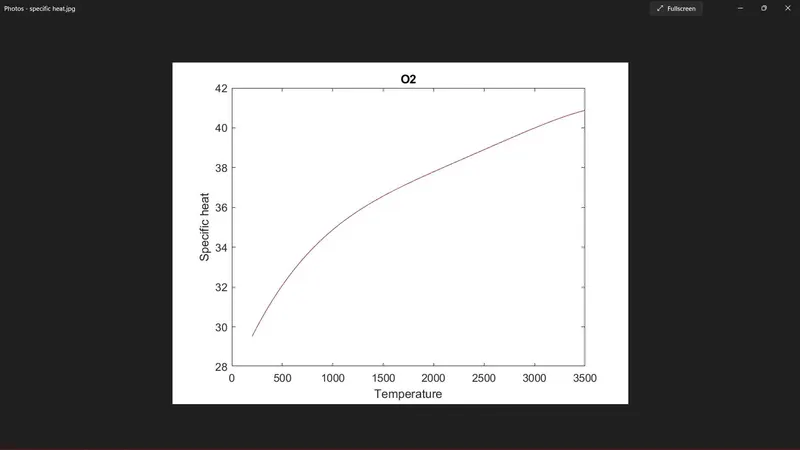
- Plotting various plots for each species by writing "plot()" commands separately for specific heat, enthalpy and entropy having title axis name separately. Further saving it in previously created folder by "cd()" and "saveas()".
- To calculate molecular weight of each species in "for" loop for each species_name and element molecular weight is calculated by a formula writen in code.
- In the end molecular weight is displayed by using "sprintf()" where %s is species_name and %f is molecular weight in floating numbers.
-Ending all for, if, else commands by "end" command also closing "THERMO.dat" file by "fclose()"
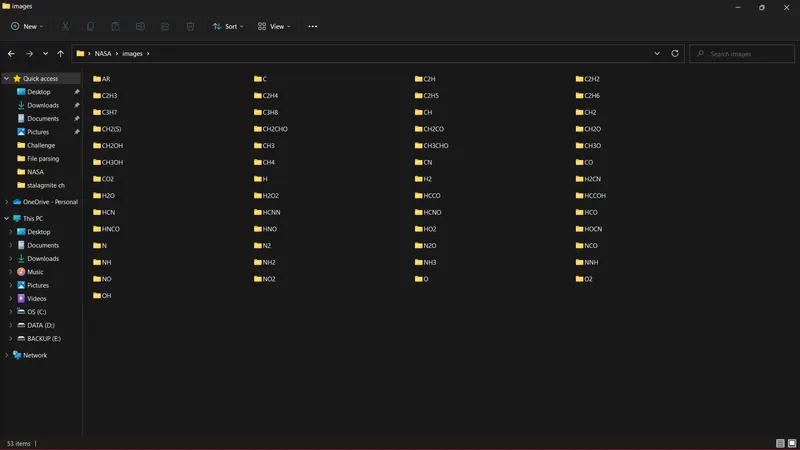
3) image of all folders having species plots
4) images of N2, O2, CO2
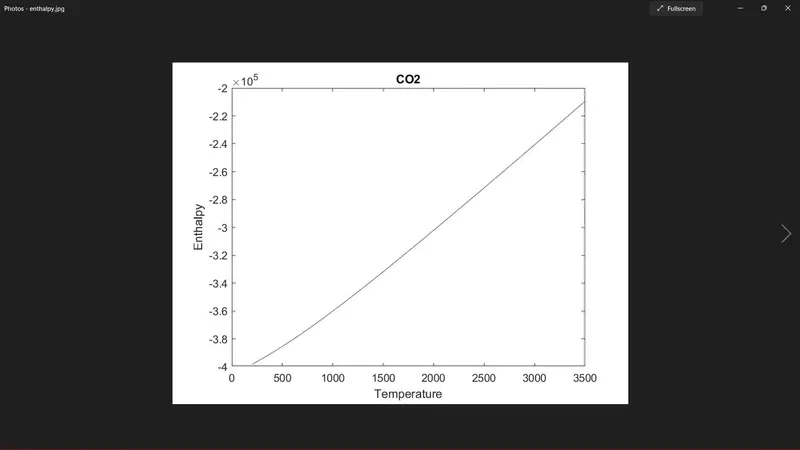
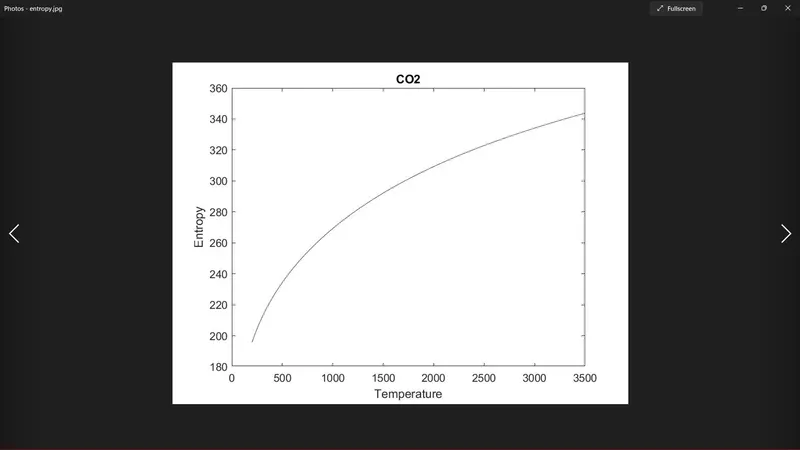
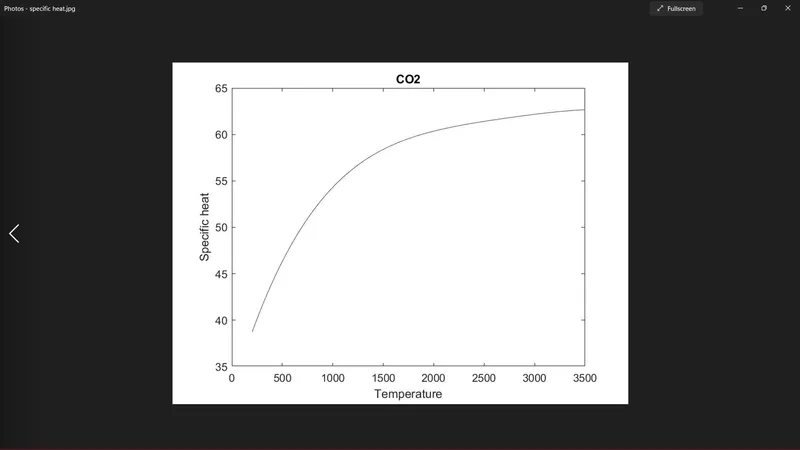
Referance: skill-lync student projects.
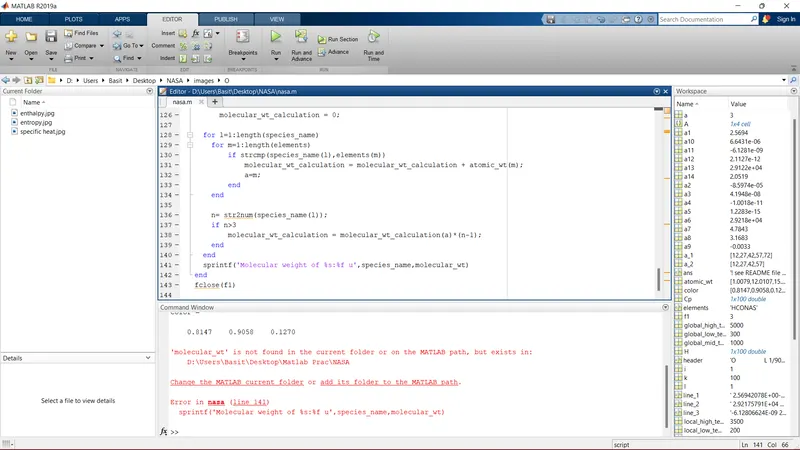
Errors occured: Typo error occured in line 141 that was resloved by typing correct variable.