Week 3 - Solving second order ODEs
To solve the 2nd order ODE using the MatLab function which is the motion of a pendulum and to create an animation
Explanation :
given equation
L=1 metre,
m=1 kg,
b=0.05.
g=9.81 m/s2
first of all we define the all input parameter
% inputs
l = 1;
m = 1;
b = 0.05;
g = 9.81;
% initial condition
theta_0 = [0;3];
% time points
t_span = linspace(0,20,400);
then we used a MatLab function of ode45 to solve the ode
function dtheta_dt = ode_fun(t,theta,b,g,l,m);
theta1 = theta(1);
theta2 = theta(2);
dtheta1_dt = theta2;
dtheta2_dt = -(b/m)*theta2 - (g/l)*sin(theta1);
dtheta_dt = [dtheta1_dt; dtheta2_dt];
end
then we get the logic to solve ode by function command we have defined all the relations between them and we used the same function in our main program
% solve ODE
[t, results] = ode45(@(t,theta) ode_func(t, theta, b,g,l,m),t_span, theta_0);
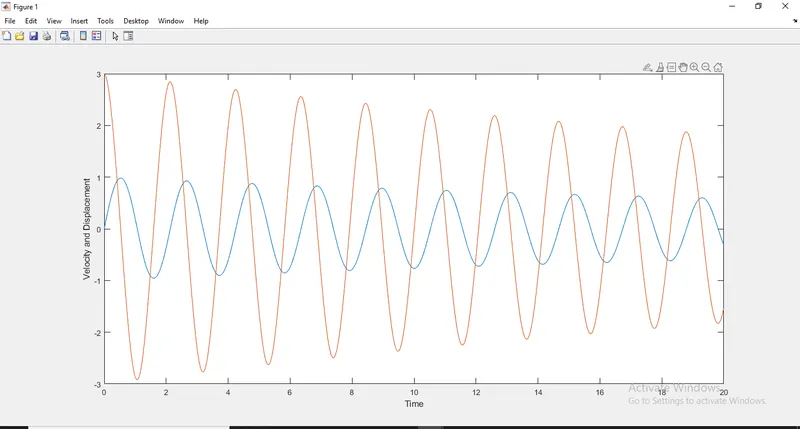
after that, we plot the results with the help of the plot command and we get a velocity and displacement diagram
figure(1)
plot(t,results(:,1))
hold on
plot(t,results(:,2))
ylabel('Velocity and Displacement')
xlabel('Time')
then we want the plot the coordinates to create a motion so we plot the resultant coordinate to create a motion for making an animation we have to plot all parameters of the animation and because motion and animation are related together we have to use FOR LOOP for that.
figure(2)
plot([-0.5 0.5],[0,0],'LineWidth',3 ,'color','g')
line([x0 x1],[y0,y1],'linewidth',3, 'color','b')
hold on
plot(x1,y1,'marker','o','MarkerSize',40,'MarkerFaceColor','r')
grid on
title('Moving pendulum with function of time')
axis([-1.5 1.5 -1.5 1]);
hold off
pause(0.0001)
M(ct) = getframe(gcf);
ct = ct+1;
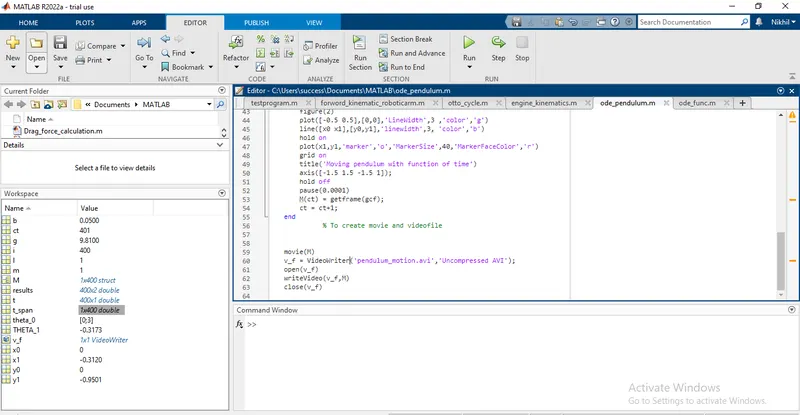
To create a movie we use the movie m command and created a movie of that animation
% To create movie and video file
movie(M)
v_f = VideoWriter('pendulum_motion.avi','Uncompressed AVI');
open(v_f)
writeVideo(v_f,M)
close(v_f)
FUNCTION PROGRAM
function dtheta_dt = ode_fun(t,theta,b,g,l,m);
theta1 = theta(1);
theta2 = theta(2);
dtheta1_dt = theta2;
dtheta2_dt = -(b/m)*theta2 - (g/l)*sin(theta1);
dtheta_dt = [dtheta1_dt; dtheta2_dt];
endMAIN PROGRAM
clear all
close all
clc
% inputs
l = 1;
m = 1;
b = 0.05;
g = 9.81;
% initial condition
theta_0 = [0;3];
% time points
t_span = linspace(0,20,400);
% solve ODE
[t, results] = ode45(@(t,theta) ode_func(t, theta, b,g,l,m),t_span, theta_0);
figure(1)
plot(t,results(:,1))
hold on
plot(t,results(:,2))
ylabel('Velocity and Displacement')
xlabel('Time')
%plotting the motion
ct = 1;
for i = 1:length(results(:,1));
THETA_1 = results(i,1);
% initial co ordinates
x0 = 0;
y0 = 0;
x1 = 1*sin(THETA_1);
y1 = -1*cos(THETA_1);
%plotting for an animation
figure(2)
plot([-0.5 0.5],[0,0],'LineWidth',3 ,'color','g')
line([x0 x1],[y0,y1],'linewidth',3, 'color','b')
hold on
plot(x1,y1,'marker','o','MarkerSize',40,'MarkerFaceColor','r')
grid on
title('Moving pendulum with function of time')
axis([-1.5 1.5 -1.5 1]);
hold off
pause(0.0001)
M(ct) = getframe(gcf);
ct = ct+1;
end
% To create movie and videofile

movie(M)
v_f = VideoWriter('pendulum_motion.avi','Uncompressed AVI');
open(v_f)
writeVideo(v_f,M)
close(v_f)
Output:
on x axis TIME is shown and on y axis velocity (red) and displacement (blue) because we take the time span t_span = linspace(0,20,400); in btween 0 to 20 we get 400 values.
Animation video :